Off-price retail company Burlington Stores (NYSE:BURL) reported Q4 FY2023 results exceeding Wall Street analysts' expectations, with revenue up 13.9% year on year to $3.13 billion. It made a non-GAAP profit of $3.66 per share, improving from its profit of $2.96 per share in the same quarter last year.
Burlington (BURL) Q4 FY2023 Highlights:
- Revenue: $3.13 billion vs analyst estimates of $3.05 billion (2.4% beat)
- EPS (non-GAAP): $3.66 vs analyst estimates of $3.30 (10.9% beat)
- EPS (non-GAAP) Guidance for 2024 is $7.30 at the midpoint, above analyst estimates of $7.07
- Free Cash Flow of $410.3 million, down 14.2% from the same quarter last year
- Gross Margin (GAAP): 42.8%, up from 40.8% in the same quarter last year
- Same-Store Sales were up 2% year on year
- Store Locations: 1,007 at quarter end, increasing by 80 over the last 12 months
- Market Capitalization: $13.16 billion
Founded in 1972 as a discount coat and outerwear retailer, Burlington Stores (NYSE:BURL) is now an off-price retailer that has broadened into general apparel, footwear, and home goods.
For example, if department store Kohl’s is left with a glut of swimsuits because of unusually cold weather, Kohl’s may sell those in bulk to Burlington at pennies on the dollar rather than discount the items and try to sell them individually. This is often done to clear floor space for a new season.
Burlington’s buying approach focuses on finding excess inventory or overstocked items from other retailers, so selection can change quickly and be varied. Shopping at Burlington is often a treasure hunt–what the consumer loses in reliable selection or the latest trends is made up for with very low prices. Prices of Burlington merchandise can be significantly lower than those of department stores. Over time, the company’s size and buying power has led to a more consistent selection of items from brands such as Tommy Hilfiger, Champion, and Dyson to name a few.
The core customer is the value-conscious shopper who enjoys the thrill of the hunt. This customer is typically a middle-aged, middle-income woman. This customer is willing to spend more time going through less organized racks and shopping exclusively in person–since Burlington has a very limited online presence–in exchange for meaningful discounts.
Off-Price Apparel and Home Goods Retailer
Off-price retailers, which sell name-brand goods at major discounts because of their unique purchasing and procurement strategies, understand that everyone loves a good deal. Specifically, these companies buy excess inventory and overstocks from manufacturers and other retailers so they can turn around and offer these products at super competitive prices. Despite the unique draw lure of discounts, these off-price retailers must also contend with the secular headwinds of online penetration and stalling retail foot traffic in places like suburban shopping centers.
Off-price and discount retail competitors include TJX (NYSE:TJX), Ross Stores (NASDAQ:ROST), and Ollie’s Bargain Outlet (NASDAQ:OLLI).Sales Growth
Burlington is larger than most consumer retail companies and benefits from economies of scale, giving it an edge over its competitors.
As you can see below, the company's annualized revenue growth rate of 7.5% over the last four years (we compare to 2019 to normalize for COVID-19 impacts) was weak as it opened new stores and expanded its reach.
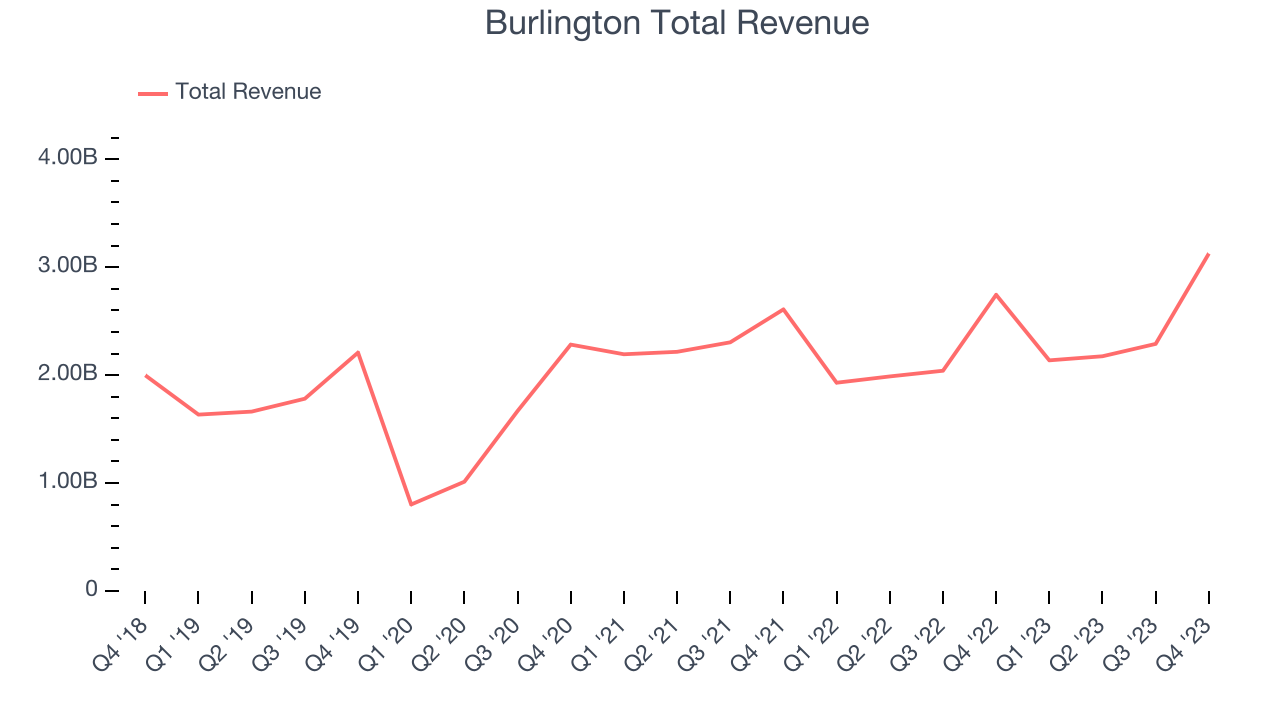
This quarter, Burlington reported robust year-on-year revenue growth of 13.9%, and its $3.13 billion in revenue exceeded Wall Street's estimates by 2.4%. Looking ahead, Wall Street expects sales to grow 7.2% over the next 12 months, a deceleration from this quarter.
Number of Stores
When a retailer like Burlington is opening new stores, it usually means it's investing for growth because demand is greater than supply. Since last year, Burlington's store count increased by 80 locations, or 8.6%, to 1,007 total retail locations in the most recently reported quarter.
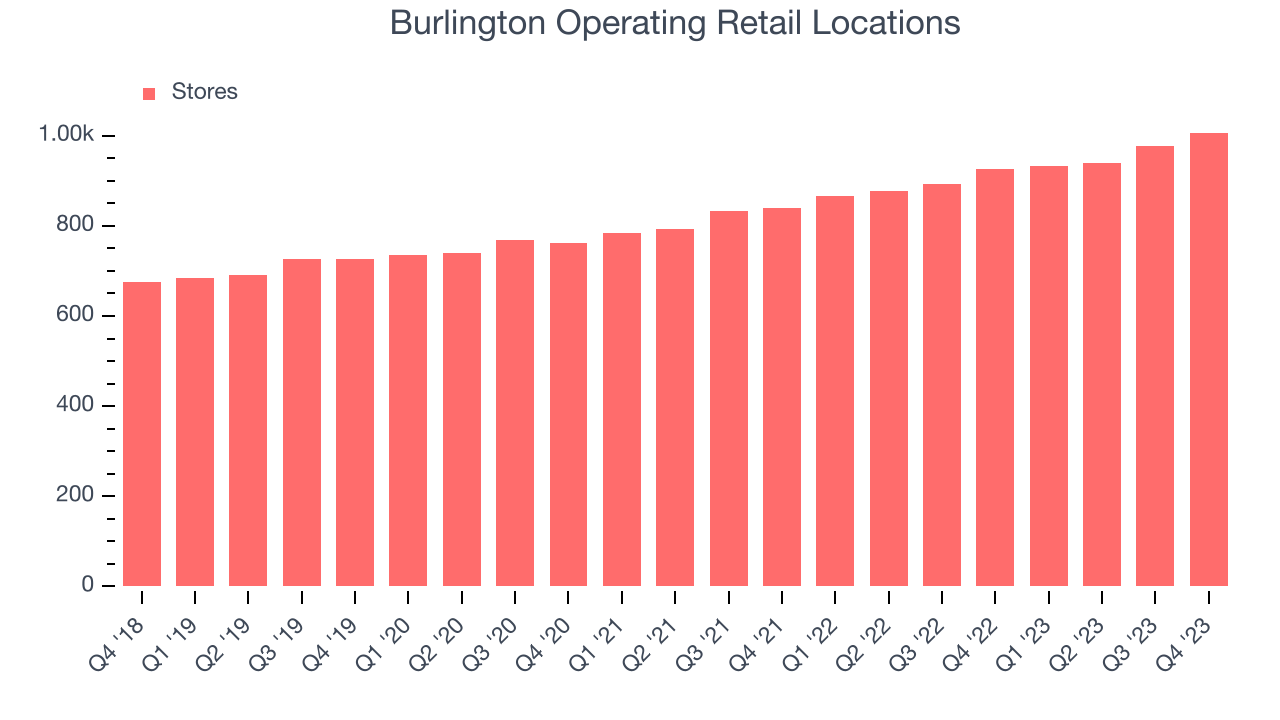
Taking a step back, the company has rapidly opened new stores over the last eight quarters, averaging 9% annual growth in its physical footprint. This store growth is much higher than other retailers. With an expanding store base and demand, revenue growth can come from multiple vectors: sales from new stores, sales from e-commerce, or increased foot traffic and higher sales per customer at existing stores.
Same-Store Sales
Burlington's demand has been shrinking over the last eight quarters, and on average, its same-store sales have declined by 4.8% year on year. This performance is quite concerning and the company should reconsider its strategy before investing its precious capital into new store buildouts.
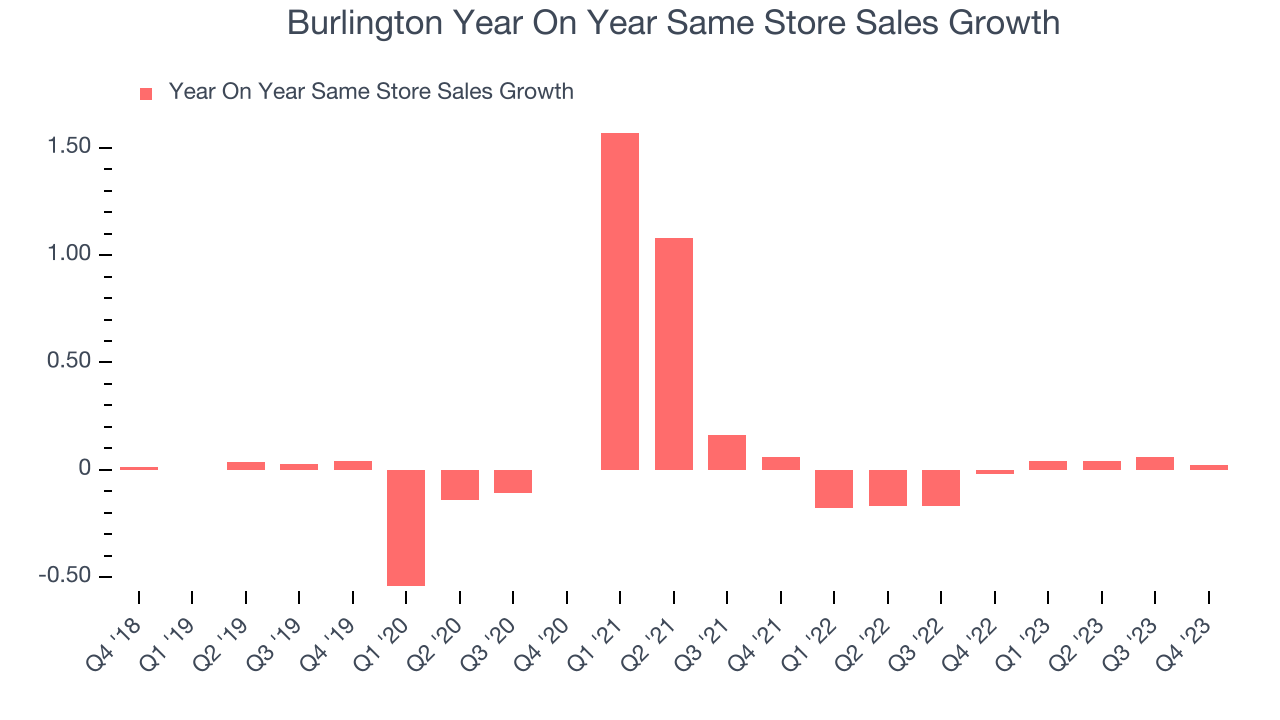
In the latest quarter, Burlington's same-store sales rose 2% year on year. This growth was a well-appreciated turnaround from the 2% year-on-year decline it posted 12 months ago, showing the business is regaining momentum.
Gross Margin & Pricing Power
We prefer higher gross margins because they make it easier to generate more operating profits.
Burlington has good unit economics for a retailer, giving it the opportunity to invest in areas such as marketing and talent to stay competitive. As you can see below, it's averaged a healthy 41.6% gross margin over the last two years. This means the company makes $0.42 for every $1 in revenue before accounting for its operating expenses.
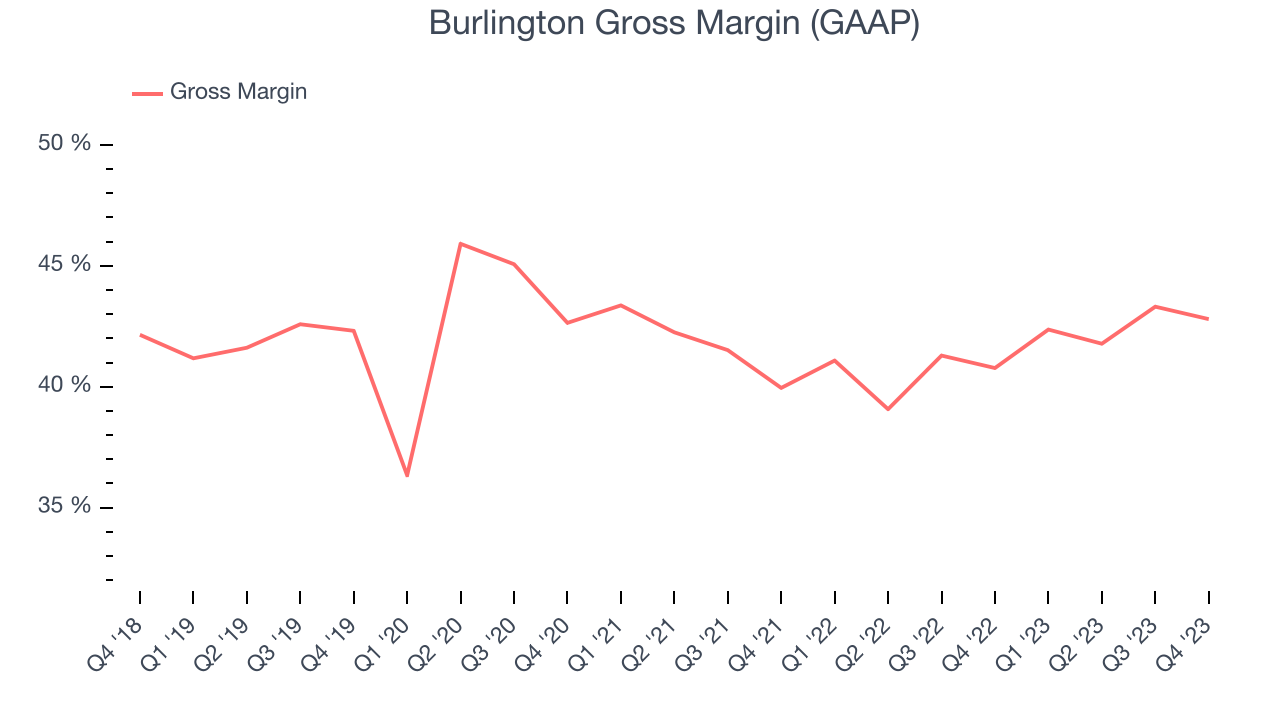
Burlington's gross profit margin came in at 42.8% this quarter, marking a 2 percentage point increase from 40.8% in the same quarter last year. This margin expansion is a good sign in the near term. If this trend continues, it could signal a less competitive environment where the company has better pricing power, less pressure to discount products, and more stable input costs (such as distribution expenses to move goods).
Operating Margin
Operating margin is a key profitability metric for retailers because it accounts for all expenses keeping the lights on, including wages, rent, advertising, and other administrative costs.
In Q4, Burlington generated an operating profit margin of 13%, up 3.2 percentage points year on year. This increase was encouraging, and we can infer Burlington was more disciplined with its expenses or gained leverage on fixed costs because its operating margin expanded more than its gross margin.
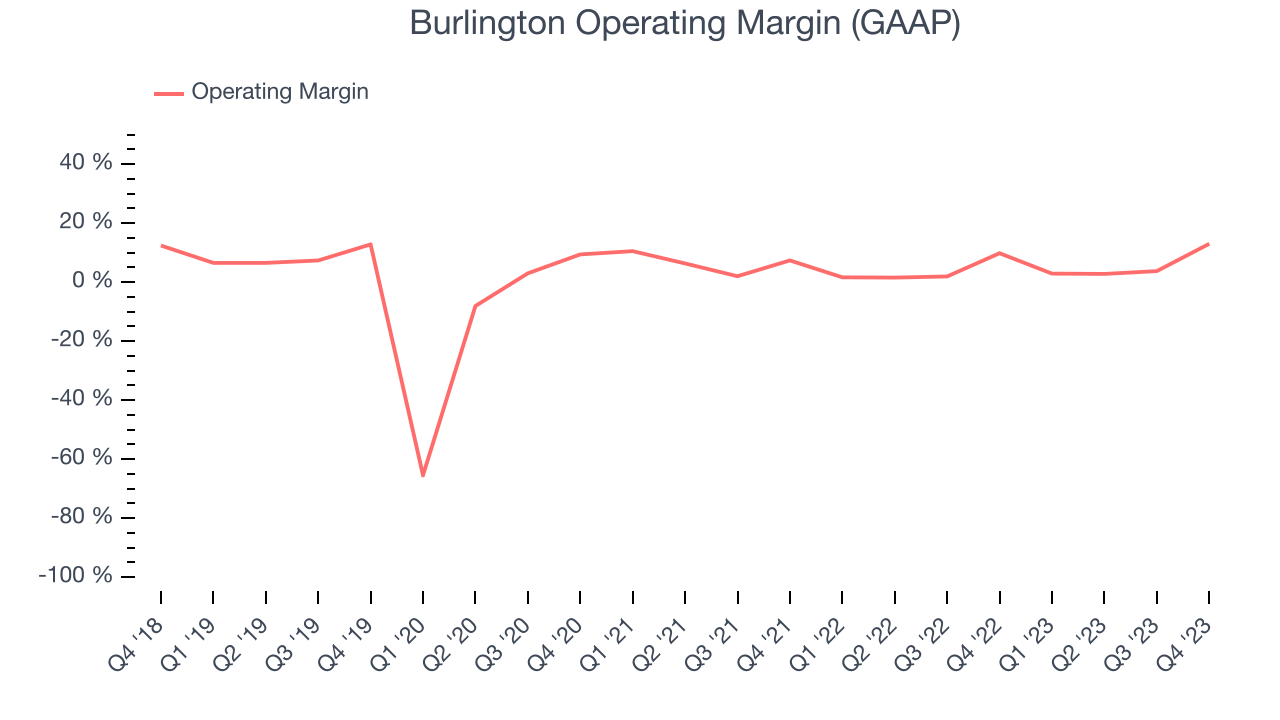 Zooming out, Burlington was profitable over the last eight quarters but held back by its large expense base. It's demonstrated subpar profitability for a consumer retail business, producing an average operating margin of 5.4%. However, Burlington's margin has improved, on average, by 2.1 percentage points year on year, an encouraging sign for shareholders. The tide could be turning.
EPS
These days, some companies issue new shares like there's no tomorrow. That's why we like to track earnings per share (EPS) because it accounts for shareholder dilution and share buybacks.
In Q4, Burlington reported EPS at $3.66, up from $2.96 in the same quarter a year ago. This print beat Wall Street's estimates by 10.9%.
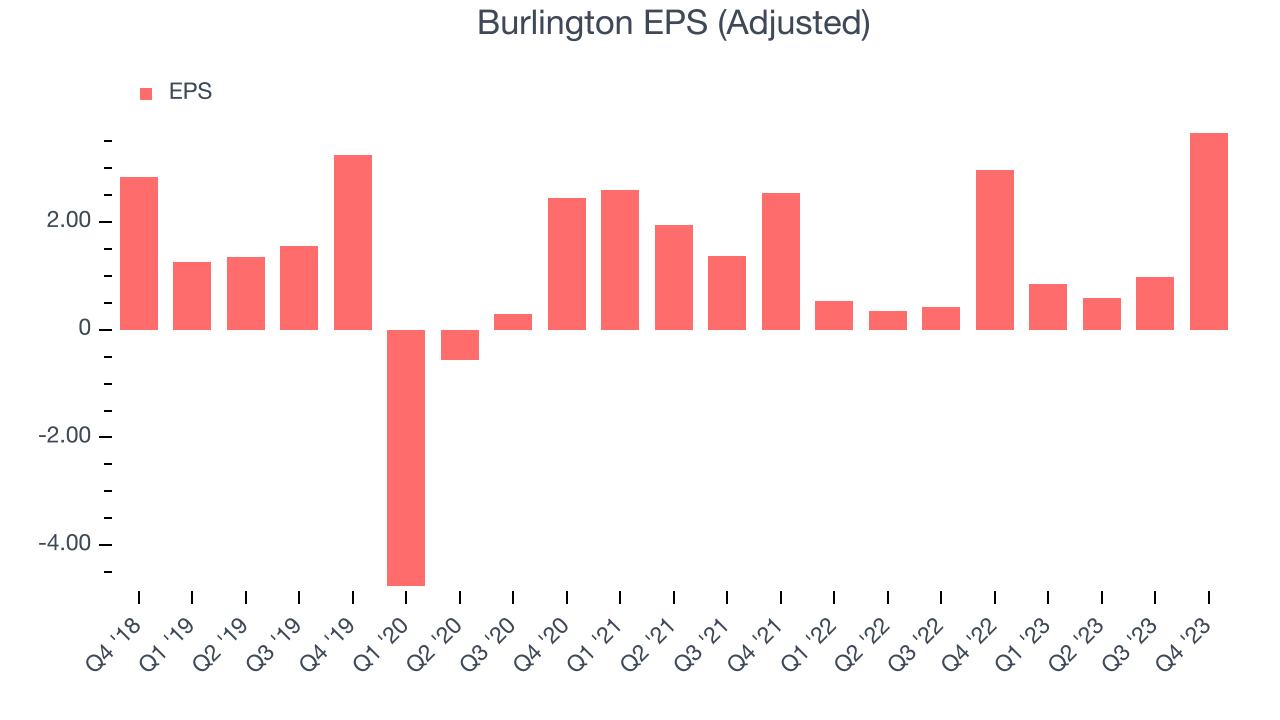
Between FY2019 and FY2023, Burlington's adjusted diluted EPS dropped 18%, translating into 4.8% annualized declines. In a mature sector such as consumer retail, we tend to steer our readers away from companies with falling EPS. If there's no earnings growth, it's difficult to build confidence in a business's underlying fundamentals, leaving a low margin of safety around the company's valuation (making the stock susceptible to large downward swings).
On the bright side, Wall Street expects the company's earnings to grow over the next 12 months, with analysts projecting an average 17.7% year-on-year increase in EPS.
Cash Is King
Although earnings are undoubtedly valuable for assessing company performance, we believe cash is king because you can't use accounting profits to pay the bills.
Burlington's free cash flow came in at $410.3 million in Q4, down 14.2% year on year. This result represents a 13.1% margin.
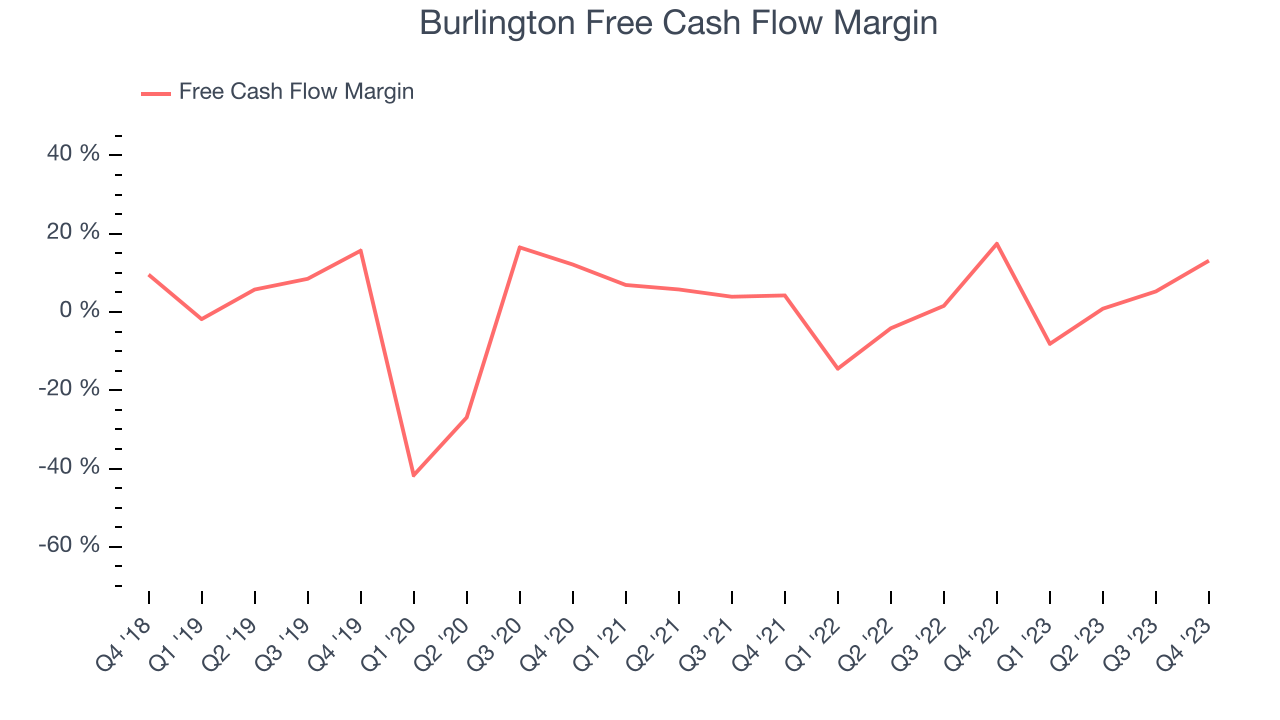
Over the last two years, Burlington has shown decent cash profitability, giving it some reinvestment opportunities. The company's free cash flow margin has averaged 2.8%, slightly better than the broader consumer retail sector. Furthermore, its margin has averaged year-on-year increases of 2.2 percentage points. This likely pleases the company's investors.
Return on Invested Capital (ROIC)
EPS and free cash flow tell us whether a company was profitable while growing revenue. But was it capital-efficient? A company’s ROIC explains this by showing how much operating profit a company makes compared to how much money the business raised (debt and equity).
Burlington's five-year average ROIC was 8.3%, somewhat low compared to the best retail companies that consistently pump out 25%+. Its returns suggest it historically did a subpar job investing in profitable business initiatives.
The trend in its ROIC, however, is often what surprises the market and drives the stock price. Over the last two years, Burlington's ROIC averaged 1.6 percentage point increases each year. This is a good sign and we hope the company can continue to improving.
Key Takeaways from Burlington's Q4 Results
It was great to see Burlington's strong earnings forecast for the full year, which exceeded analysts' expectations. We were also excited its revenue outperformed Wall Street's estimates. On the other hand, its earnings forecast for next quarter missed analysts' expectations. Overall, this quarter's results seemed fairly positive and shareholders should feel optimistic. The stock is up 6.8% after reporting and currently trades at $219.93 per share.
Is Now The Time?
Burlington may have had a favorable quarter, but investors should also consider its valuation and business qualities when assessing the investment opportunity.
We cheer for all companies serving consumers, but in the case of Burlington, we'll be cheering from the sidelines. Its revenue growth has been a little slower over the last four years, and analysts don't see anything changing. And while its projected EPS for the next year implies the company's fundamentals will improve, the downside is its shrinking same-store sales suggests it'll need to change its strategy to succeed. On top of that, its relatively low ROIC suggests it has struggled to grow profits historically.
Burlington's price-to-earnings ratio based on the next 12 months is 28.7x. While we've no doubt one can find things to like about Burlington, we think there are better opportunities elsewhere in the market. We don't see many reasons to get involved at the moment.
Wall Street analysts covering the company had a one-year price target of $214.20 per share right before these results (compared to the current share price of $219.93), implying they didn't see much short-term potential in Burlington.
To get the best start with StockStory, check out our most recent stock picks, and then sign up to our earnings alerts by adding companies to your watchlist here. We typically have the quarterly earnings results analyzed within seconds of the data being released, and especially for companies reporting pre-market, this often gives investors the chance to react to the results before the market has fully absorbed the information.