
Online new and used car marketplace Cars.com (NYSE:CARS) reported results in line with analysts' expectations in Q1 CY2024, with revenue up 7.8% year on year to $180.2 million. The company expects next quarter's revenue to be around $182 million, in line with analysts' estimates. It made a GAAP profit of $0.01 per share, down from its profit of $0.17 per share in the same quarter last year.
Cars.com (CARS) Q1 CY2024 Highlights:
- Revenue: $180.2 million vs analyst estimates of $179.4 million (small beat)
- EPS: $0.01 vs analyst estimates of $0.08 (-$0.07 miss)
- Revenue Guidance for Q2 CY2024 is $182 million at the midpoint, roughly in line with what analysts were expecting
- Gross Margin (GAAP): 83.4%, up from 67.7% in the same quarter last year
- Free Cash Flow of $27.46 million, down 31.1% from the previous quarter
- Dealer Customers: 19,381, up 195 year on year
- Market Capitalization: $1.13 billion
Originally started as a joint venture between several media companies including The Washington Post and The New York Times, Cars.com (NYSE:CARS) is a digital marketplace that connects new and used car buyers and sellers.
The company's primary product is its website, which allows users to search for new and used cars, research vehicles, and connect with dealerships. Cars.com provides a centralized platform that helps customers make more informed decisions amd simplifies the car buying process.
First, customers can search for cars based on preferences, such as model, price range, and location. This eliminates the need to visit multiple dealerships. Second, the platform provides information about each car, including photos and specifications. This allows consumers to make more informed decisions. Third, the platform provides tools that allow buyers to connect with local dealerships to ask follow-up questions and schedule test drives. This allows buyers to find the right dealership and car. Finally, the platform offers resources such as financing and insurance options. This closes the loop on an actual transaction.
While the platform aims to optimize the buyer experience, Cars.com generates revenue primarily from car dealers who pay for marketplace subscription advertising products. Specifically, dealers pay to have their inventory listed and featured on the Cars.com platform. Other revenue generators include dealer website hosting and reputation management products.
Online Marketplace
Marketplaces have existed for centuries. Where once it was a main street in a small town or a mall in the suburbs, sellers benefitted from proximity to one another because they could draw customers by offering convenience and selection. Today, a myriad of online marketplaces fulfill that same role, aggregating large customer bases, which attracts commission-paying sellers, generating flywheel scale effects that feed back into further customer acquisition.
Competitors in the online auto market include Carvana (NYSE:CVNA), CarGurus (NASDAQ:CARG), and Vroom (NASDAQ:VRM).Sales Growth
Cars.com's revenue growth over the last three years has been unremarkable, averaging 9.4% annually. This quarter, Cars.com reported mediocre 7.8% year-on-year revenue growth, in line with analysts' expectations.
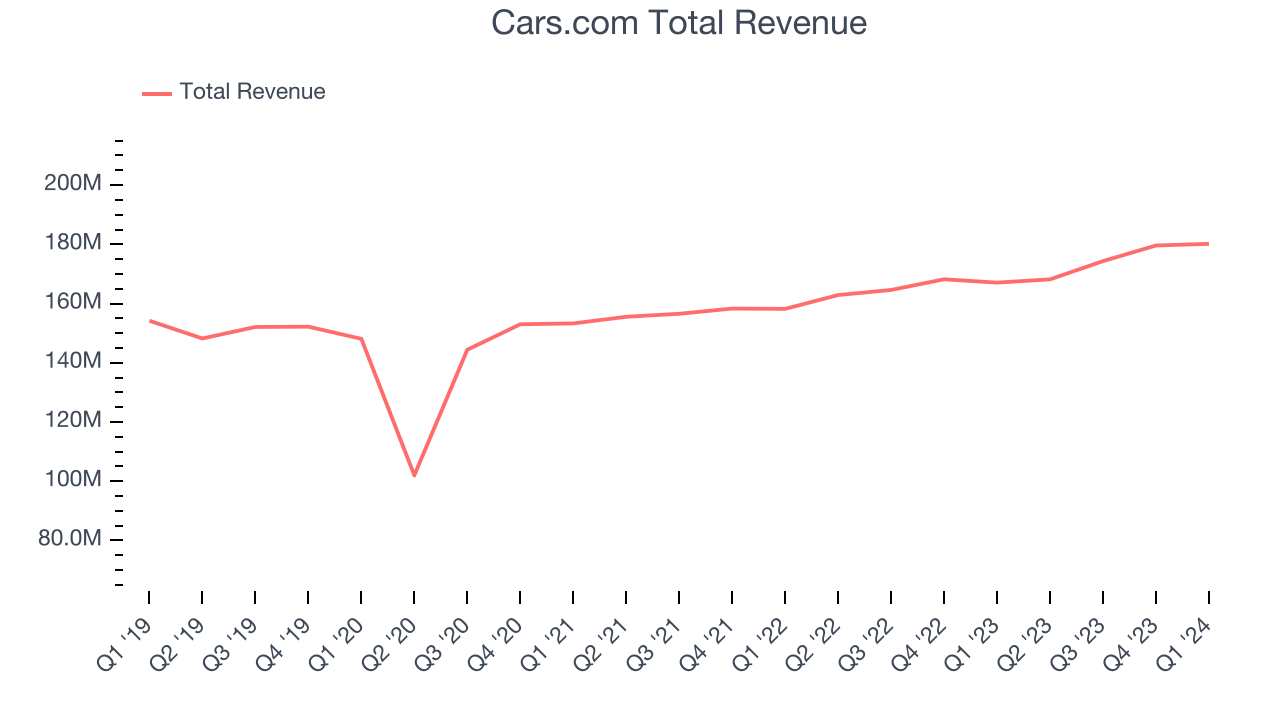
Guidance for the next quarter indicates Cars.com is expecting revenue to grow 8.2% year on year to $182 million, improving from the 3.3% year-on-year increase it recorded in the comparable quarter last year. Ahead of the earnings results, analysts were projecting sales to grow 6.2% over the next 12 months.
Usage Growth
As an online marketplace, Cars.com generates revenue growth by increasing both the number of buyers on its platform and the average order size in dollars.
Cars.com has been struggling to grow its active buyers, a key performance metric for the company. Over the last two years, its buyers have declined 0.1% annually to 19,381. This is one of the lowest rates of growth in the consumer internet sector.
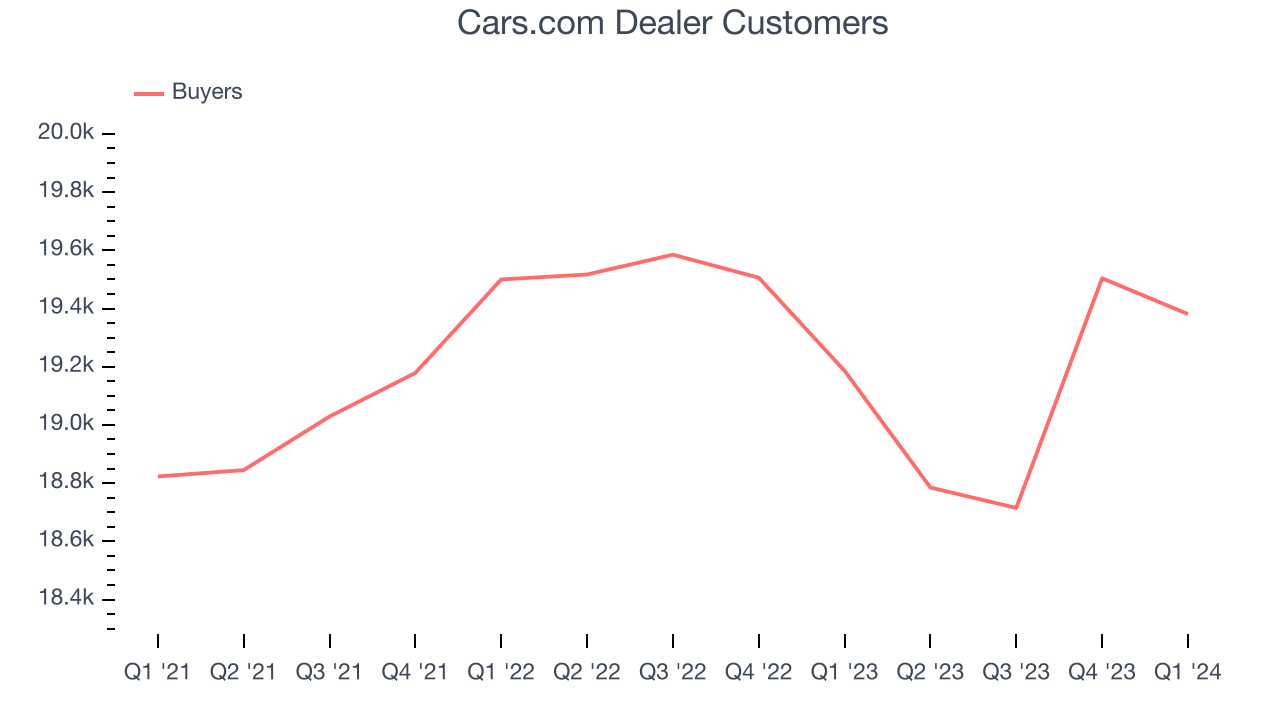
Luckily, Cars.com added 195 active buyers in Q1, leading to 1% year-on-year growth.
Revenue Per Buyer
Average revenue per buyer (ARPB) is a critical metric to track for consumer internet businesses like Cars.com because it measures how much the company earns in transaction fees from each buyer. Furthermore, ARPB gives us unique insights as it's a function of a user's average order size and Cars.com's take rate, or "cut", on each order.
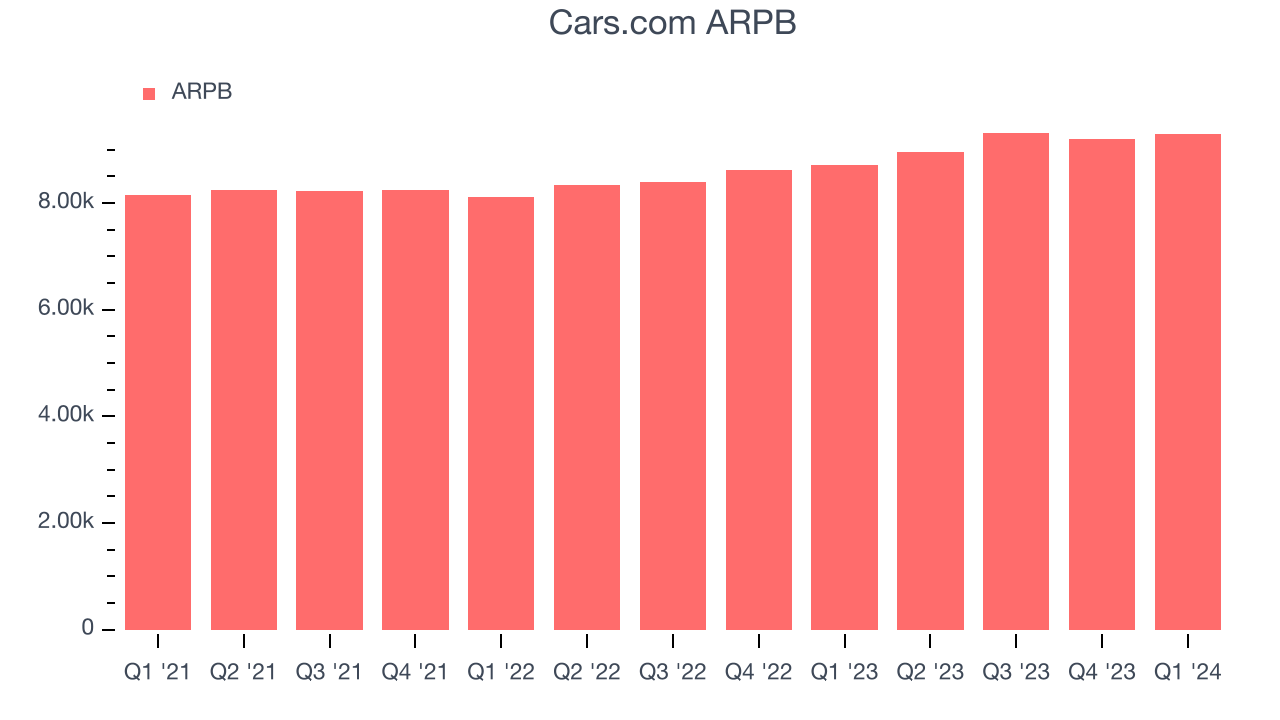
Cars.com's ARPB growth has been decent over the last two years, averaging 5.8%. Although its active buyers have shrunk during this time, the company's ability to increase prices demonstrates its platform's value for existing buyers. This quarter, ARPB grew 6.8% year on year to $9,297 per buyer.
Pricing Power
A company's gross profit margin has a major impact on its ability to exert pricing power, develop new products, and invest in marketing. These factors may ultimately determine the winner in a competitive market, making it a critical metric to track for the long-term investor.
Cars.com's gross profit margin, which tells us how much money the company gets to keep after covering the base cost of its products and services, came in at 83.4% this quarter, up 15.6 percentage points year on year.
For online marketplaces like Cars.com, these aforementioned costs typically include payment processing, hosting, and bandwidth fees in addition to the costs necessary to onboard buyers and sellers, such as identity verification. After paying for these expenses, Cars.com had $0.83 for every $1 in revenue to invest in marketing, talent, and the development of new products and services.
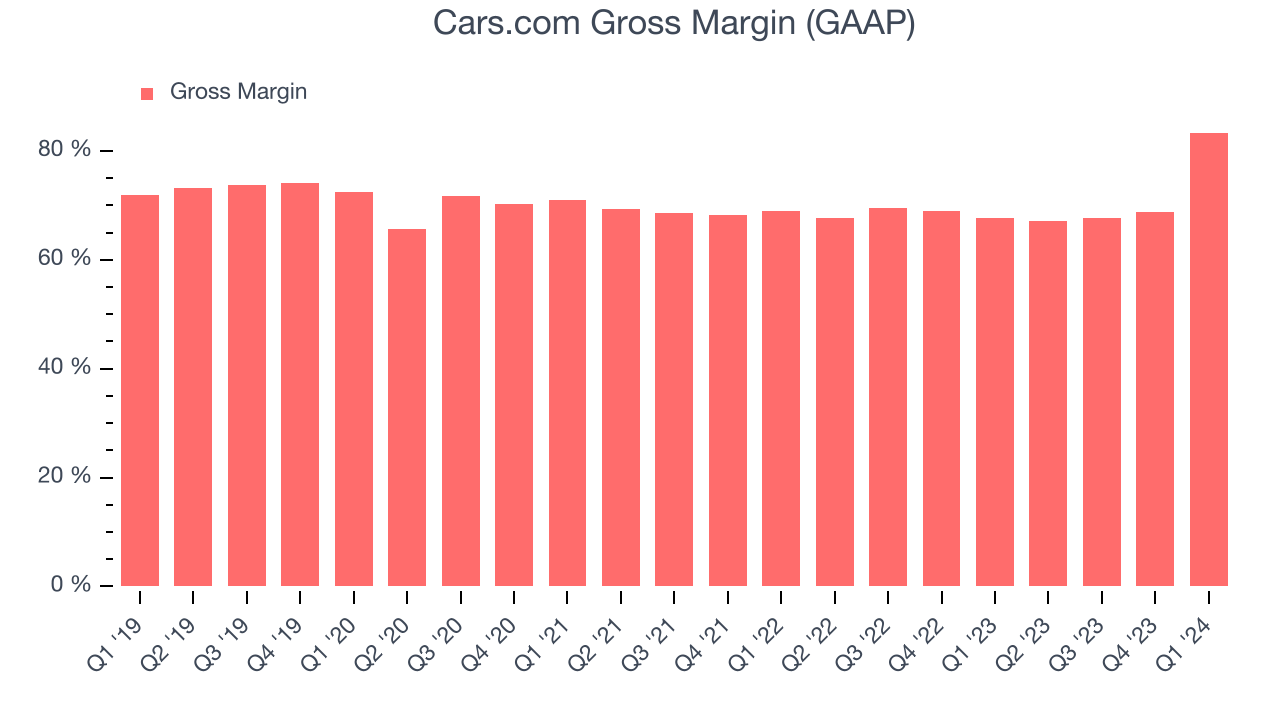
Over the past year, Cars.com has seen its already strong gross margins rise, averaging 71.8%. These robust unit economics, driven by the company's lucrative business model and strong pricing power, are higher than its peers and allow Cars.com to make more investments in product and marketing.
User Acquisition Efficiency
Unlike enterprise software that's typically sold by dedicated sales teams, consumer internet businesses like Cars.com grow from a combination of product virality, paid advertisement, and incentives.
It's relatively expensive for Cars.com to acquire new users as the company has spent 47.4% of its gross profit on sales and marketing expenses over the last year. This level of efficiency indicates that Cars.com has to compete for its users and continue investing to maintain its growth trajectory.
Profitability & Free Cash Flow
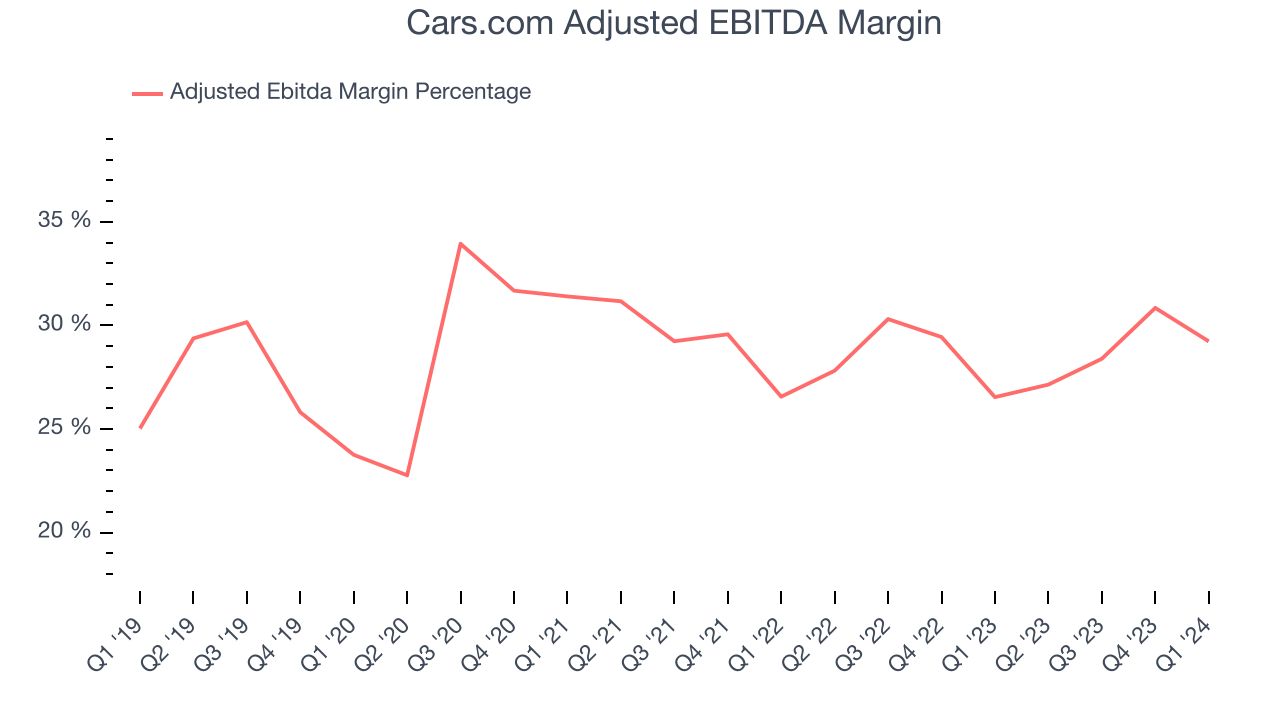
Investors frequently analyze operating income to understand a business's core profitability. Similar to operating income, adjusted EBITDA is the most common profitability metric for consumer internet companies because it removes various one-time or non-cash expenses, offering a more normalized view of a company's profit potential.
This quarter, Cars.com's EBITDA came in at $52.67 million, resulting in a 29.2% margin. Additionally, Cars.com has demonstrated extremely high profitability over the last four quarters, with average EBITDA margins of 28.9%.
If you've followed StockStory for a while, you know that we emphasize free cash flow. Why, you ask? We believe that in the end, cash is king, and you can't use accounting profits to pay the bills. Cars.com's free cash flow came in at $27.46 million in Q1, up 20.6% year on year.
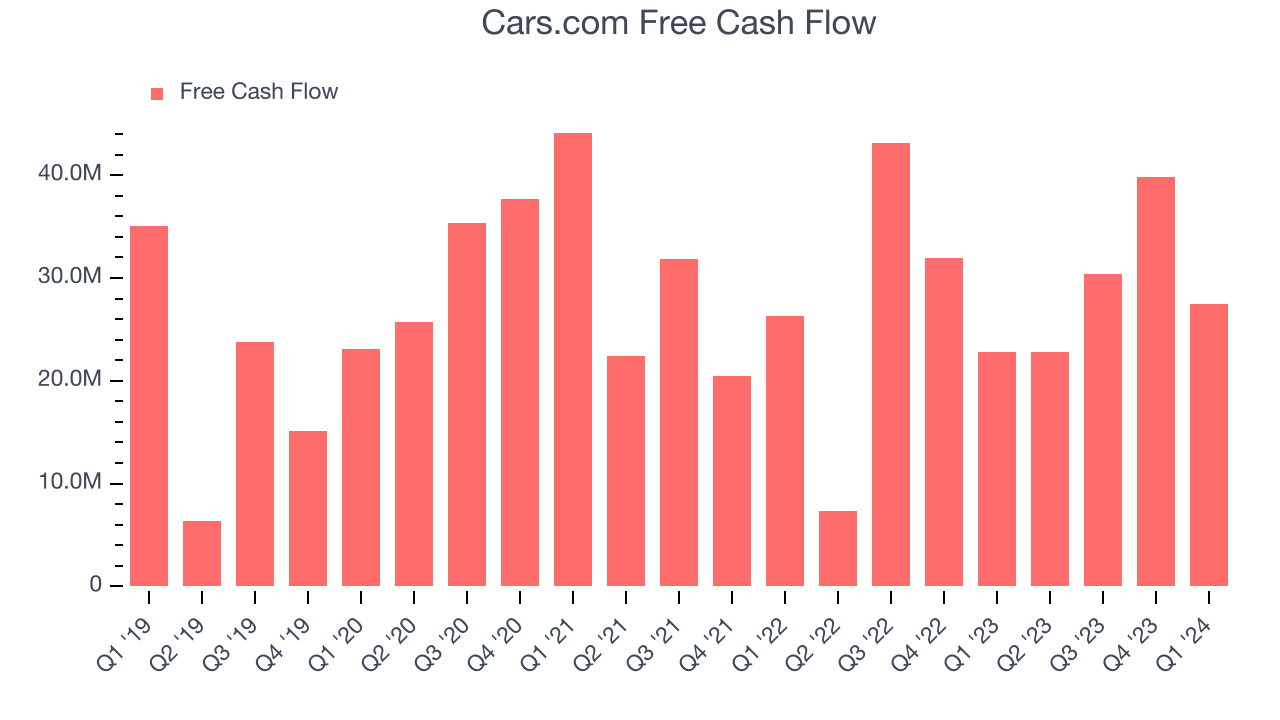
Cars.com has generated $120.5 million in free cash flow over the last 12 months, an impressive 17.2% of revenue. This high FCF margin stems from its asset-lite business model and strong competitive positioning, giving it the option to return capital to shareholders or reinvest in its business while maintaining a cash cushion.
Key Takeaways from Cars.com's Q1 Results
We struggled to find many strong positives in these results. Its revenue growth regrettably slowed and its EPS missed analysts' estimates. On the bright side, its full-year revenue guidance beat Wall Street's expectations, sending the stock higher. Cars.com is up 4% after reporting and currently trades at $17.75 per share.
Is Now The Time?
When considering an investment in Cars.com, investors should take into account its valuation and business qualities as well as what's happened in the latest quarter.
Although we have other favorites, we understand the arguments that Cars.com isn't a bad business. Although its revenue growth has been a little slower over the last three years, its strong free cash flow generation allows it to invest in growth initiatives while maintaining an ample cash cushion. Investors should still be cautious, however, as its active buyers have declined.
At the moment, Cars.com trades at 5.3x next 12 months EV-to-EBITDA. In the end, beauty is in the eye of the beholder. While Cars.com wouldn't be our first pick, if you like the business, the shares are trading at a pretty interesting price right now.
Wall Street analysts covering the company had a one-year price target of $24.08 per share right before these results (compared to the current share price of $17.75).
To get the best start with StockStory check out our most recent Stock picks, and then sign up to our earnings alerts by adding companies to your watchlist here. We typically have the quarterly earnings results analyzed within seconds of the data being released, and especially for the companies reporting pre-market, this often gives investors the chance to react to the results before the market has fully absorbed the information.