
Cruise ship company Carnival (NYSE:CCL) reported results in line with analysts' expectations in Q1 CY2024, with revenue up 22% year on year to $5.41 billion. It made a non-GAAP loss of $0.14 per share, improving from its loss of $0.55 per share in the same quarter last year.
Carnival (CCL) Q1 CY2024 Highlights:
- Revenue: $5.41 billion vs analyst estimates of $5.40 billion (small beat)
- EPS (non-GAAP): -$0.14 vs analyst estimates of -$0.18 ($0.04 beat)
- Guidance for full year 2024 adjusted EBITDA of $5.63 billion is right in line with analyst estimates
- Gross Margin (GAAP): 47.4%, up from 42.1% in the same quarter last year
- Free Cash Flow was -$370 million, down from $64.17 million in the previous quarter
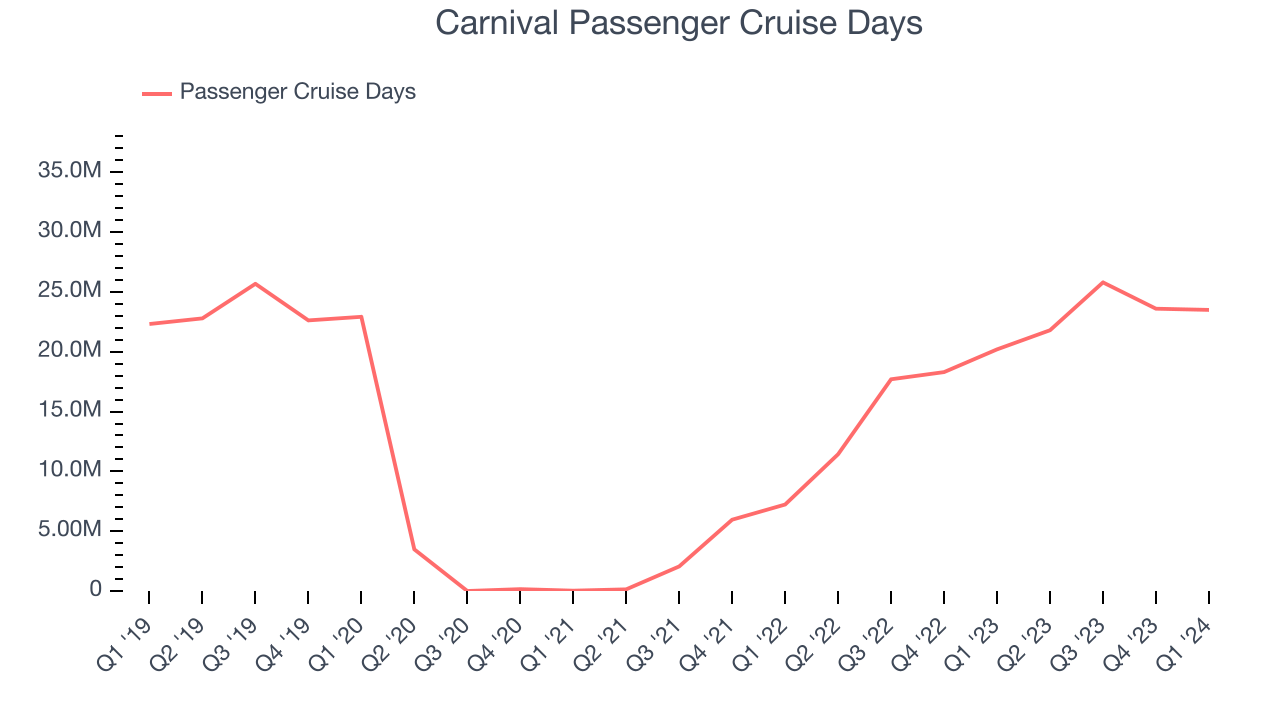
- Passenger Cruise Days: 23.5 million (miss vs. expectations of 24.0 million)
- Market Capitalization: $21.28 billion
Boasting outrageous amenities like a planetarium on board its ships, Carnival (NYSE:CCL) is one of the world's largest leisure travel companies and a prominent player in the cruise industry.
Carnival operates a vast fleet of ~90 ships, each offering a range of cruise experiences to suit various traveler preferences. Its portfolio consists of nine brands, including its flagship Carnival Cruise Line along with Princess Cruises, Holland America Line, Seabourn, Costa Cruises, AIDA Cruises, P&O Cruises (UK), and Cunard. Each brand has its unique identity and market segment, ranging from fun and family-friendly to luxury and exotic.
On its cruises, the company offers comprehensive packages of entertainment, dining, accommodation, and activities. Its fleet travels to many destinations around the world, including the Caribbean, Alaska, Europe, South America, and Asia-Pacific regions.
Carnival's flagship brand, Carnival Cruise Line, accounts for a majority of its revenue and prides itself on affordability, catering to the mass market. Its number two and three brands by revenue are Princess Cruises and Holland America Line, which are also reasonably priced. As such, the company's marketing strategy emphasizes the value and convenience of its cruise vacations compared to traditional land-based holidays.
Hotels, Resorts and Cruise Lines
Hotels, resorts, and cruise line companies often sell experiences rather than tangible products, and in the last decade-plus, consumers have slowly shifted from buying "things" (wasteful) to buying "experiences" (memorable). In addition, the internet has introduced new ways of approaching leisure and lodging such as booking homes and longer-term accommodations. Traditional hotel, resorts, and cruise line companies must innovate to stay relevant in a market rife with innovation.
Carnival Corporation (NYSE:CCL) primary competitors include Royal Caribbean (NYSE:RCL), Norwegian Cruise Line (NYSE:NCLH), Disney Cruise Line (owned by Disney, NYSE:DIS), and private companies Viking Cruises and MSC Cruises.Sales Growth
Examining a company's long-term performance can provide clues about its business quality. Any business can put up a good quarter or two, but the best consistently grow over the long haul. Carnival's annualized revenue growth rate of 3.2% over the last five years was weak for a consumer discretionary business.
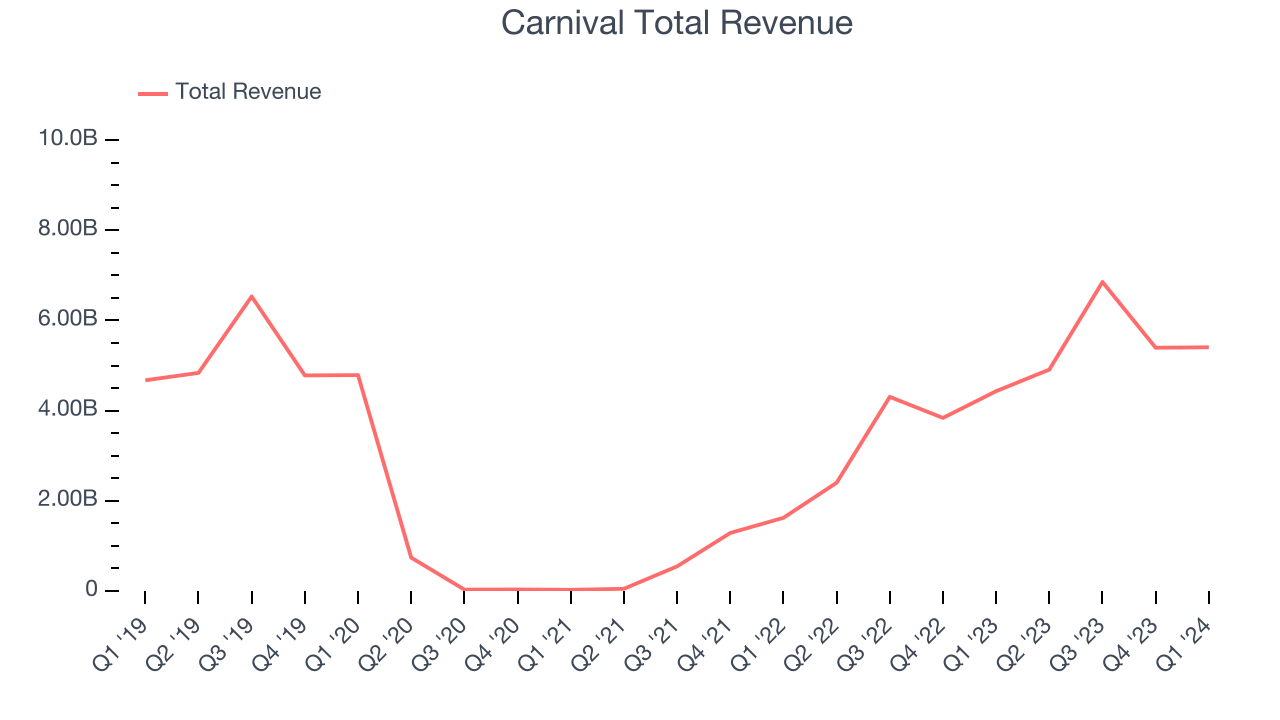
Within consumer discretionary, a long-term historical view may miss a company riding a successful new property or emerging trend. That's why we also follow short-term performance. Carnival's annualized revenue growth of 154% over the last two years is above its five-year trend, suggesting some bright spots as the world emerged from COVID lockdowns and restrictions. We can dig even further into the company's revenue dynamics by analyzing its number of passenger cruise days, which reached 23.5 million in the latest quarter. Over the last two years, Carnival's passenger cruise days averaged 1,189% year-on-year growth. Because this number is higher than its revenue growth during the same period, we can see the company's monetization has fallen.
This quarter, Carnival's year-on-year revenue growth of 22% was excellent, and its $5.41 billion of revenue was in line with Wall Street's estimates. Looking ahead, Wall Street expects sales to grow 10.5% over the next 12 months, a deceleration from this quarter.
Operating Margin
Operating margin is a key measure of profitability. Think of it as net income–the bottom line–excluding the impact of taxes and interest on debt, which are less connected to business fundamentals.
Although Carnival was profitable this quarter from an operational perspective, it's generally struggled when zooming out. Its high expenses have contributed to an average operating margin of negative 1.7% over the last two years. This performance isn't ideal as demand in the consumer discretionary sector is volatile. We prefer to invest in companies that can weather industry downturns through consistent profitability.
In Q1, Carnival generated an operating profit margin of 5.1%, up 9 percentage points year on year.
Over the next 12 months, Wall Street expects Carnival to become more profitable. Analysts are expecting the company’s LTM operating margin of 10.7% to rise to 12.8%.
EPS
We track long-term historical earnings per share (EPS) growth for the same reason as long-term revenue growth. Compared to revenue, however, EPS highlights whether a company's growth was profitable.
Over the last five years, Carnival's EPS dropped 433%, translating into 39.8% annualized declines. Thankfully, Carnival has bucked its trend as of late, growing its EPS over the last three years. We'll see if the company's growth is sustainable.
In Q1, Carnival reported EPS at negative $0.14, up from negative $0.55 in the same quarter a year ago. This print beat analysts' estimates by 22.1%. Over the next 12 months, Wall Street expects Carnival to grow its earnings. Analysts are projecting its LTM EPS of $0.34 to climb by 212% to $1.05.
Cash Is King
Although earnings are undoubtedly valuable for assessing company performance, we believe cash is king because you can't use accounting profits to pay the bills.
Over the last two years, Carnival's demanding reinvestments to stay relevant with consumers have drained company resources. Its free cash flow margin has been among the worst in the consumer discretionary sector, averaging negative 4.8%.
Carnival burned through $370 million of cash in Q1, equivalent to a negative 6.8% margin, increasing its cash burn by 34.2% year on year.
Return on Invested Capital (ROIC)
EPS and free cash flow tell us whether a company was profitable while growing revenue. But was it capital-efficient? A company’s ROIC explains this by showing how much operating profit a company makes compared to how much money the business raised (debt and equity).
Carnival's five-year average return on invested capital was negative 12.5%, meaning management lost money while trying to expand the business. Its returns were among the worst in the consumer discretionary sector.
The trend in its ROIC, however, is often what surprises the market and drives the stock price. Unfortunately, Carnival's ROIC over the last five years averaged 3.8 percentage point decreases each year. In conjunction with its already low returns, these declines suggest the company's profitable business opportunities are few and far between.
Key Takeaways from Carnival's Q1 Results
While the key volume metric of passenger cruise days unfortunately missed, we were impressed that Carnival still beat analysts' revenue expectations this quarter. With operating margin outperformance, EPS also beat. Looking ahead, full year adjusted EBITDA guidance was in like with Wall Street Consensus estimates. Overall, we think this was a solid quarter. The stock is flat after reporting and currently trades at $17.1 per share.
Is Now The Time?
Carnival may have had a favorable quarter, but investors should also consider its valuation and business qualities when assessing the investment opportunity.
We cheer for all companies serving consumers, but in the case of Carnival, we'll be cheering from the sidelines. Its revenue growth has been uninspiring over the last five years, but at least growth is expected to increase in the short term. And while its projected EPS for the next year implies the company's fundamentals will improve, the downside is its declining EPS over the last five years makes it hard to trust. On top of that, its relatively low ROIC suggests it has historically struggled to find compelling business opportunities.
Carnival's price-to-earnings ratio based on the next 12 months is 16.3x. While the price is reasonable and there are some things to like about Carnival, we think there are better opportunities elsewhere in the market right now.
Wall Street analysts covering the company had a one-year price target of $27.50 per share right before these results (compared to the current share price of $17.10).
To get the best start with StockStory, check out our most recent stock picks, and then sign up for our earnings alerts by adding companies to your watchlist here. We typically have the quarterly earnings results analyzed within seconds of the data being released, and especially for companies reporting pre-market, this often gives investors the chance to react to the results before the market has fully absorbed the information.