
Online study and academic help platform Chegg (NYSE:CHGG) reported results in line with analysts' expectations in Q1 CY2024, with revenue down 7.1% year on year to $174.4 million. On the other hand, next quarter's revenue guidance of $160 million was less impressive, coming in 7.8% below analysts' estimates. It made a non-GAAP profit of $0.26 per share, down from its profit of $0.27 per share in the same quarter last year.
Chegg (CHGG) Q1 CY2024 Highlights:
- Revenue: $174.4 million vs analyst estimates of $174.1 million (small beat)
- EPS (non-GAAP): $0.26 vs analyst estimates of $0.25 (5.6% beat)
- Revenue Guidance for Q2 CY2024 is $160 million at the midpoint, below analyst estimates of $173.6 million
- Gross Margin (GAAP): 73.3%, in line with the same quarter last year
- Free Cash Flow of $25.3 million, down 51.1% from the previous quarter
- Services Subscribers: 4.7 million, down 400,000 year on year
- Market Capitalization: $721.1 million
Started as a physical textbook rental service, Chegg (NYSE:CHGG) is now a digital platform addressing student pain points by providing study and academic assistance.
Today, the textbook rental part of the business has been deemphasized, and Chegg Services is the key product. Chegg Services, which is a subscription offering, includes Chegg Study, Chegg Writing, and Chegg Math. Chegg Study allows students to ask questions digitally and receive explanations from subject matter experts. Chegg Writing offers plagiarism detection scans, expert writing feedback, and citation generation. Chegg Math provides step-by-step problem solving so students can get the right answers but also can understand the problem solving process. Tutoring and language learning are emerging areas of focus.
Chegg addresses the high cost of educational resources. Originally, the company offered textbook rentals because the cost of buying, especially for budget-conscious college students, could put a dent in the wallet. From there, the company added subscription services to digitize the business and generate recurring touch points with customers rather than just when textbooks are acquired. The more subjects Chegg adds, the more it becomes a one-stop academic shop.
One growing priority for Chegg is to follow students beyond their educations. The company has begun offering career services such as internship resources and interviewing guides. It has also expanded into financial literacy and other life skills.
Consumer Subscription
Consumers today expect goods and services to be hyper-personalized and on demand. Whether it be what music they listen to, what movie they watch, or even finding a date, online consumer businesses are expected to delight their customers with simple user interfaces that magically fulfill demand. Subscription models have further increased usage and stickiness of many online consumer services.
Competitors offering streaming entertainment platforms include Coursera (NYSE:COUR), Udemy (NASDAQ:UDMY), and private company Khan Academy.Sales Growth
Chegg's revenue growth over the last three years has been unimpressive, averaging 0.3% annually. This quarter, Chegg reported a year on year revenue decline of 7.1%, in line with analysts' estimates.
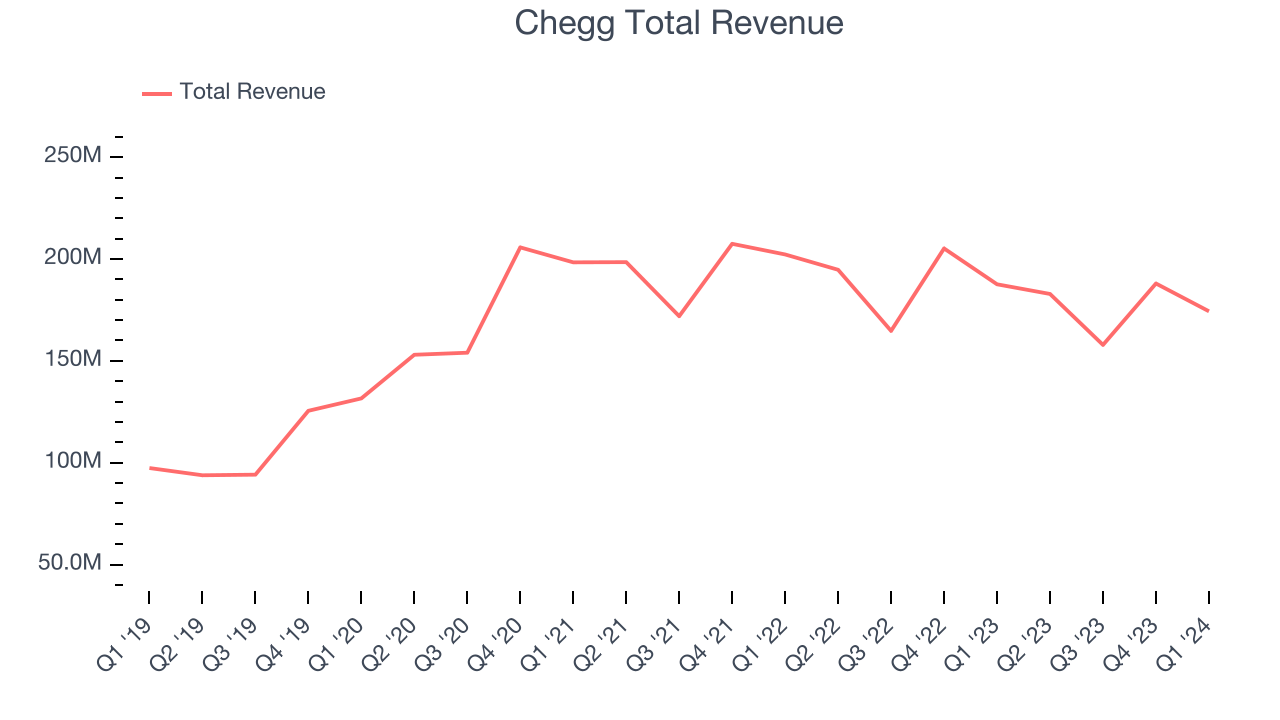
Chegg is expecting next quarter's revenue to decline 12.5% year on year to $160 million, a further deceleration from the 6.1% year-on-year decrease it recorded in the comparable quarter last year. Before the earnings results were announced, analysts were projecting revenue to decline -1.9% over the next 12 months.
Usage Growth
As a subscription-based app, Chegg generates revenue growth by expanding both its subscriber base and the amount each subscriber spends over time.
Chegg has been struggling to grow its users, a key performance metric for the company. Over the last two years, its users have declined 1.7% annually to 4.7 million. This is one of the lowest rates of growth in the consumer internet sector.
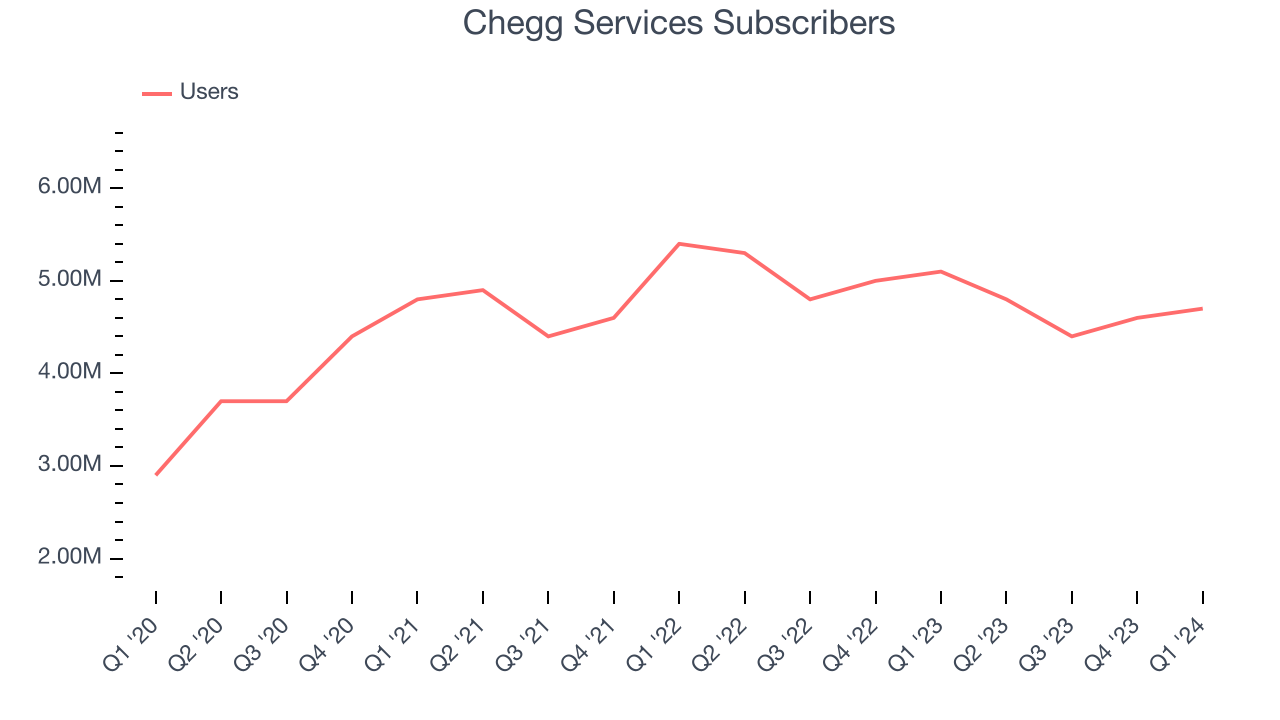
In Q1, Chegg's users decreased by 400,000, a 7.8% drop since last year.
Revenue Per User
Average revenue per user (ARPU) is a critical metric to track for consumer internet businesses like Chegg because it measures how much the average user spends. ARPU is also a key indicator of how valuable its users are (and can be over time).
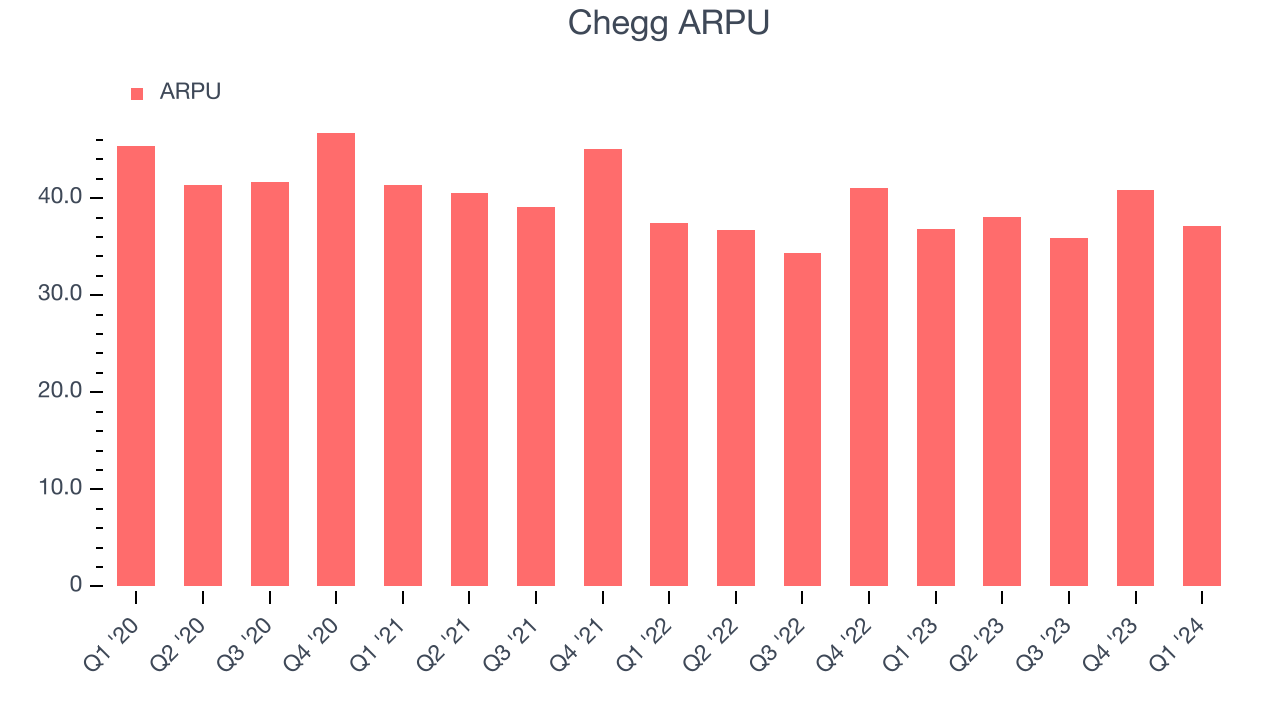
Chegg's ARPU has declined over the last two years, averaging 3%. On top of that, its users have also shrunk, indicating that the business is encountering some serious problems. This quarter, ARPU grew 0.8% year on year to $37.10 per user.
Pricing Power
A company's gross profit margin has a major impact on its ability to exert pricing power, develop new products, and invest in marketing. These factors may ultimately determine the winner in a competitive market, making it a critical metric to track for the long-term investor.
Chegg's gross profit margin, which tells us how much money the company gets to keep after covering the base cost of its products and services, came in at 73.3% this quarter, down 0.5 percentage points year on year.
For internet subscription businesses like Chegg, these aforementioned costs typically include customer service, data center and infrastructure expenses, and royalties and other content-related costs if the company's offering includes features such as video or music services. After paying for these expenses, Chegg had $0.73 for every $1 in revenue to invest in marketing, talent, and the development of new products and services.
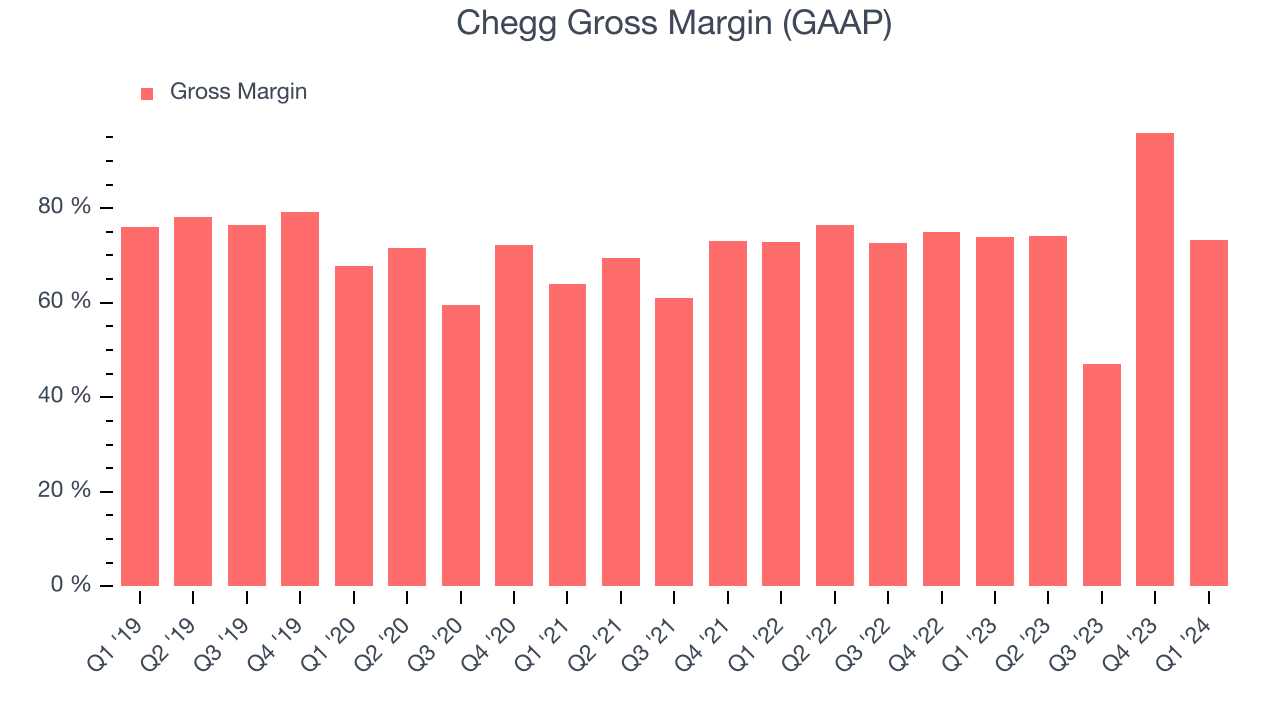
Despite declining over the last 12 months, Chegg still retains strong gross margins, averaging 73.7%. These robust unit economics, driven by the company's attractive business model and strong pricing power, are higher than most consumer internet peers and allow Chegg to make more investments in product and marketing.
User Acquisition Efficiency
Consumer internet businesses like Chegg grow from a combination of product virality, paid advertisement, and incentives (unlike enterprise software products, which are often sold by dedicated sales teams).
Chegg is very efficient at acquiring new users, spending only 25.3% of its gross profit on sales and marketing expenses over the last year. This efficiency indicates that it has a strong brand reputation and customer acquisition advantages from scale, giving Chegg the freedom to invest its resources into new growth initiatives while maintaining optionality.
Profitability & Free Cash Flow
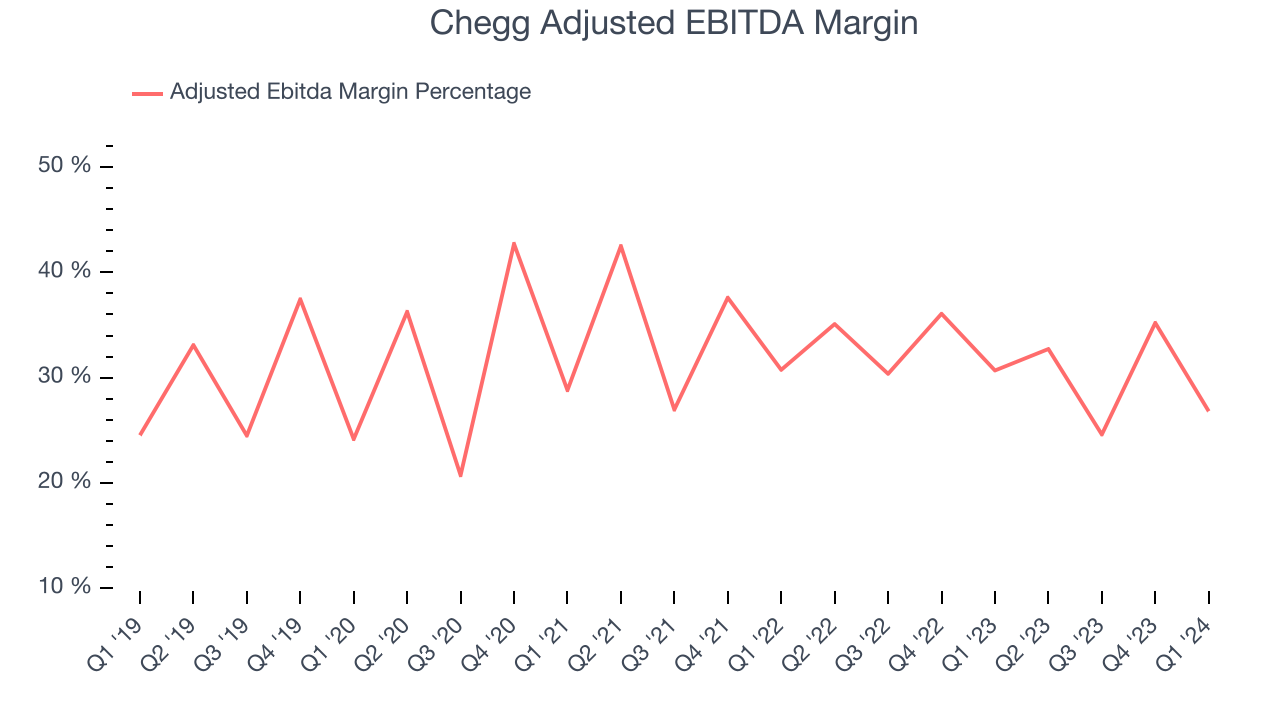
Investors frequently analyze operating income to understand a business's core profitability. Similar to operating income, adjusted EBITDA is the most common profitability metric for consumer internet companies because it removes various one-time or non-cash expenses, offering a more normalized view of a company's profit potential.
Chegg reported EBITDA of $46.74 million this quarter, resulting in a 26.8% margin. Additionally, Chegg has demonstrated extremely high profitability over the last four quarters, with average EBITDA margins of 30.1%.
If you've followed StockStory for a while, you know that we emphasize free cash flow. Why, you ask? We believe that in the end, cash is king, and you can't use accounting profits to pay the bills. Chegg's free cash flow came in at $25.3 million in Q1, down 54.8% year on year.
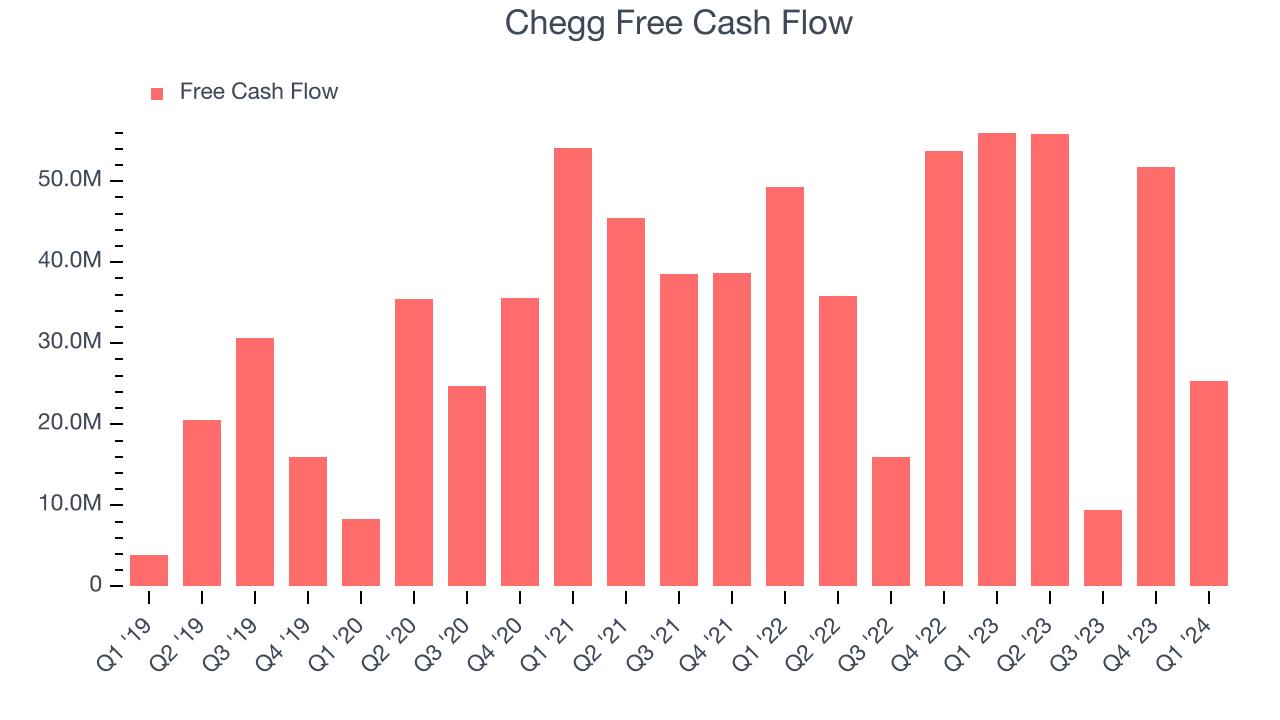
Chegg has generated $142.2 million in free cash flow over the last 12 months, an eye-popping 20.2% of revenue. This robust FCF margin stems from its asset-lite business model, scale advantages, and strong competitive positioning, giving it the option to return capital to shareholders or reinvest in its business while maintaining a healthy cash balance.
Balance Sheet Risk
Debt is a tool that can boost company returns but presents risks if used irresponsibly.
Chegg reported $390.8 million of cash and $616.8 million of debt on its balance sheet in the most recent quarter. As investors in high-quality companies, we primarily focus on two things: 1) that a company's debt level isn't too high and 2) that its interest payments are not excessively burdening the business.
With $211.6 million of EBITDA over the last 12 months, we view Chegg's 1.1x net-debt-to-EBITDA ratio as safe. We also see its $22.99 million of annual interest expenses as appropriate. The company's profits give it plenty of breathing room, allowing it to continue investing in new initiatives.
Key Takeaways from Chegg's Q1 Results
We struggled to find many strong positives in these results. Its revenue and subscribers were in line with expectations while its EPS and EBITDA slightly beat. More importantly, next quarter's revenue and EPS missed analysts' estimates, driving the stock lower. The weak guidance was triggered by a worse-than-expected outlook for its subscription revenue, which has higher margins than its other revenue streams. Overall, this was a mediocre quarter for Chegg. The company is down 6.5% on the results and currently trades at $6.71 per share.
Is Now The Time?
Chegg may have had a bad quarter, but investors should also consider its valuation and business qualities when assessing the investment opportunity.
We cheer for everyone who's making the lives of others easier through technology, but in the case of Chegg, we'll be cheering from the sidelines. Its revenue growth has been weak over the last three years, and analysts expect growth to deteriorate from here. And while its powerful free cash flow generation enables it to stay ahead of the competition through consistent reinvestment of profits, the downside is its users have declined. On top of that, its ARPU has declined over the last two years.
At the moment, Chegg trades at 3.7x next 12 months EV-to-EBITDA. While there are some things to like about Chegg and its valuation is reasonable, we think there are better opportunities elsewhere in the market right now.
Wall Street analysts covering the company had a one-year price target of $8.98 per share right before these results (compared to the current share price of $6.71).
To get the best start with StockStory check out our most recent Stock picks, and then sign up to our earnings alerts by adding companies to your watchlist here. We typically have the quarterly earnings results analyzed within seconds of the data being released, and especially for the companies reporting pre-market, this often gives investors the chance to react to the results before the market has fully absorbed the information.