
Children’s apparel manufacturer Carter’s (NYSE:CRI) reported Q1 CY2024 results topping analysts' expectations, with revenue down 4.9% year on year to $661.5 million. On the other hand, next quarter's revenue guidance of $565 million was less impressive, coming in 7.8% below analysts' estimates. It made a non-GAAP profit of $1.04 per share, improving from its profit of $0.98 per share in the same quarter last year.
Is now the time to buy Carter's? Find out by accessing our full research report, it's free.
Carter's (CRI) Q1 CY2024 Highlights:
- Revenue: $661.5 million vs analyst estimates of $640.4 million (3.3% beat)
- EPS (non-GAAP): $1.04 vs analyst estimates of $0.77 (34.8% beat)
- Revenue Guidance for Q2 CY2024 is $565 million at the midpoint, below analyst estimates of $613 million
- EPS (non-GAAP) Guidance for Q2 CY2024 is $0.40 at the midpoint, below analyst estimates of $0.80
- The company dropped its revenue guidance for the full year from $3 billion to $2.98 billion at the midpoint, a 0.8% decrease
- Gross Margin (GAAP): 47.6%, up from 44.5% in the same quarter last year
- Free Cash Flow was -$37.57 million, down from $306 million in the previous quarter
- Same-Store Sales were down 6.8% year on year (slight beat)
- Market Capitalization: $2.62 billion
“We exceeded our sales and earnings objectives in the first quarter,” said Michael D. Casey, Chairman and Chief Executive Officer.
Rumored to sell more than 10 products for every child born in the United States, Carter's (NYSE:CRI) is an American designer and marketer of children's apparel.
Apparel, Accessories and Luxury Goods
Within apparel and accessories, not only do styles change more frequently today than decades past as fads travel through social media and the internet but consumers are also shifting the way they buy their goods, favoring omnichannel and e-commerce experiences. Some apparel, accessories, and luxury goods companies have made concerted efforts to adapt while those who are slower to move may fall behind.
Sales Growth
Examining a company's long-term performance can provide clues about its business quality. Any business can put up a good quarter or two, but the best consistently grow over the long haul. Carter's revenue declined over the last five years, dropping 3.3% annually. 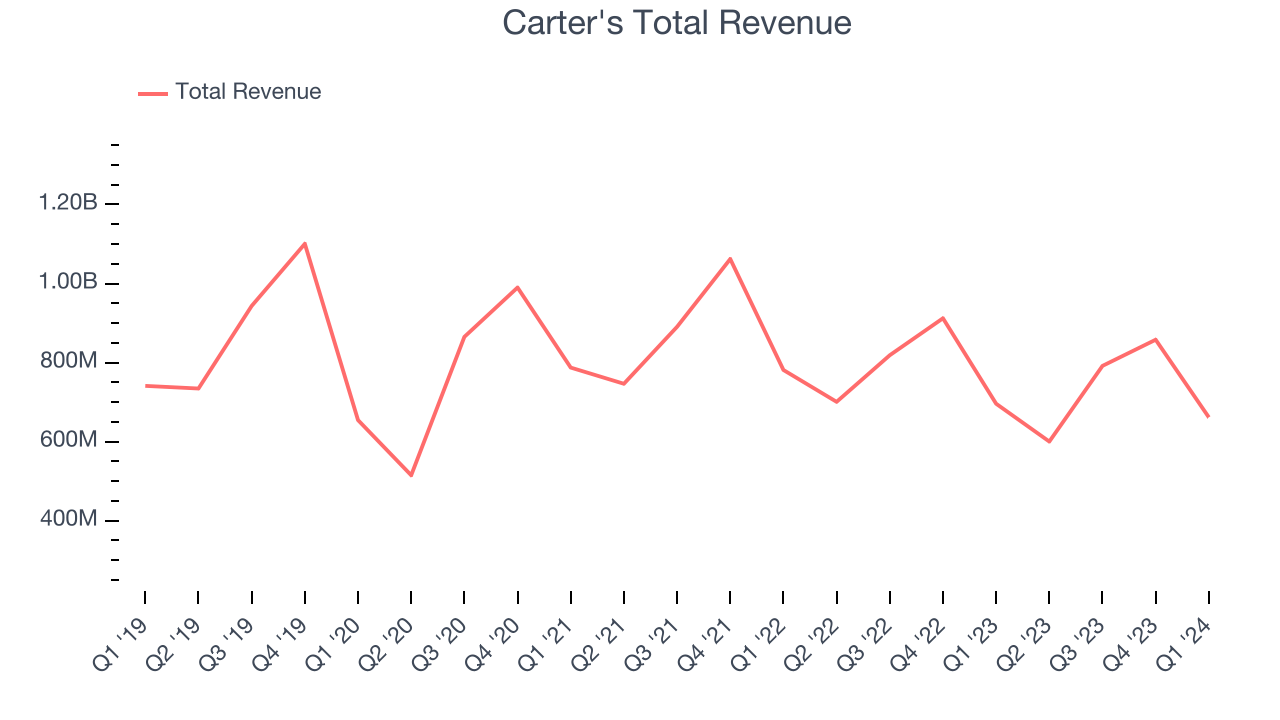 Within consumer discretionary, a long-term historical view may miss a company riding a successful new product or emerging trend. That's why we also follow short-term performance. Carter's recent history shows its demand has decreased even further as its revenue has shown annualized declines of 8.5% over the last two years.
We can dig even further into the company's revenue dynamics by analyzing its same-store sales, which show how much revenue its established locations generate. Over the last two years, Carter's same-store sales averaged 11% year-on-year declines. Because this number is lower than its revenue growth, we can see the opening of new locations is boosting the company's top-line performance. 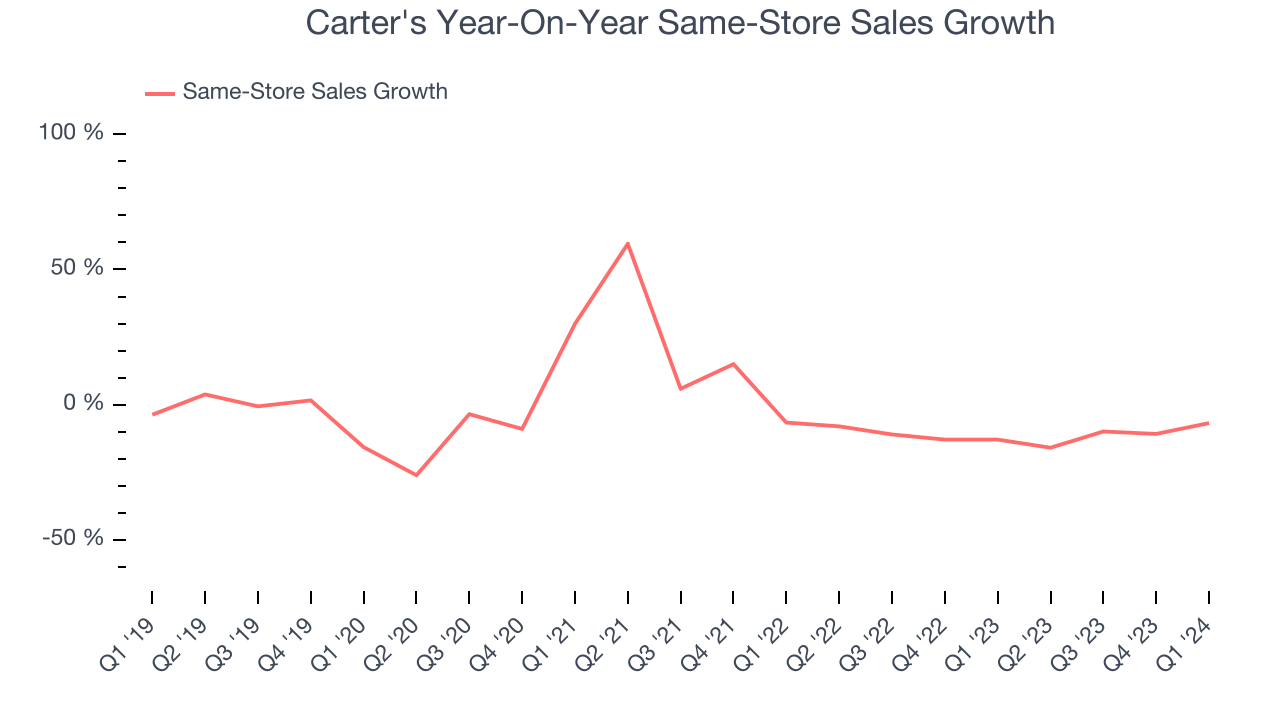
This quarter, Carter's revenue fell 4.9% year on year to $661.5 million but beat Wall Street's estimates by 3.3%. The company is guiding for a 5.9% year-on-year revenue decline next quarter to $565 million, an improvement from the 14.3% year-on-year decrease it recorded in the same quarter last year. Looking ahead, Wall Street expects sales to grow 2.2% over the next 12 months, an acceleration from this quarter.
Unless you’ve been living under a rock, it should be obvious by now that generative AI is going to have a huge impact on how large corporations do business. While Nvidia and AMD are trading close to all-time highs, we prefer a lesser-known (but still profitable) semiconductor stock benefitting from the rise of AI. Click here to access our free report on our favorite semiconductor growth story.
Cash Is King
Although earnings are undoubtedly valuable for assessing company performance, we believe cash is king because you can't use accounting profits to pay the bills.
Over the last two years, Carter's has shown decent cash profitability, giving it some reinvestment opportunities. The company's free cash flow margin has averaged 10.8%, slightly better than the broader consumer discretionary sector.
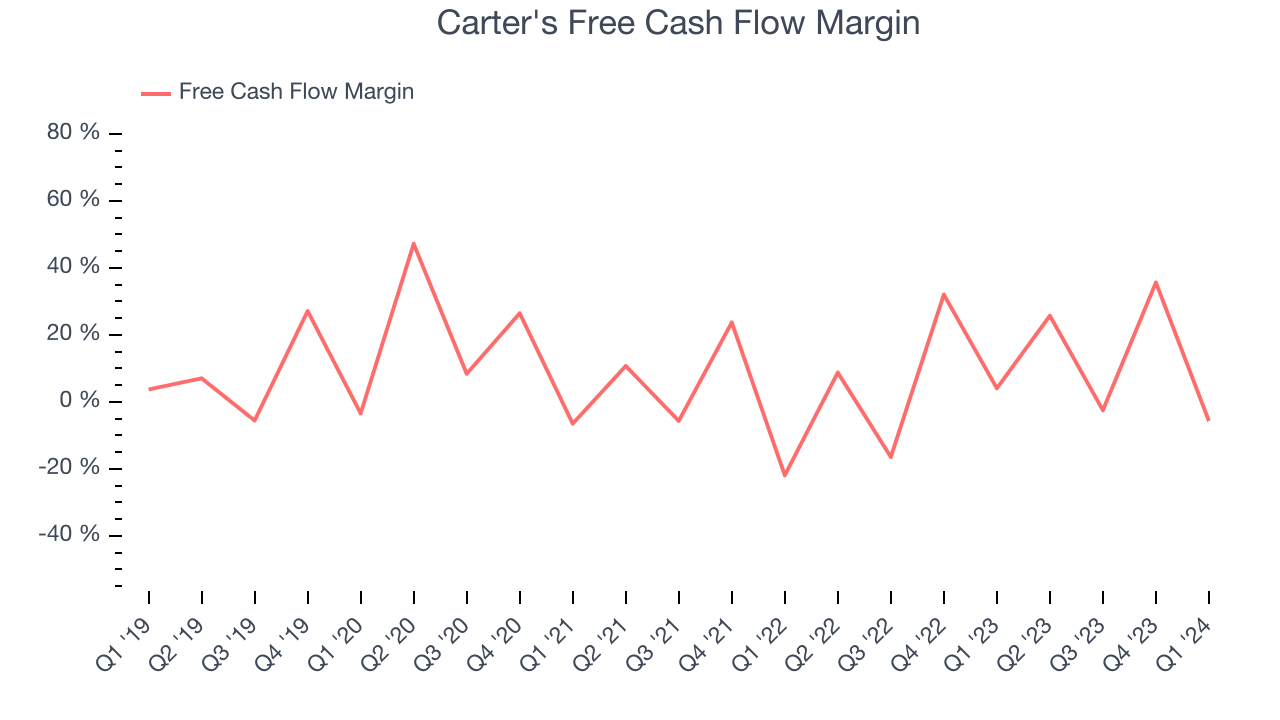
Carter's burned through $37.57 million of cash in Q1, equivalent to a negative 5.7% margin. This caught our eye as the company shifted from cash flow positive in the same quarter last year to cash flow negative this quarter.
Key Takeaways from Carter's Q1 Results
Carter's quarter seemed solid with revenue, gross margin, and EPS ahead of expectations. However, both its revenue and earnings forecast for next quarter fell short of Wall Street's estimates. The company also lowered its full year guidance for revenue and EPS. The guidance is clearly weighing on the stock, and shares are down 2.2% after reporting, trading at $70 per share.
So should you invest in Carter's right now? When making that decision, it's important to consider its valuation, business qualities, as well as what has happened in the latest quarter. We cover that in our actionable full research report which you can read here, it's free.