
Children’s apparel manufacturer Carter’s (NYSE:CRI) reported Q1 CY2024 results beating Wall Street analysts' expectations, with revenue down 4.9% year on year to $661.5 million. On the other hand, next quarter's revenue guidance of $565 million was less impressive, coming in 7.8% below analysts' estimates. It made a non-GAAP profit of $1.04 per share, improving from its profit of $0.98 per share in the same quarter last year.
Carter's (CRI) Q1 CY2024 Highlights:
- Revenue: $661.5 million vs analyst estimates of $640.4 million (3.3% beat)
- EPS (non-GAAP): $1.04 vs analyst estimates of $0.77 (34.8% beat)
- Revenue Guidance for Q2 CY2024 is $565 million at the midpoint, below analyst estimates of $613 million
- EPS (non-GAAP) Guidance for Q2 CY2024 is $0.40 at the midpoint, below analyst estimates of $0.80
- The company dropped its revenue guidance for the full year from $3 billion to $2.98 billion at the midpoint, a 0.8% decrease
- Gross Margin (GAAP): 47.6%, up from 44.5% in the same quarter last year
- Free Cash Flow was -$37.57 million, down from $306 million in the previous quarter
- Same-Store Sales were down 6.8% year on year (slight beat)
- Market Capitalization: $2.62 billion
Rumored to sell more than 10 products for every child born in the United States, Carter's (NYSE:CRI) is an American designer and marketer of children's apparel.
The company's flagship brand, Carter's, caters to parents and caregivers seeking reliable children's clothes including bodysuits, pajamas, outerwear, and swimwear.
Since its founding in 1865, it has acquired two other brands to expand its offerings: OshKosh B'gosh (2005) and Skip Hop (2017). OshKosh B'gosh is a fashion-forward clothing brand focusing on denim products while Skip Hop provides lifestyle goods such as diaper bags, toys, baby gear, and home essentials.
Carter's sells its products through retail stores in the United States, Canada, and Mexico, as well as online and in department stores, national chains, specialty retailers, and distributors internationally. Its multi-channel approach reflects the company’s vision that parents should be able to access children’s clothing in the most convenient way possible.
Apparel, Accessories and Luxury Goods
Within apparel and accessories, not only do styles change more frequently today than decades past as fads travel through social media and the internet but consumers are also shifting the way they buy their goods, favoring omnichannel and e-commerce experiences. Some apparel, accessories, and luxury goods companies have made concerted efforts to adapt while those who are slower to move may fall behind.
Carter's primary competitors include The Children's Place (NASDAQ:PLCE), Gap (NYSE:GPS), Gymboree (owned by Hanesbrands NYSE:HBI), and Zara Kids (owned by Inditex BME:ITX).Sales Growth
A company's long-term performance can indicate its business quality. Any business can enjoy short-lived success, but best-in-class ones sustain growth over many years. Carter's revenue declined over the last five years, dropping 3.3% annually. 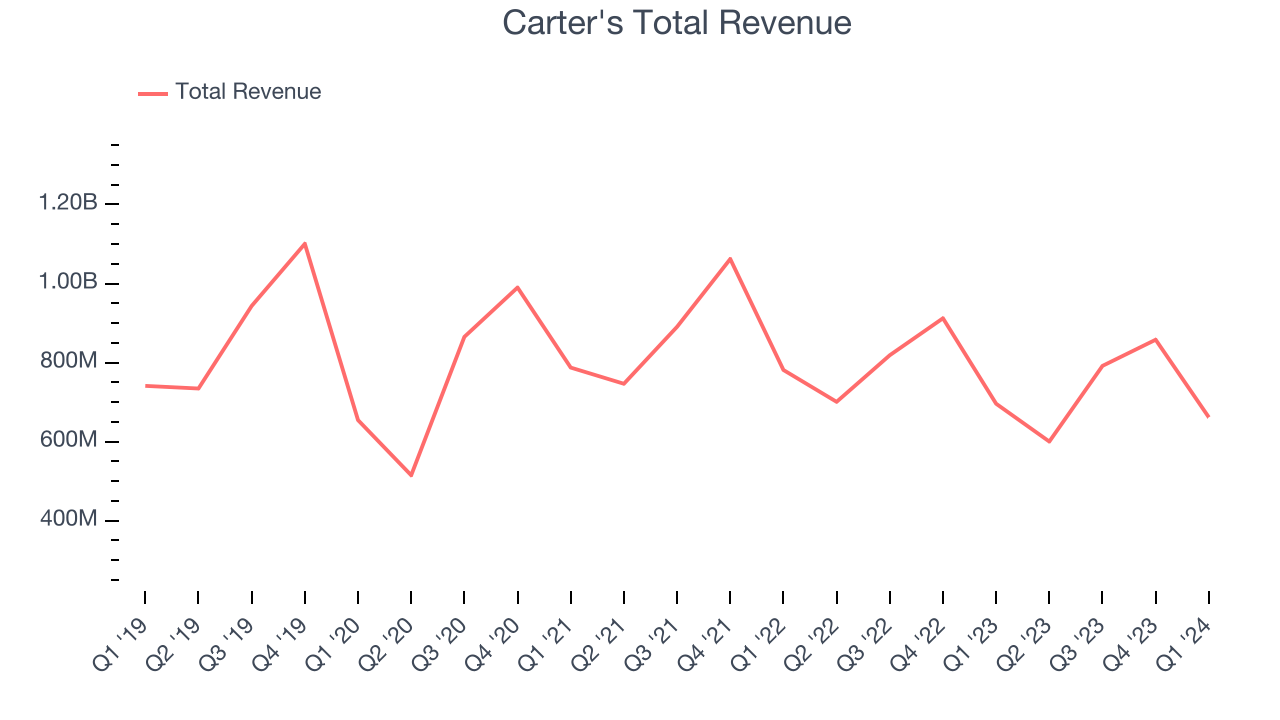 Within consumer discretionary, product cycles are short and revenue can be hit-driven due to rapidly changing trends. That's why we also follow short-term performance. Carter's recent history shows its demand has decreased even further as its revenue has shown annualized declines of 8.5% over the last two years.
We can better understand the company's revenue dynamics by analyzing its same-store sales, which show how much revenue its established locations generate. Over the last two years, Carter's same-store sales averaged 11% year-on-year declines. Because this number is lower than its revenue growth, we can see the opening of new locations is boosting the company's top-line performance. 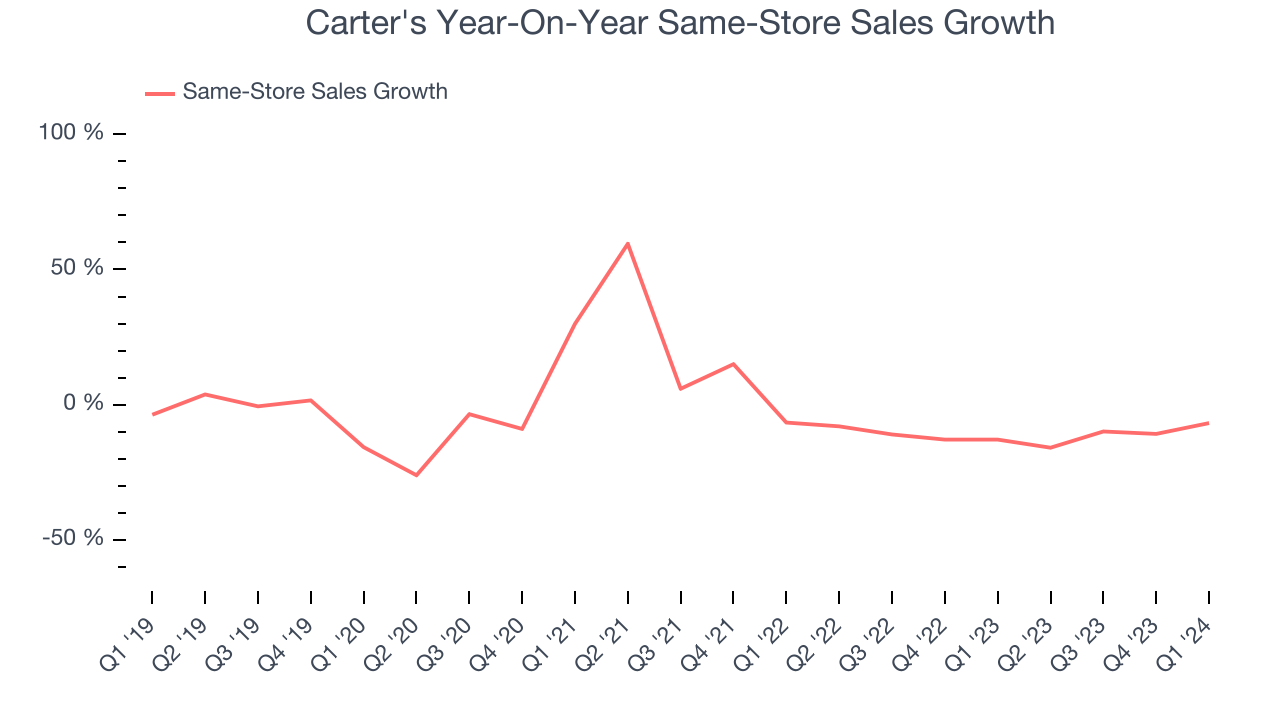
This quarter, Carter's revenue fell 4.9% year on year to $661.5 million but beat Wall Street's estimates by 3.3%. The company is guiding for a 5.9% year-on-year revenue decline next quarter to $565 million, an improvement from the 14.3% year-on-year decrease it recorded in the same quarter last year. Looking ahead, Wall Street expects sales to grow 2.2% over the next 12 months, an acceleration from this quarter.
Operating Margin
Operating margin is a key measure of profitability. Think of it as net income–the bottom line–excluding the impact of taxes and interest on debt, which are less connected to business fundamentals.
Carter's has done a decent job managing its expenses over the last eight quarters. The company has produced an average operating margin of 10.8%, higher than the broader consumer discretionary sector.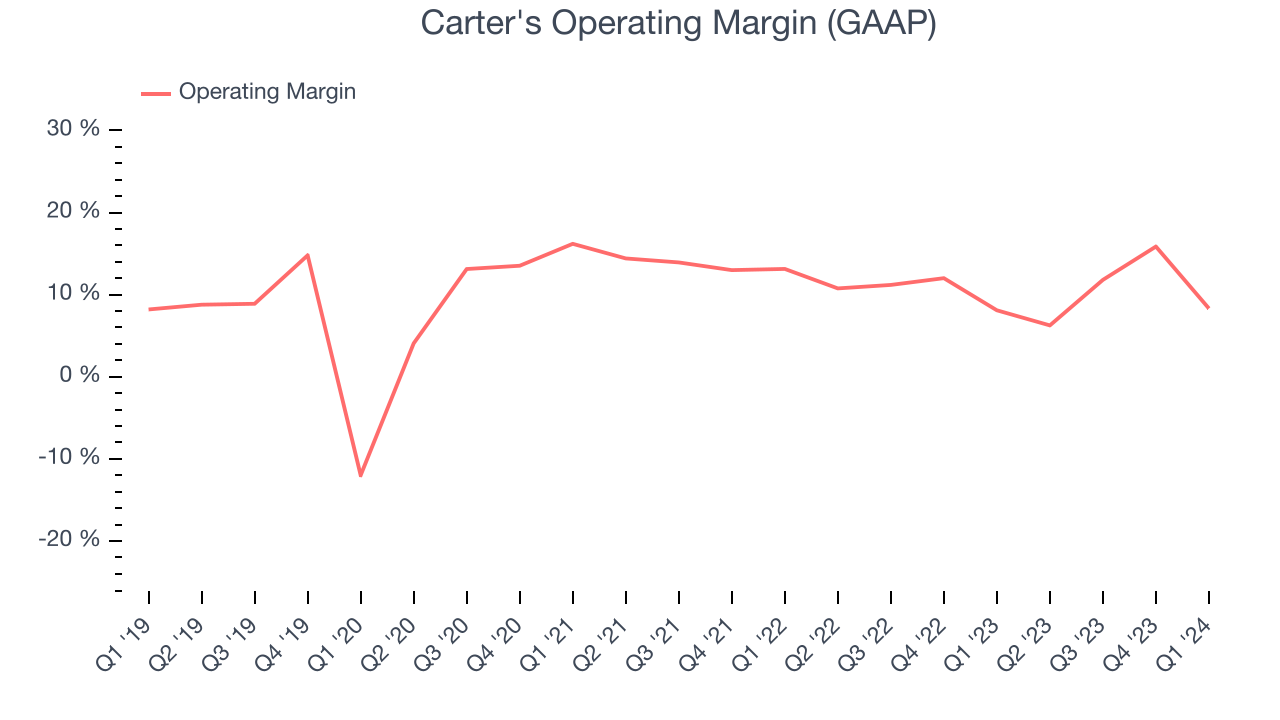
In Q1, Carter's generated an operating profit margin of 8.3%, in line with the same quarter last year. This indicates the company's costs have been relatively stable.
Over the next 12 months, Wall Street expects Carter's to maintain its LTM operating margin of 11.1%.EPS
We track long-term historical earnings per share (EPS) growth for the same reason as long-term revenue growth. Compared to revenue, however, EPS highlights whether a company's growth was profitable. 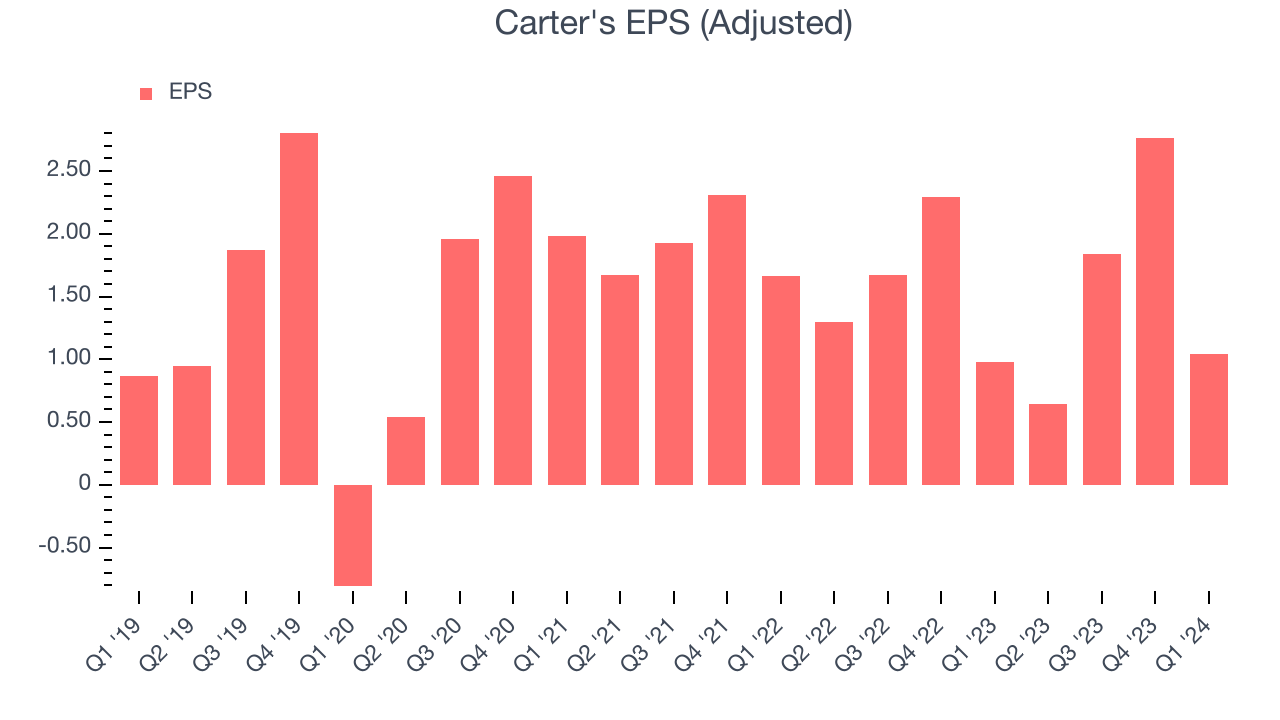
Over the last five years, Carter's EPS was flat. This performance, however, is materially higher than its 3.3% annualized revenue declines over the same period. There are a few reasons for this, and understanding why can shed light on its fundamentals.
A five-year view shows that Carter's has repurchased its stock, shrinking its share count by 21%. This has led to higher per share earnings. Taxes and interest expenses can also affect EPS growth, but they don't tell us as much about a company's fundamentals.In Q1, Carter's reported EPS at $1.04, up from $0.98 in the same quarter last year. This print beat analysts' estimates by 34.8%. Over the next 12 months, Wall Street expects Carter's to grow its earnings. Analysts are projecting its LTM EPS of $6.28 to climb by 1.1% to $6.35.
Cash Is King
If you've followed StockStory for a while, you know we emphasize free cash flow. Why, you ask? We believe that in the end, cash is king, and you can't use accounting profits to pay the bills.
Over the last two years, Carter's has shown decent cash profitability, giving it some reinvestment opportunities. The company's free cash flow margin has averaged 10.8%, slightly better than the broader consumer discretionary sector.
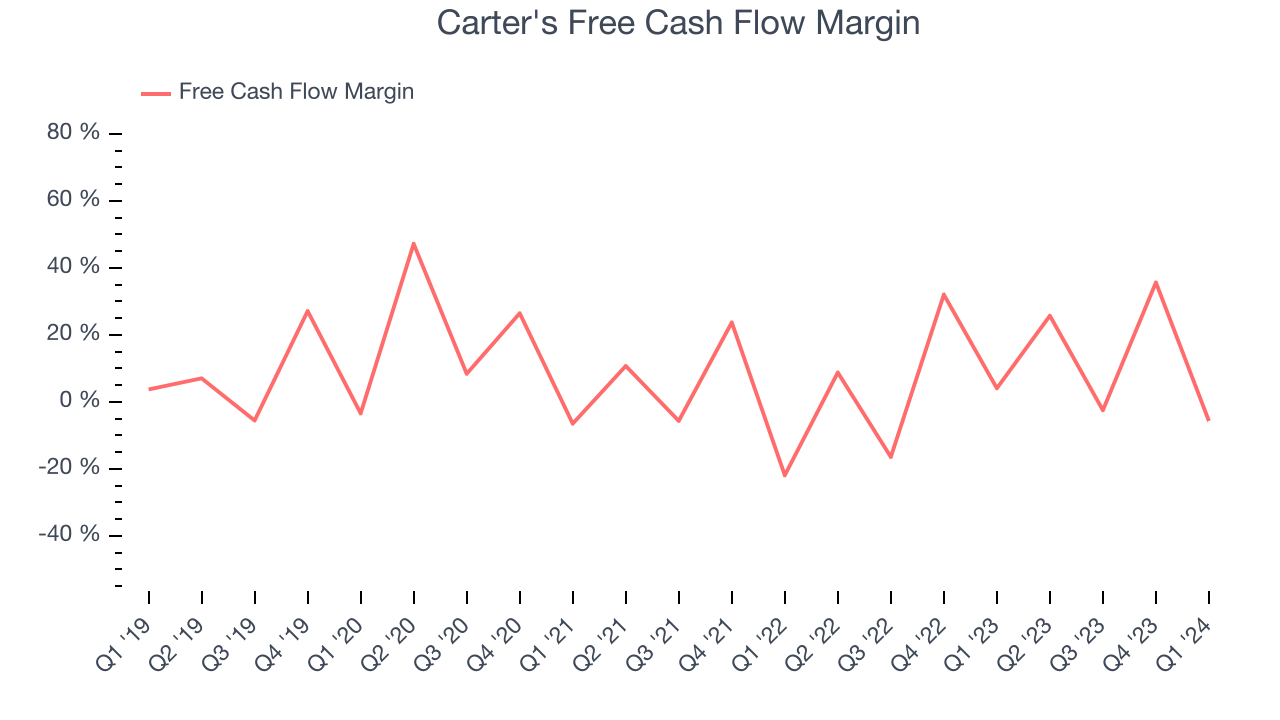
Carter's burned through $37.57 million of cash in Q1, equivalent to a negative 5.7% margin. This caught our eye as the company shifted from cash flow positive in the same quarter last year to cash flow negative this quarter.
Return on Invested Capital (ROIC)
EPS and free cash flow tell us whether a company was profitable while growing revenue. But was it capital-efficient? Enter ROIC, a metric showing how much operating profit a company generates relative to how much money the business raised (debt and equity).
Although Carter's hasn't been the highest-quality company lately because of its poor top-line performance, it historically did an excellent job investing in profitable business initiatives. Its five-year average return on invested capital was 22.5%, impressive for a consumer discretionary company.
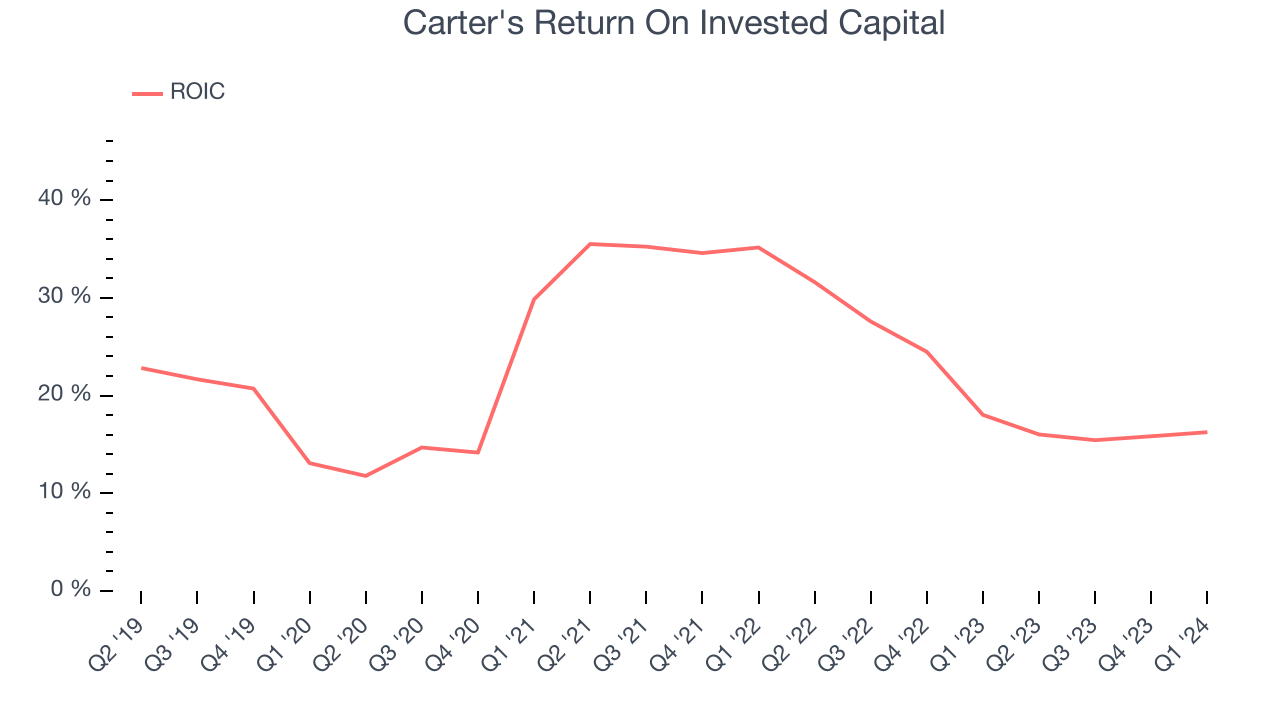
The trend in its ROIC, however, is often what surprises the market and drives the stock price. Unfortunately, Carter's ROIC averaged 4.3 percentage point decreases over the last few years. We like what management has done historically but are concerned its ROIC is declining, perhaps a symptom of waning business opportunities to invest profitably.
Balance Sheet Risk
Debt is a tool that can boost company returns but presents risks if used irresponsibly.
Carter's reported $267.6 million of cash and $1.08 billion of debt on its balance sheet in the most recent quarter. As investors in high-quality companies, we primarily focus on two things: 1) that a company's debt level isn't too high and 2) that its interest payments are not excessively burdening the business.
With $389.1 million of EBITDA over the last 12 months, we view Carter's 2.1x net-debt-to-EBITDA ratio as safe. We also see its $15.44 million of annual interest expenses as appropriate. The company's profits give it plenty of breathing room, allowing it to continue investing in new initiatives.
Key Takeaways from Carter's Q1 Results
Carter's quarter seemed solid with revenue, gross margin, and EPS ahead of expectations. However, both its revenue and earnings forecast for next quarter fell short of Wall Street's estimates. The company also lowered its full year guidance for revenue and EPS. The guidance is clearly weighing on the stock, and shares are down 2.2% after reporting, trading at $70 per share.
Is Now The Time?
Carter's may have had a favorable quarter, but investors should also consider its valuation and business qualities when assessing the investment opportunity.
We cheer for all companies serving consumers, but in the case of Carter's, we'll be cheering from the sidelines. Its revenue has declined over the last five years, but at least growth is expected to increase in the short term. And while its market-beating ROIC suggests it has been a well-managed company historically, the downside is its same-store sales performance has been disappointing. On top of that, its EPS growth over the last five years has been subpar.
Carter's price-to-earnings ratio based on the next 12 months is 11.3x. While there are some things to like about Carter's and its valuation is reasonable, we think there are better opportunities elsewhere in the market right now.
Wall Street analysts covering the company had a one-year price target of $74.16 per share right before these results (compared to the current share price of $70).
To get the best start with StockStory, check out our most recent stock picks, and then sign up for our earnings alerts by adding companies to your watchlist here. We typically have the quarterly earnings results analyzed within seconds of the data being released, and especially for companies reporting pre-market, this often gives investors the chance to react to the results before the market has fully absorbed the information.