
Discount retailer Dollar General (NYSE:DG) reported results in line with analysts' expectations in Q4 FY2023, with revenue down 3.4% year on year to $9.86 billion. It made a GAAP profit of $1.83 per share, down from its profit of $2.96 per share in the same quarter last year.
Dollar General (DG) Q4 FY2023 Highlights:
- Revenue: $9.86 billion vs analyst estimates of $9.78 billion (small beat)
- EPS: $1.83 vs analyst estimates of $1.73 (6.1% beat)
- Full year 2024 EPS guidance: $7.67 excluding impact of higher incentive compensation, above expectations of $7.50
- Gross Margin (GAAP): 29.5%, down from 30.9% in the same quarter last year
- Free Cash Flow of $490.1 million, up 92.9% from the same quarter last year
- Same-Store Sales were up 0.7% year on year (beat vs. expectations of down 1.1%)
- Store Locations: 19,986 at quarter end, increasing by 882 over the last 12 months
- Market Capitalization: $34.72 billion
Appealing to the budget-conscious consumer, Dollar General (NYSE:DG) is a discount retailer that sells a wide range of household essentials, groceries, apparel/beauty products, and seasonal merchandise.
Founded in 1939 and originally called J.L. Turner & Son, the company changed its name to Dollar General in 1968. The core Dollar general customer is typically a lower-income household in underserved rural or suburban areas. Perhaps that area is not served well by large regional grocery stores or general merchandise retailers such as Walmart, which is where Dollar General sees opportunity.
Dollar General tends to sell smaller unit quantities for those who cannot afford to buy in bulk and want to instead buy for immediate need. For example, you might not be able to buy a pack of one or two paper towel rolls at Kroger or Costco, but Dollar General has you covered here.
The Dollar General store is generally less than 10,000 square feet, much smaller than traditional grocery stores or general merchandise giants such as Walmart and Costco. These Dollar General stores feature easy-to-navigate layouts. Because of smaller store sizes, there is usually less selection within categories (only two ketchup brands, for example) and fewer store employees. Dollar General sells a combination of national brands as well as private label products, but again, the selection of brands is limited.
Discount Grocery Store
Traditional grocery stores are go-tos for many families, but discount grocers serve those who may not have a traditional grocery store nearby or who may have different spending thresholds. Certain rural or lower-income areas simply don’t have a grocery store. Additionally, some lower-income families would prefer to buy in smaller quantities than available at most stores (think one or two paper towel rolls at a time). While online competition threatens all of retail, grocery is one of the least penetrated because of the nature of buying food. Furthermore, those buying small quantities for immediate need are even less likely to leverage e-commerce for these purposes.
Competitors that sell general merchandise and/or groceries to US consumers include Walmart (NYSE:WMT), Costco (NYSE:COST), and Kroger (NYSE:KR).Sales Growth
Dollar General is one of the larger companies in the consumer retail industry and benefits from economies of scale, enabling it to gain more leverage on fixed costs and offer consumers lower prices.
As you can see below, the company's annualized revenue growth rate of 8.7% over the last four years (we compare to 2019 to normalize for COVID-19 impacts) was mediocre as it opened new stores and grew sales at existing, established stores.
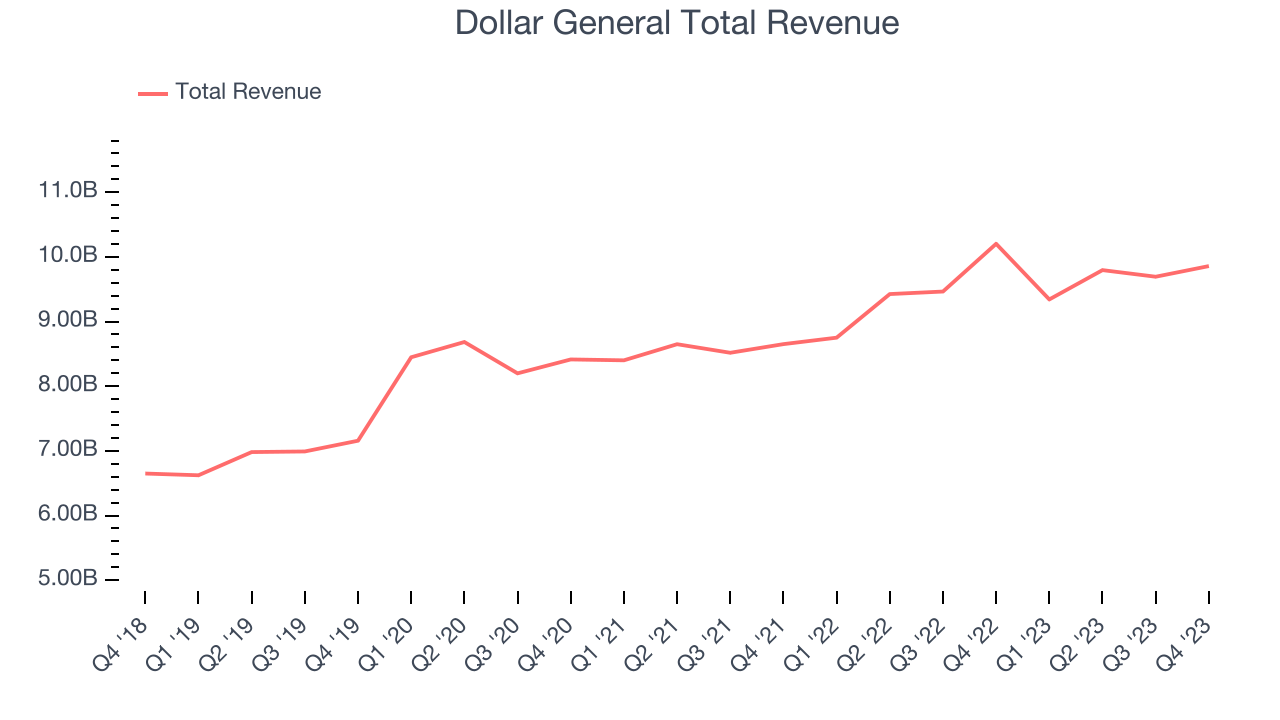
This quarter, Dollar General reported a rather uninspiring 3.4% year-on-year revenue decline to $9.86 billion in revenue, in line with Wall Street's estimates. Looking ahead, Wall Street expects sales to grow 4.4% over the next 12 months, an acceleration from this quarter.
Number of Stores
When a retailer like Dollar General is opening new stores, it usually means it's investing for growth because demand is greater than supply. Dollar General's store count increased by 882 locations, or 4.6%, over the last 12 months to 19,986 total retail locations in the most recently reported quarter.
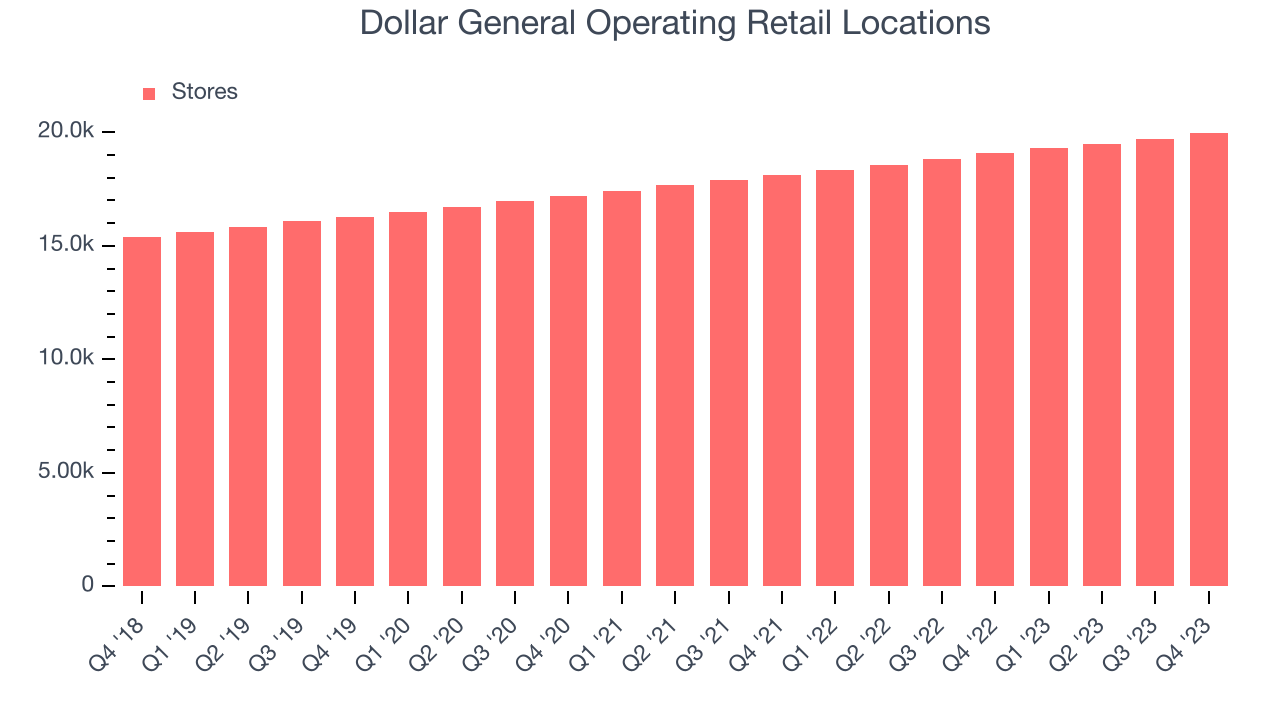
Over the last two years, the company has opened new stores quickly and averaged 5% annual growth in new locations, meaningfully higher than other consumer retail businesses. With an expanding store base and demand, revenue growth can come from multiple vectors: sales from new stores, sales from e-commerce, or increased foot traffic and higher sales per customer at existing stores.
Same-Store Sales
Same-store sales growth is a key performance indicator used to measure organic growth and demand for retailers.
Dollar General's demand within its existing stores has been relatively stable over the last eight quarters but fallen behind the broader consumer retail sector. On average, the company's same-store sales have grown by 2.2% year on year. With positive same-store sales growth amid an increasing physical footprint of stores, Dollar General is reaching more customers and growing sales.
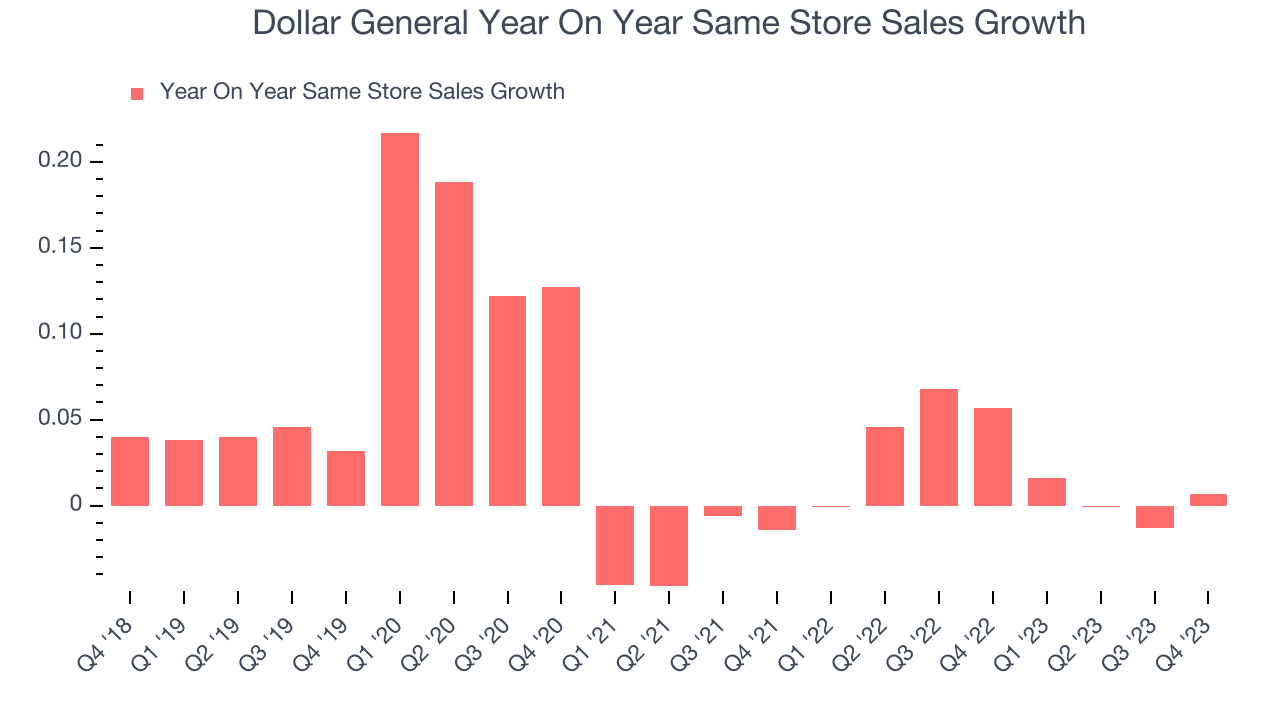
In the latest quarter, Dollar General's year on year same-store sales were flat. By the company's standards, this growth was a meaningful deceleration from the 5.7% year-on-year increase it posted 12 months ago. We'll be watching Dollar General closely to see if it can reaccelerate growth.
Gross Margin & Pricing Power
Dollar General has weak unit economics for a retailer, making it difficult to reinvest in the business. As you can see below, it's averaged a 30.8% gross margin over the last eight quarters. However, when comparing its margin specifically to other non-discretionary retailers, it's actually pretty solid. That's because non-discretionary retailers have structurally lower gross margins as they compete to provide the lowest possible price, sell products easily found elsewhere, and have high transportation costs to move their goods. We believe the best metrics to assess these types of companies are free cash flow margin, operating leverage, and profit volatility, which take their scale advantages and non-cyclical demand characteristics into account.
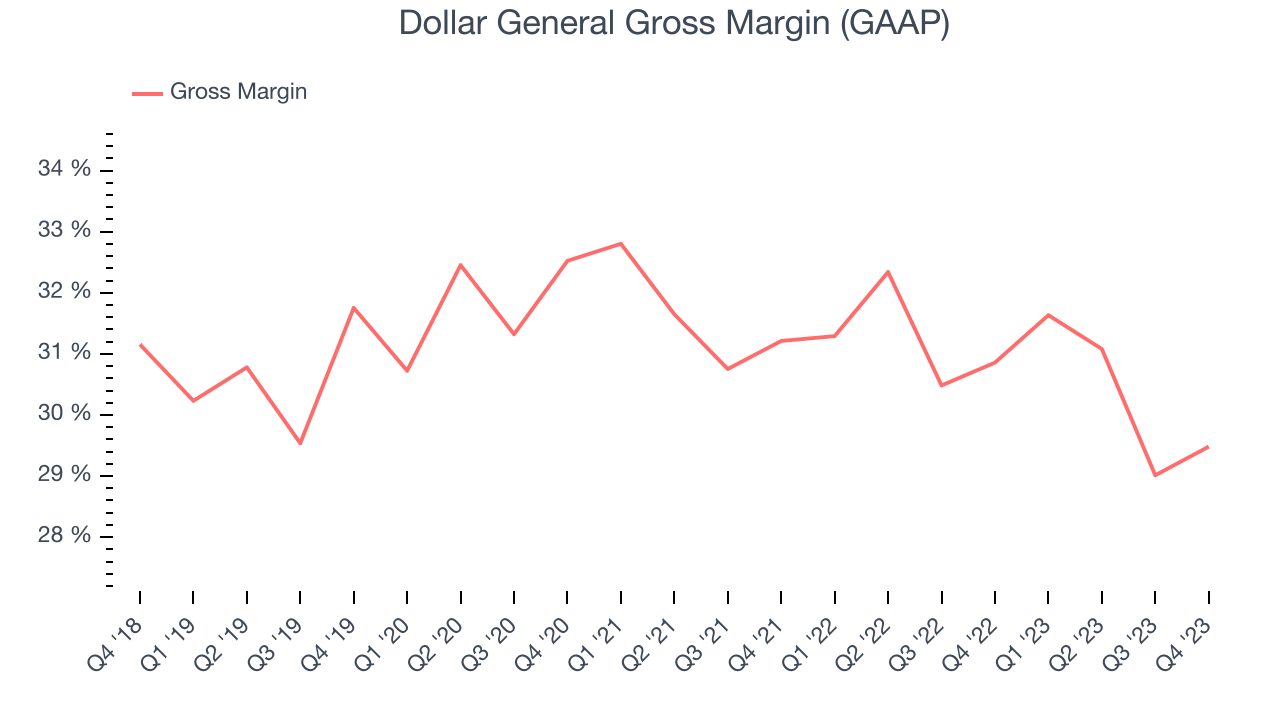
Dollar General produced a 29.5% gross profit margin in Q4, marking a 1.4 percentage point decrease from 30.9% in the same quarter last year. This drop raises an eyebrow for a retailer like Dollar General, which is structurally less profitable than the typical retail business for the reasons mentioned above, as it signals a more competitive environment with higher input costs (such as distribution expenses to move goods) and more pressure to discount products.
Operating Margin
Operating margin is a key profitability metric for retailers because it accounts for all expenses keeping the lights on, including wages, rent, advertising, and other administrative costs.
This quarter, Dollar General generated an operating profit margin of 5.9%, down 3.3 percentage points year on year. We can infer Dollar General was less efficient with its expenses or had lower leverage on its fixed costs because its operating margin decreased more than its gross margin.
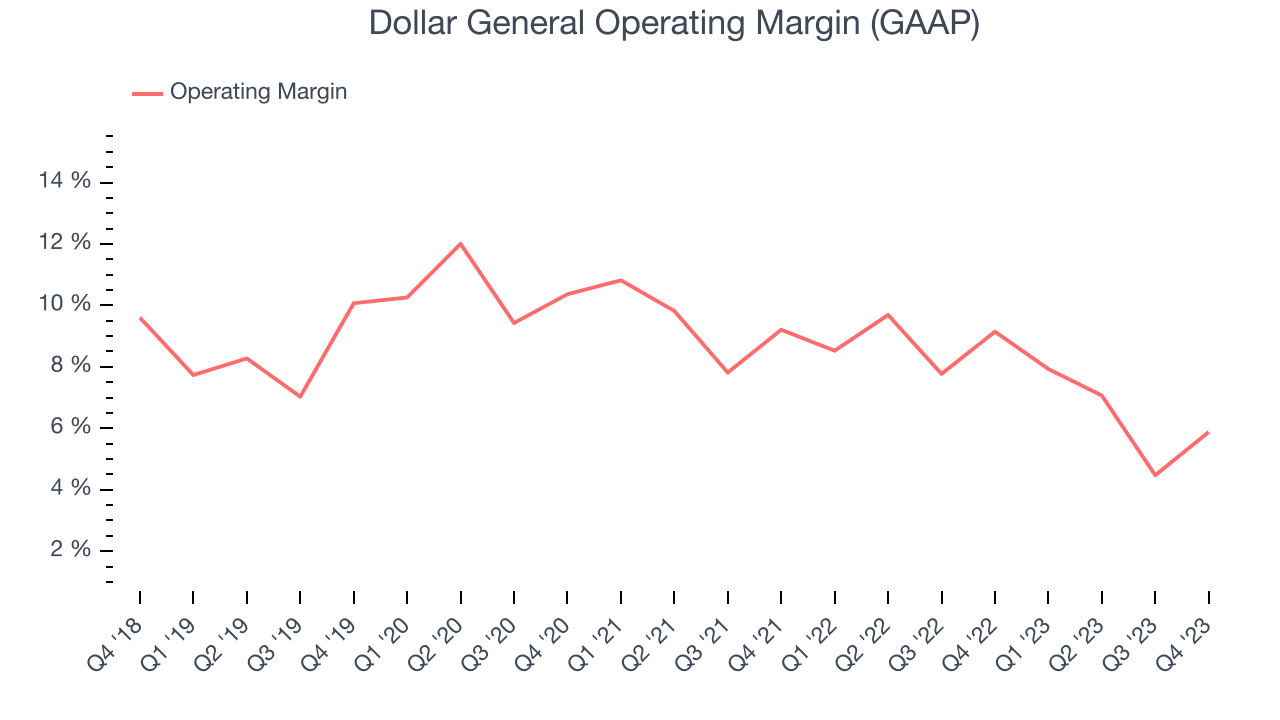 Zooming out, Dollar General was profitable over the last two years but held back by its large expense base. It's demonstrated mediocre profitability for a consumer retail business, producing an average operating margin of 7.5%. On top of that, Dollar General's margin has slightly declined, on average, by 2.5 percentage points year on year. This shows Dollar General has faced some speed bumps.
EPS
Earnings growth is a critical metric to track, but for long-term shareholders, earnings per share (EPS) is more telling because it accounts for dilution and share repurchases.
In Q4, Dollar General reported EPS at $1.83, down from $2.96 in the same quarter a year ago. This print beat Wall Street's estimates by 6.1%.
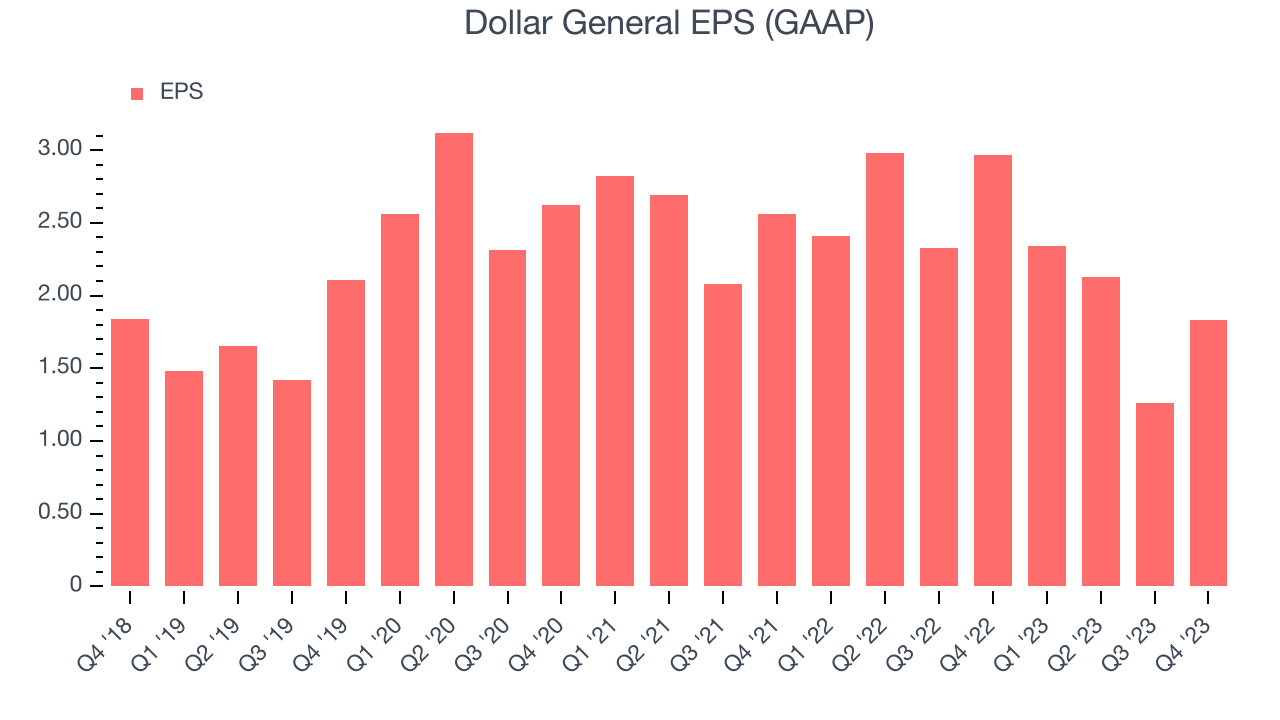
Between FY2019 and FY2023, Dollar General's adjusted diluted EPS grew 13.5%, translating into an unimpressive 3.2% compounded annual growth rate.
Over the next 12 months, however, Wall Street is projecting an average 1.5% year-on-year decline in EPS.
Cash Is King
Although earnings are undoubtedly valuable for assessing company performance, we believe cash is king because you can't use accounting profits to pay the bills.
Dollar General's free cash flow came in at $490.1 million in Q4, up 92.9% year on year. This result represents a 5% margin.
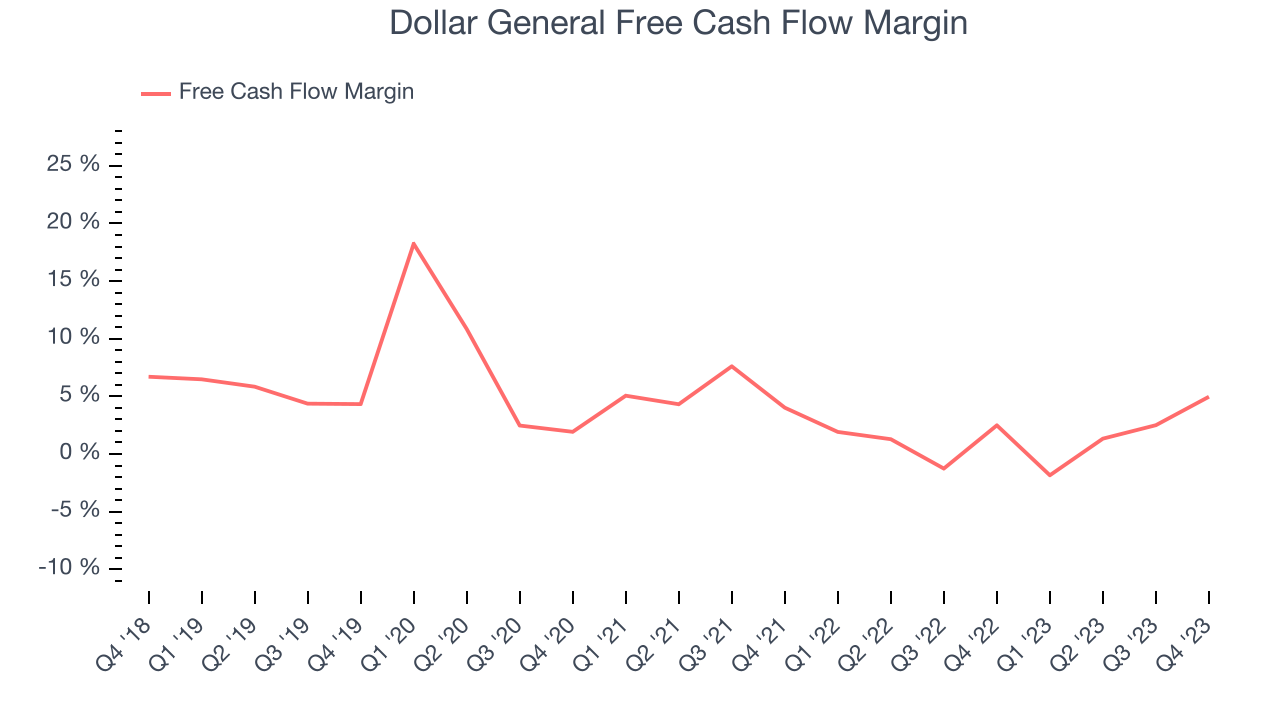
Over the last eight quarters, Dollar General has shown mediocre cash profitability, putting it in a pinch as it gives the company limited opportunities to reinvest, pay down debt, or return capital to shareholders. Its free cash flow margin has averaged 1.5%, subpar for a consumer retail business. Dollar General's margin has also been flat during that time, showing the company needs to take action and improve its cash profitability.
Key Takeaways from Dollar General's Q3 Results
With a market capitalization of $29.39 billion, a $365.4 million cash balance, and positive free cash flow over the last 12 months, we're confident that Dollar General has the resources needed to pursue a high-growth business strategy.
It was encouraging to see Dollar General slightly top analysts' same-store sales, revenue, and EPS expectations this quarter. On the other hand, its gross margin missed analysts' expectations. Guidance was also underwhelming, with the company lowering its sales growth and EPS outlooks, both of which came in below Consensus. Lastly, management commentary was positive, calling out "positive customer traffic, as well as market share gains in both dollars and units." Given the uncertain macro backdrop, management added that the Dollar General "model is relevant in all economic cycles". Overall, the results were mixed. The stock is flat after reporting and currently trades at $135 per share.
Return on Invested Capital (ROIC)
EPS and free cash flow tell us whether a company was profitable while growing revenue. But was it capital-efficient? A company’s ROIC explains this by showing how much operating profit a company makes compared to how much money the business raised (debt and equity).
Dollar General's five-year average ROIC was 12%, somewhat low compared to the best retail companies that consistently pump out 25%+. Its returns suggest it historically did a subpar job investing in profitable business initiatives.
The trend in its ROIC, however, is often what surprises the market and drives the stock price. Unfortunately, Dollar General's ROIC over the last two years averaged 3.1 percentage point decreases each year. In conjunction with its already low returns, these declines suggest the company's profitable business opportunities are few and far between.
Key Takeaways from Dollar General's Q4 Results
It was good to see Dollar General beat analysts' EPS expectations this quarter. We were also happy its revenue narrowly outperformed Wall Street's estimates on a same store sales beat. Another major positive was that its earnings forecast for the full year beat analysts' expectations (when excluding the impact of higher incentive compensation, which Wall Street likely wasn't modeling). Overall, this was a mixed quarter for Dollar General. The stock is up 5.2% after reporting and currently trades at $166.26 per share.
Is Now The Time?
Dollar General may have had a tough quarter, but investors should also consider its valuation and business qualities when assessing the investment opportunity.
We cheer for all companies serving consumers, but in the case of Dollar General, we'll be cheering from the sidelines. Its revenue growth has been mediocre over the last four years, and analysts expect growth to deteriorate from here. And while its popular brand makes consumers more likely to purchase its products, the downside is its poor same-store sales performance has been a headwind. On top of that, its gross margins make it more difficult to reach positive operating profits compared to other consumer retail businesses.
Dollar General's price-to-earnings ratio based on the next 12 months is 21.3x. While the price is reasonable and there are some things to like about Dollar General, we think there are better opportunities elsewhere in the market right now.
Wall Street analysts covering the company had a one-year price target of $144.60 per share right before these results (compared to the current share price of $166.26).
To get the best start with StockStory, check out our most recent stock picks, and then sign up to our earnings alerts by adding companies to your watchlist here. We typically have the quarterly earnings results analyzed within seconds of the data being released, and especially for companies reporting pre-market, this often gives investors the chance to react to the results before the market has fully absorbed the information.