Casual restaurant chain Dine Brands (NYSE:DIN) fell short of analysts' expectations in Q1 CY2024, with revenue down 3.5% year on year to $206.2 million. It made a non-GAAP profit of $1.33 per share, down from its profit of $1.97 per share in the same quarter last year.
Dine Brands (DIN) Q1 CY2024 Highlights:
- Revenue: $206.2 million vs analyst estimates of $210.5 million (2% miss)
- EPS (non-GAAP): $1.33 vs analyst expectations of $1.58 (15.7% miss)
- Full year guidance reiterated for Applebee's and IHOP same-store sales
- Gross Margin (GAAP): 47.2%, down from 48.9% in the same quarter last year
- Free Cash Flow of $29.74 million, down 36.2% from the previous quarter
- Same-Store Sales were down 4.6% year on year
- Store Locations: 3,445 at quarter end, decreasing by 18 over the last 12 months
- Market Capitalization: $673.4 million
Operating a franchise model, Dine Brands (NYSE:DIN) is a casual restaurant chain that owns the Applebee’s and IHOP banners.
The company was founded in 1958 with the launch of IHOP, which stands for International House of Pancakes. IHOP is known for breakfast fare such as eggs, pancakes, and waffles, all washed down with some coffee or juice. The locations resemble classic American diners, complete with cozy booths and counter seating.
Applebee’s was founded in 1980 and acquired by Dine Brands in 2007. Applebee's is known for its lively bar and grill atmosphere and offers a diverse range of hearty American dishes such as burgers, pasta, and steaks. Beer and alcohol are served, which often attracts sports fans to the bar for game days.
More recently in 2022, Dine Brands acquired its third banner, Fuzzy's Taco Shop. At the time of its acquisition, Fuzzy's was based in Fort Worth Texas and had 138 restaurants across 18 states.
Dine Brands serves the middle-income family and overall casual diner. At Applebee’s, IHOP, and Fuzzy's, you’ll find parents who want to eat out where there is a kids menu and where other guests will not mind a little bit of noise from the little ones. You’ll also find groups of friends catching up over drinks or burgers. In short, Dine Brands offers good food at prices that won’t break the bank in a place that is lively and not too stuffy or fancy.
Sit-Down Dining
Sit-down restaurants offer a complete dining experience with table service. These establishments span various cuisines and are renowned for their warm hospitality and welcoming ambiance, making them perfect for family gatherings, special occasions, or simply unwinding. Their extensive menus range from appetizers to indulgent desserts and wines and cocktails. This space is extremely fragmented and competition includes everything from publicly-traded companies owning multiple chains to single-location mom-and-pop restaurants.
Multi-brand full-service restaurant competitors include Darden (NYSE:DRI), Brinker International (NYSE:EAT), Bloomin’ Brands (NASDAQ:BLMN), and The Cheesecake Factory (NASDAQ:CAKE).Sales Growth
Dine Brands is a mid-sized restaurant chain, which sometimes brings disadvantages compared to larger competitors benefiting from better brand awareness and economies of scale. On the other hand, Dine Brands can still achieve high growth rates because its revenue base is not yet monstrous.
As you can see below, the company's revenue was flat over the last five years as it didn't open many new restaurants.
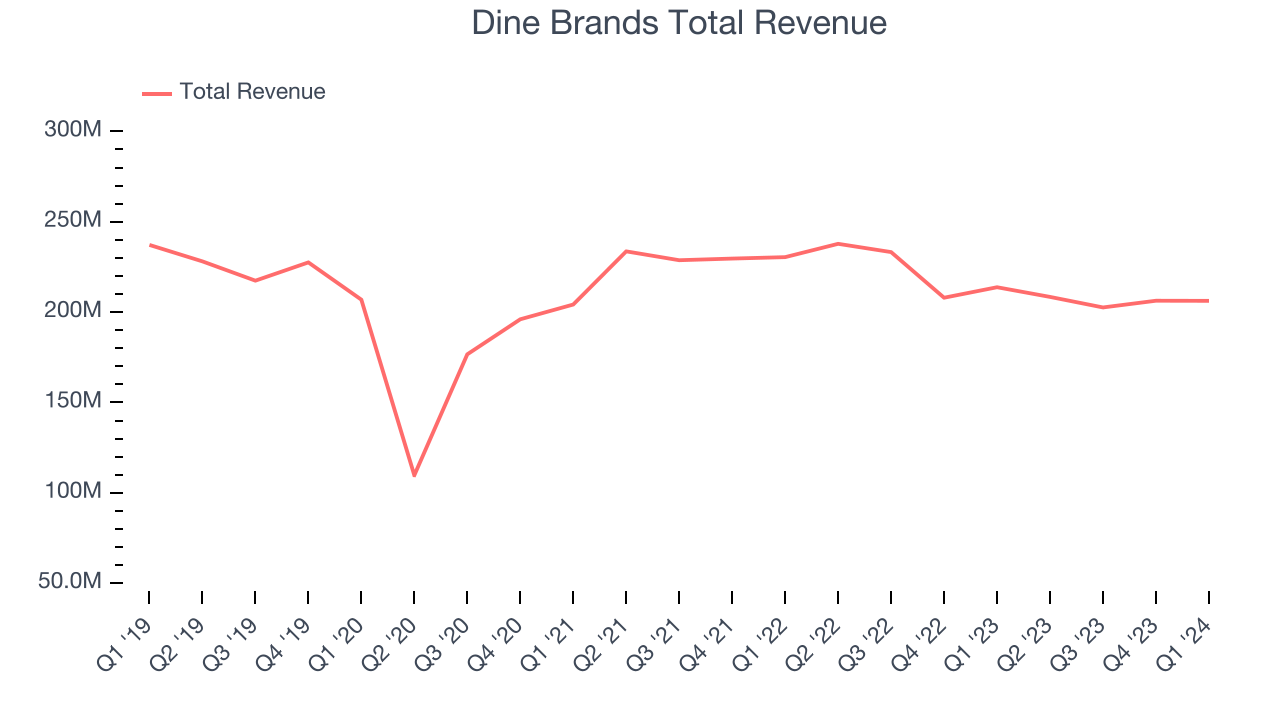
This quarter, Dine Brands missed Wall Street's estimates and reported a rather uninspiring 3.5% year-on-year revenue decline, generating $206.2 million in revenue. Looking ahead, Wall Street expects sales to grow 2.4% over the next 12 months, an acceleration from this quarter.
Same-Store Sales
Same-store sales growth is a key performance indicator used to measure organic growth and demand for restaurants.
Dine Brands's demand within its existing restaurants has been relatively stable over the last eight quarters but fallen behind the broader sector. On average, the company's same-store sales have grown by 1.3% year on year. Given its flat restaurant base over the same period, this performance stems from increased foot traffic or larger order sizes per customer at existing locations.
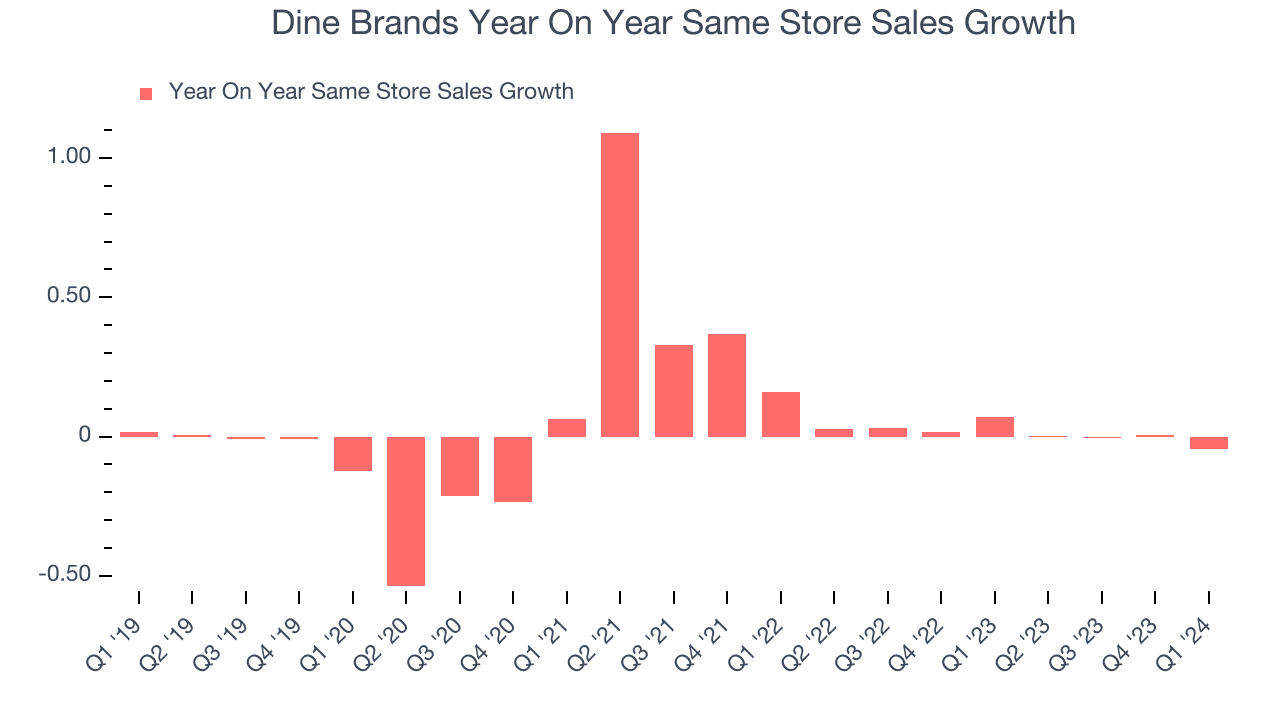
In the latest quarter, Dine Brands's same-store sales fell 4.6% year on year. This decline was a reversal from the 7.2% year-on-year increase it posted 12 months ago. We'll be keeping a close eye on the company to see if this turns into a longer-term trend.
Number of Stores
A restaurant chain's total number of dining locations is a crucial factor influencing how much it can sell and how quickly company-level sales can grow.
When a chain like Dine Brands doesn't open many new restaurants, it usually means there's stable demand for its meals and it's focused on improving operational efficiency to increase profitability. At the end of this quarter, Dine Brands operated 3,445 total locations, in line with its restaurant count 12 months ago.
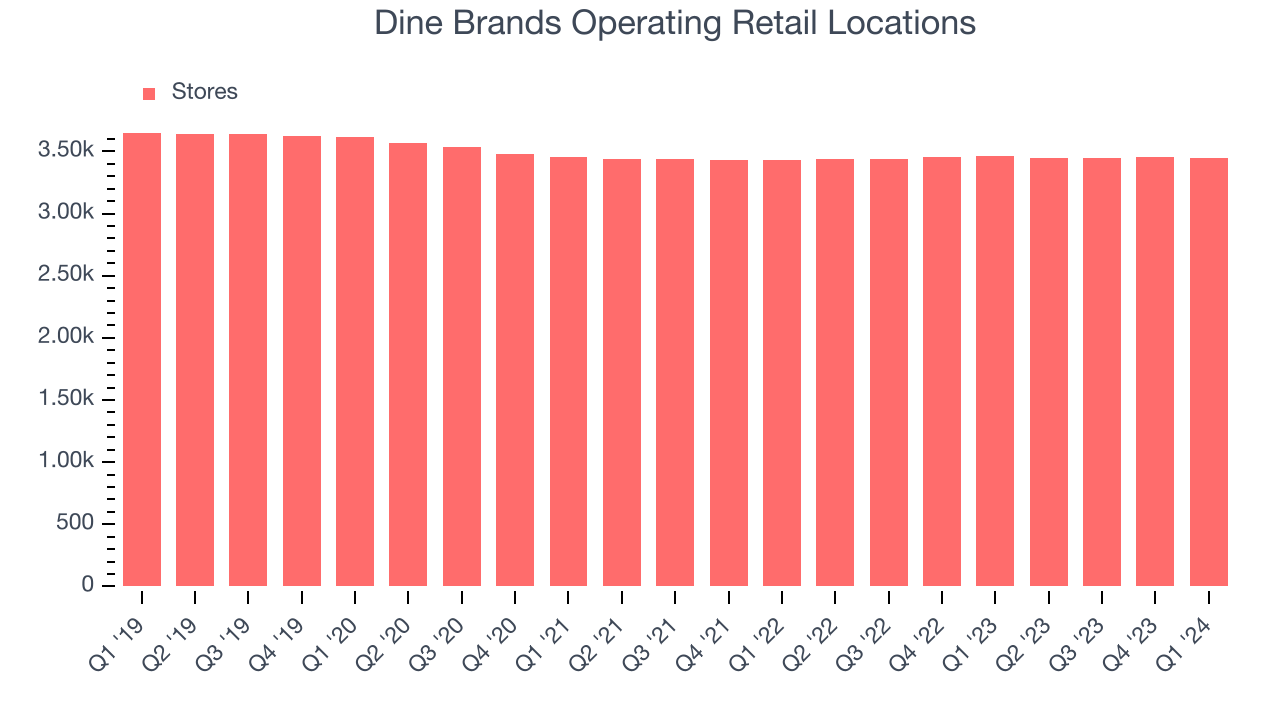
Taking a step back, Dine Brands has kept its locations more or less flat over the last two years compared to other restaurant businesses. A flat restaurant base means Dine Brands needs to boost foot traffic and turn tables faster at existing restaurants or raise prices to generate revenue growth.
Gross Margin & Pricing Power
Gross profit margins tell us how much money a restaurant gets to keep after paying for the direct costs of the meals it sells.
Dine Brands's gross profit margin came in at 47.2% this quarter. down 1.7 percentage points year on year. This means the company makes $0.46 for every $1 in revenue before accounting for its operating expenses.
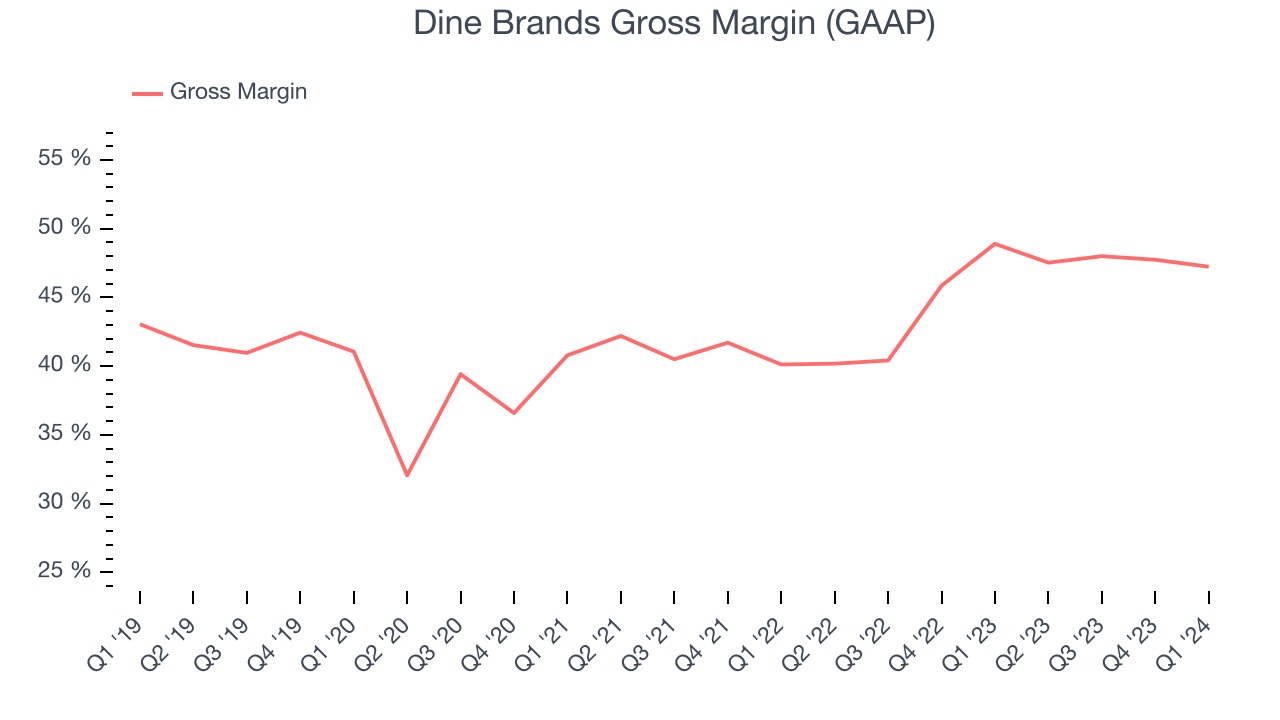
Dine Brands has best-in-class unit economics for a restaurant company, enabling it to invest in areas such as marketing and talent to stay one step ahead of the competition. As you can see above, it's averaged an exceptional 45.6% gross margin over the last two years. Its margin has also been trending up over the last 12 months, averaging 9.4% year-on-year increases each quarter. If this trend continues, it could suggest a less competitive environment where the company has better pricing power and more stable input costs (such as ingredients and transportation expenses).
Operating Margin
Operating margin is an important measure of profitability for restaurants as it accounts for all expenses keeping the lights on, including wages, rent, advertising, and other administrative costs.
In Q1, Dine Brands generated an operating profit margin of 25.3%, in line with the same quarter last year. This indicates the company's costs have been relatively stable.
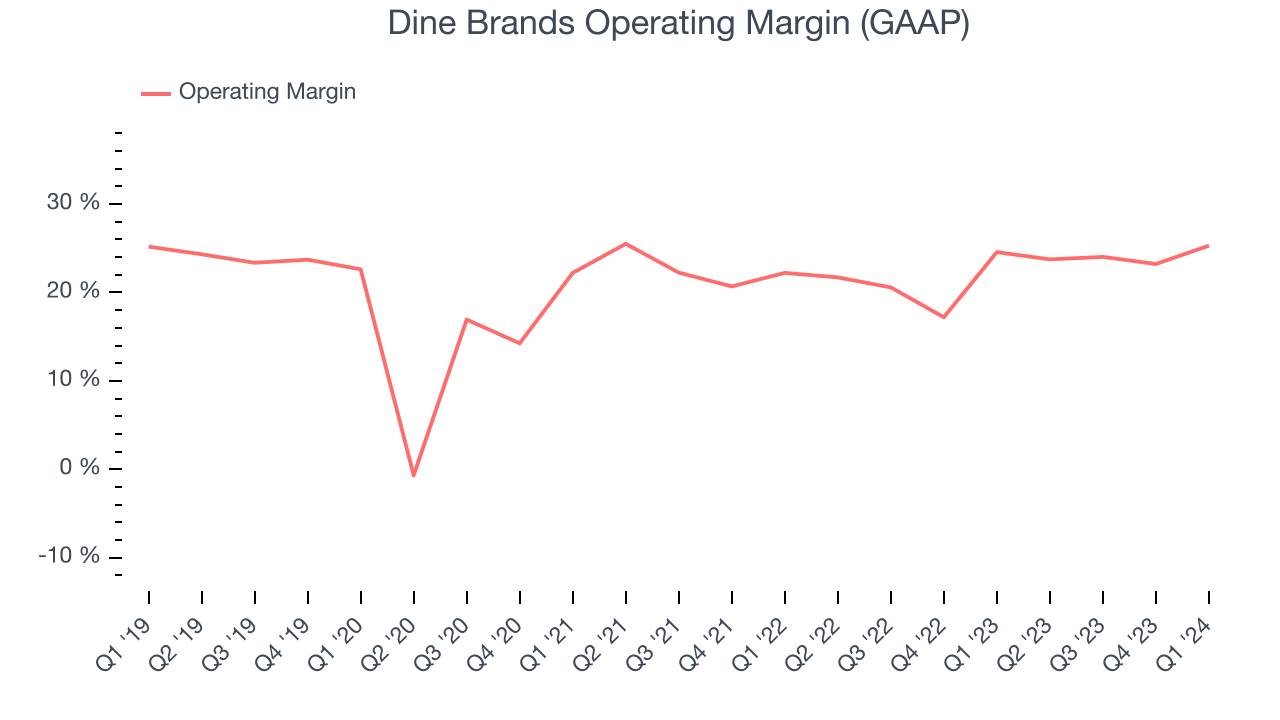 Zooming out, Dine Brands has been a well-managed company over the last two years. It's demonstrated elite profitability for a restaurant business, boasting an average operating margin of 22.5%. On top of that, its margin has improved, on average, by 3 percentage points each year, a great sign for shareholders.
 EPS
Earnings growth is a critical metric to track, but for long-term shareholders, earnings per share (EPS) is more telling because it accounts for dilution and share repurchases.
In Q1, Dine Brands reported EPS at $1.33, down from $1.97 in the same quarter a year ago. This print unfortunately missed Wall Street's estimates, but we care more about long-term EPS growth rather than short-term movements.
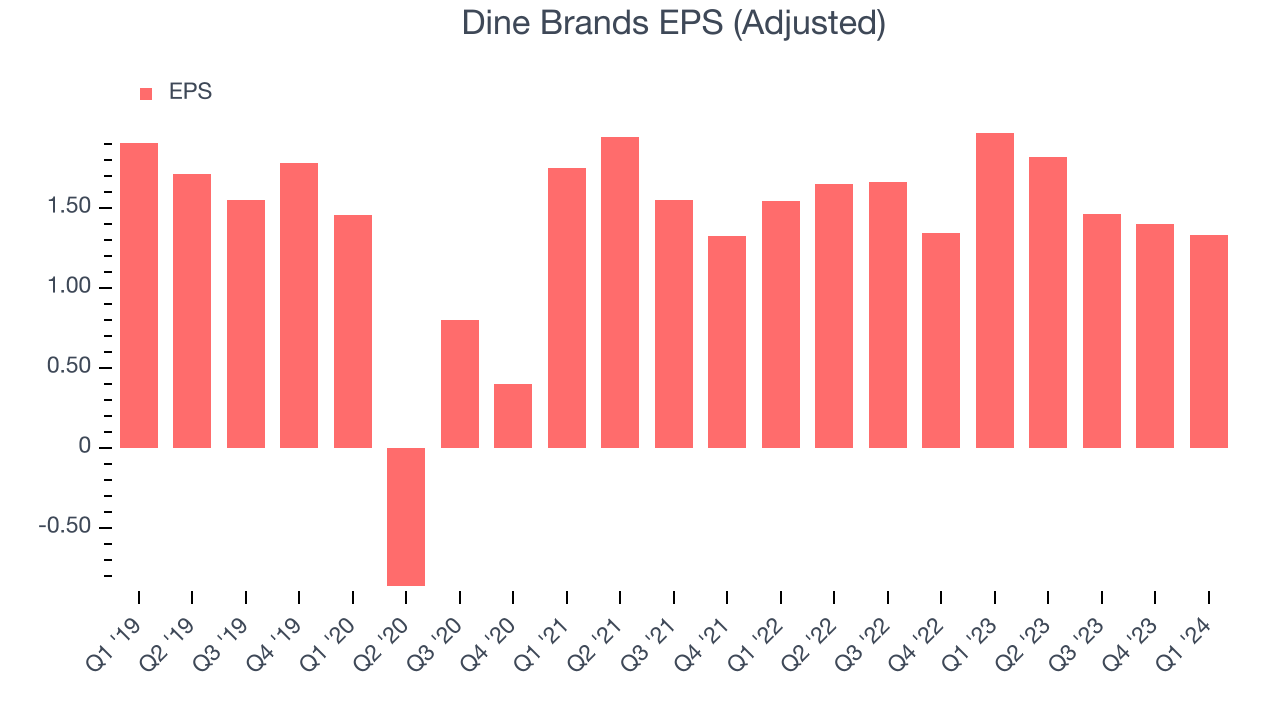
On the bright side, Wall Street expects the company's earnings to grow over the next 12 months, with analysts projecting an average 8.6% year-on-year increase in EPS.
Cash Is King
If you've followed StockStory for a while, you know that we emphasize free cash flow. Why, you ask? We believe that in the end, cash is king, and you can't use accounting profits to pay the bills.
Dine Brands's free cash flow came in at $29.74 million in Q1, up 64,559% year on year. This result represents a 14.4% margin.
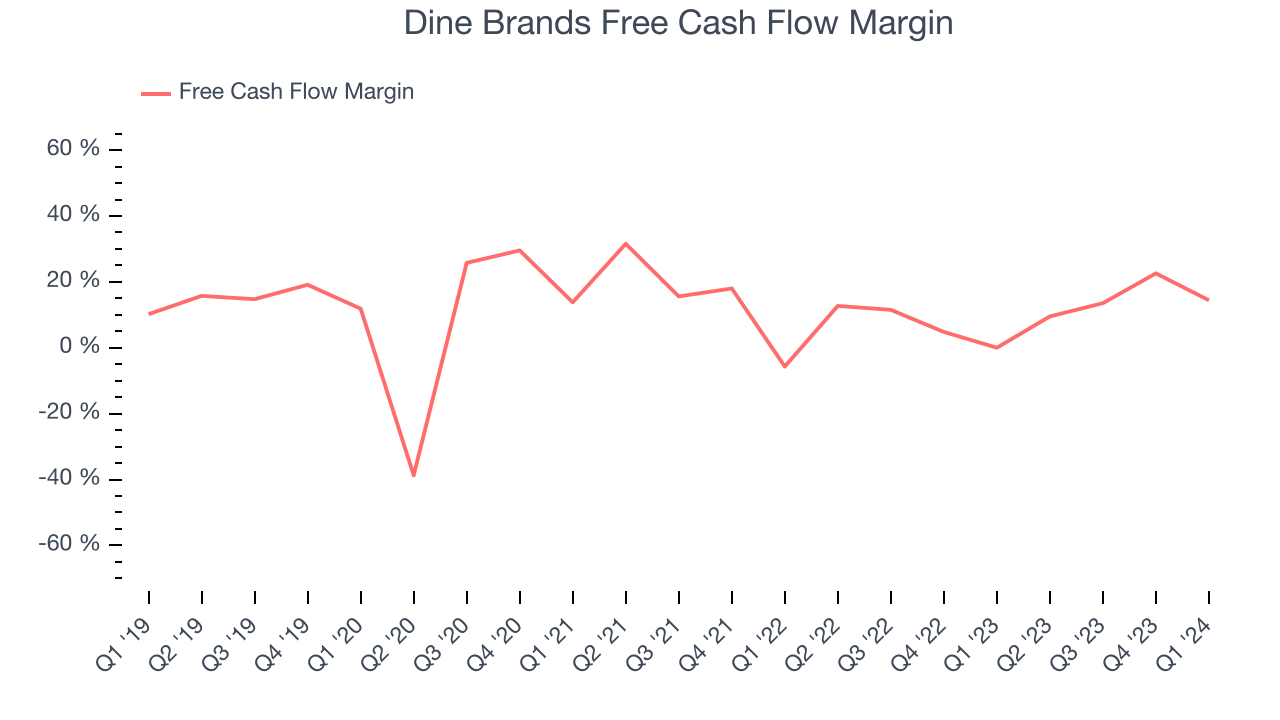
Over the last two years, Dine Brands has shown strong cash profitability, giving it an edge over its competitors and the option to reinvest or return capital to investors while keeping cash on hand for emergencies. The company's free cash flow margin has averaged 11.1%, quite impressive for a restaurant business. Furthermore, its margin has averaged year-on-year increases of 7.5 percentage points. This likely pleases the company's investors.
Return on Invested Capital (ROIC)
EPS and free cash flow tell us whether a company was profitable while growing revenue. But was it capital-efficient? A company’s ROIC explains this by showing how much operating profit a company makes compared to how much money the business raised (debt and equity).
Although Dine Brands hasn't been the highest-quality company lately because of its poor top-line performance, it historically did a wonderful job investing in profitable business initiatives. Its five-year average ROIC was 19%, splendid for a restaurant business.
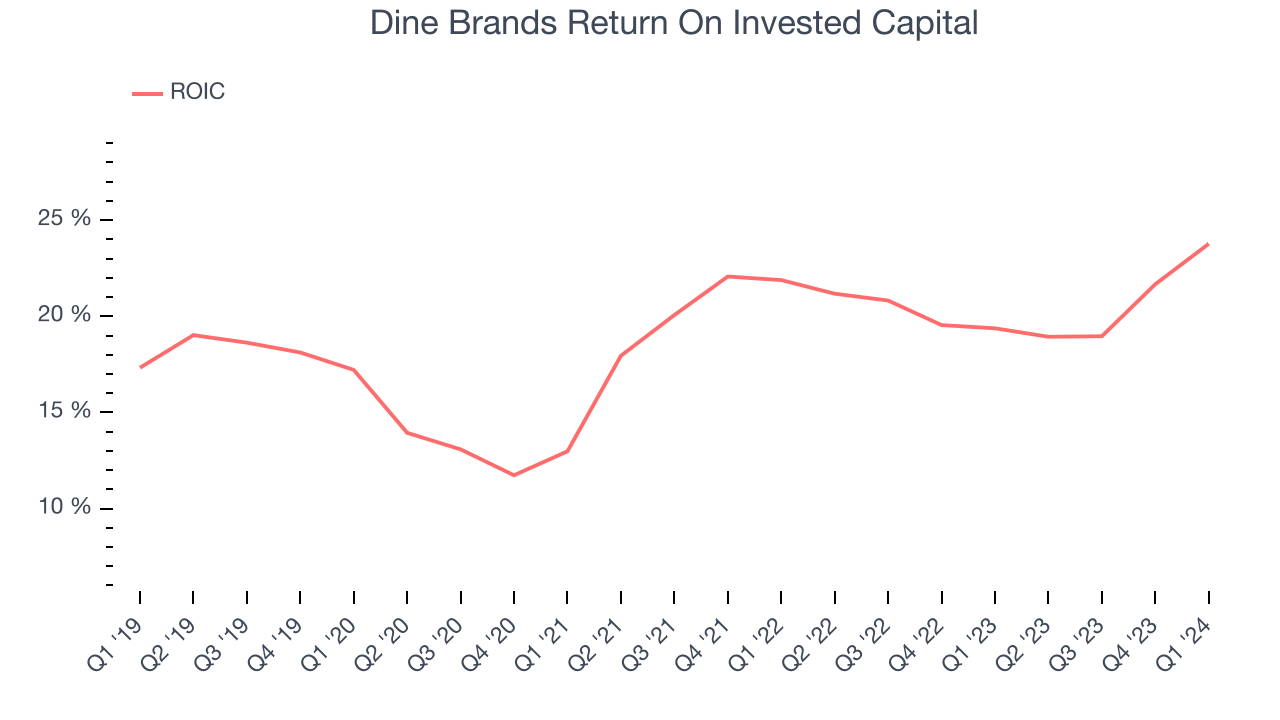
The trend in its ROIC, however, is often what surprises the market and drives the stock price. Over the last few years, Dine Brands's ROIC averaged 6.5 percentage point increases. This is a good sign, and we hope the company can continue improving.
Balance Sheet Risk
As long-term investors, the risk we care most about is the permanent loss of capital. This can happen when a company goes bankrupt or raises money from a disadvantaged position and is separate from short-term stock price volatility, which we are much less bothered by.
Dine Brands reported $145 million of cash and $1.21 billion of debt on its balance sheet in the most recent quarter. As investors in high-quality companies, we primarily focus on two things: 1) that a company's debt level isn't too high and 2) that its interest payments are not excessively burdening the business.
With $250.9 million of EBITDA over the last 12 months, we view Dine Brands's 4.2x net-debt-to-EBITDA ratio as safe. We also see its $37.27 million of annual interest expenses as appropriate. The company's profits give it plenty of breathing room, allowing it to continue investing in new initiatives.
Key Takeaways from Dine Brands's Q1 Results
Dine Brands's revenue and EPS unfortunately both missed analysts' expectations. While the company did reiterate its previous full year guidance, we consider this a mediocre quarter. The company is down 1.5% on the results and currently trades at $43 per share.
Is Now The Time?
Dine Brands may have had a tough quarter, but investors should also consider its valuation and business qualities when assessing the investment opportunity.
We cheer for all companies serving consumers, but in the case of Dine Brands, we'll be cheering from the sidelines. Its revenue has declined over the last five years, but at least growth is expected to increase in the short term. And while its stellar ROIC suggests it has been a well-run company historically, the downside is its poor same-store sales performance has been a headwind. On top of that, its projected EPS for the next year is lacking.
Dine Brands's price-to-earnings ratio based on the next 12 months is 6.7x. While there are some things to like about Dine Brands and its valuation is reasonable, we think there are better opportunities elsewhere in the market right now.
Wall Street analysts covering the company had a one-year price target of $58.63 per share right before these results (compared to the current share price of $43).
To get the best start with StockStory, check out our most recent stock picks, and then sign up to our earnings alerts by adding companies to your watchlist here. We typically have the quarterly earnings results analyzed within seconds of the data being released, and especially for companies reporting pre-market, this often gives investors the chance to react to the results before the market has fully absorbed the information.