
Global entertainment and media company Disney (NYSE:DIS) reported results in line with analysts' expectations in Q1 CY2024, with revenue up 1.2% year on year to $22.08 billion. It made a GAAP loss of $0.01 per share, down from its profit of $0.69 per share in the same quarter last year.
Disney (DIS) Q1 CY2024 Highlights:
- Revenue: $22.08 billion vs analyst estimates of $22.14 billion (small miss)
- Operating profit: $3.85 billion vs analyst estimates of $3.66 billion (5.0% beat)
- Full year 2024 EPS guidance of 25% year on year growth, in line with expectations
- Gross Margin (GAAP): 13%, up from 10.4% in the same quarter last year
- Free Cash Flow of $2.41 billion, up 172% from the previous quarter
- Market Capitalization: $213.6 billion
Founded by brothers Walt and Roy, Disney (NYSE:DIS) is a multinational entertainment conglomerate, renowned for its theme parks, movies, television networks, and merchandise.
When it was founded in 1923, the Disney brothers' key focus was on animation, and the company gained wide acclaim for 'Steamboat Willie', an animated short film that was innovative for its time. In addition to that groundbreaking film, Disney created iconic characters such as Mickey Mouse, Donald Duck, and Pluto, paving the way for the company to move from animation to broader family entertainment.
Today, Disney's business encompasses areas such as traditional TV networks such as ABC and ESPN, theme parks and resorts, film production and distribution, streaming services, and consumer products such as toys. Because of these diverse business lines, Disney's presence is nearly ubiquitous to Americans and even the international consumer. The company therefore counts a wide range of ages and demographics as customers. Everyone from that toddler watching 'Frozen' for the 306th time on Disney+ to the avid sports fan who depends on ESPN to stay up on sports scores to the family visiting Disney World is a customer.
Disney's products and offerings are diverse, so it follows that how the company makes money is diverse as well. Some sources of revenue include tickets for theme parks, monthly subscriptions for Disney+, and toys. Other less-obvious revenue sources include advertising on its television networks and affiliate/retransmission fees from companies that carry its channels.
Media
The advent of the internet changed how shows, films, music, and overall information flow. As a result, many media companies now face secular headwinds as attention shifts online. Some have made concerted efforts to adapt by introducing digital subscriptions, podcasts, and streaming platforms. Time will tell if their strategies succeed and which companies will emerge as the long-term winners.
Competitors in the entertainment and media industry include Comcast (NASDAQ:CMCSA), Warner Bros. Discovery (NASDAQ:WBD), and Paramount Global (NASDAQ:PARA).Sales Growth
A company’s long-term performance can be indicative of its business health. Any business can put up a good quarter or two, but many enduring ones muster tend to grow for years. Disney's annualized revenue growth rate of 8.3% over the last five years was weak for a consumer discretionary business. 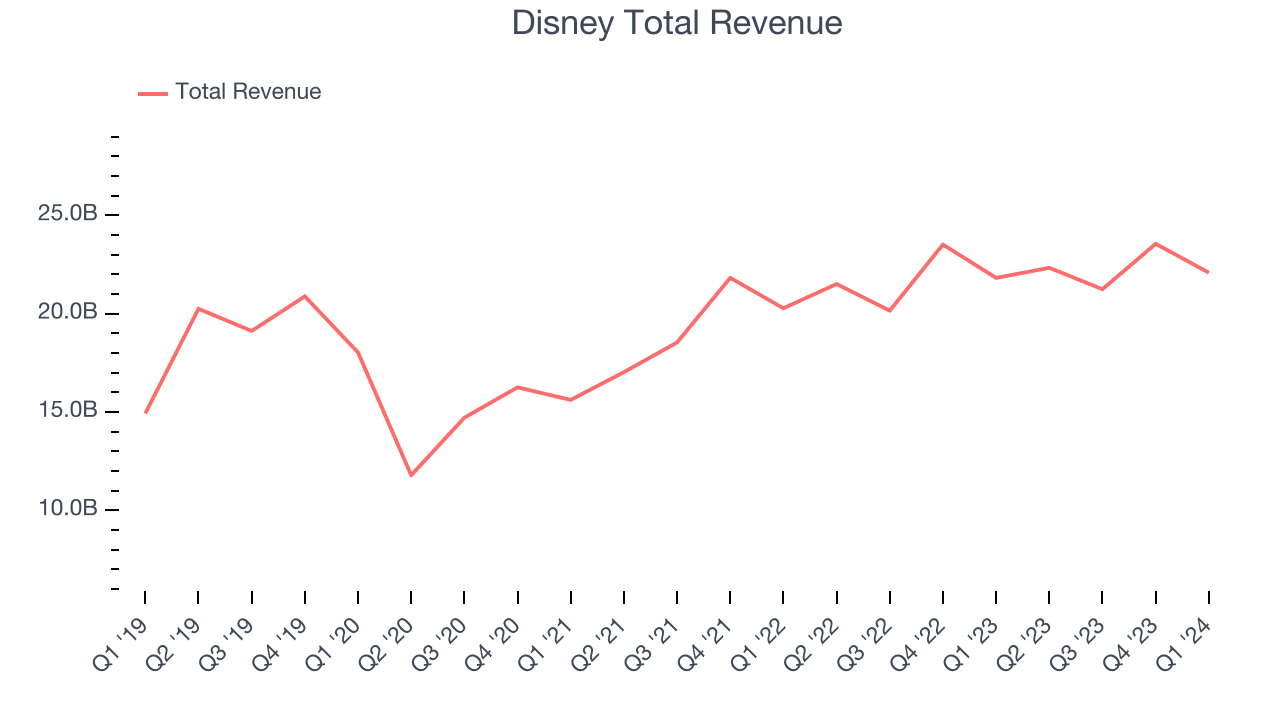
Within consumer discretionary, a long-term historical view may miss a company riding a successful new product or emerging trend. That's why we also follow more recent performance. Disney's recent history shows its demand slowed as its annualized revenue growth of 7.2% over the last two years is below its five-year trend.
We can better understand the company's revenue dynamics by analyzing its three most important segments: Entertainment, Sports, and Experiences, which are 44.4%, 19.5%, and 38% of revenue. Over the last two years, Disney's Entertainment revenue (movies, Disney+) averaged 1.8% year-on-year declines, but its Sports (ESPN, SEC Network) and Experiences (theme parks) revenues averaged 6.7% and 24.4% growth.
This quarter, Disney grew its revenue by 1.2% year on year, and its $22.08 billion of revenue was in line with Wall Street's estimates. Looking ahead, Wall Street expects sales to grow 5.7% over the next 12 months, an acceleration from this quarter.
Operating Margin
Disney has managed its expenses well over the last two years. It's demonstrated solid profitability for a consumer discretionary business, producing an average operating margin of 13.4%.
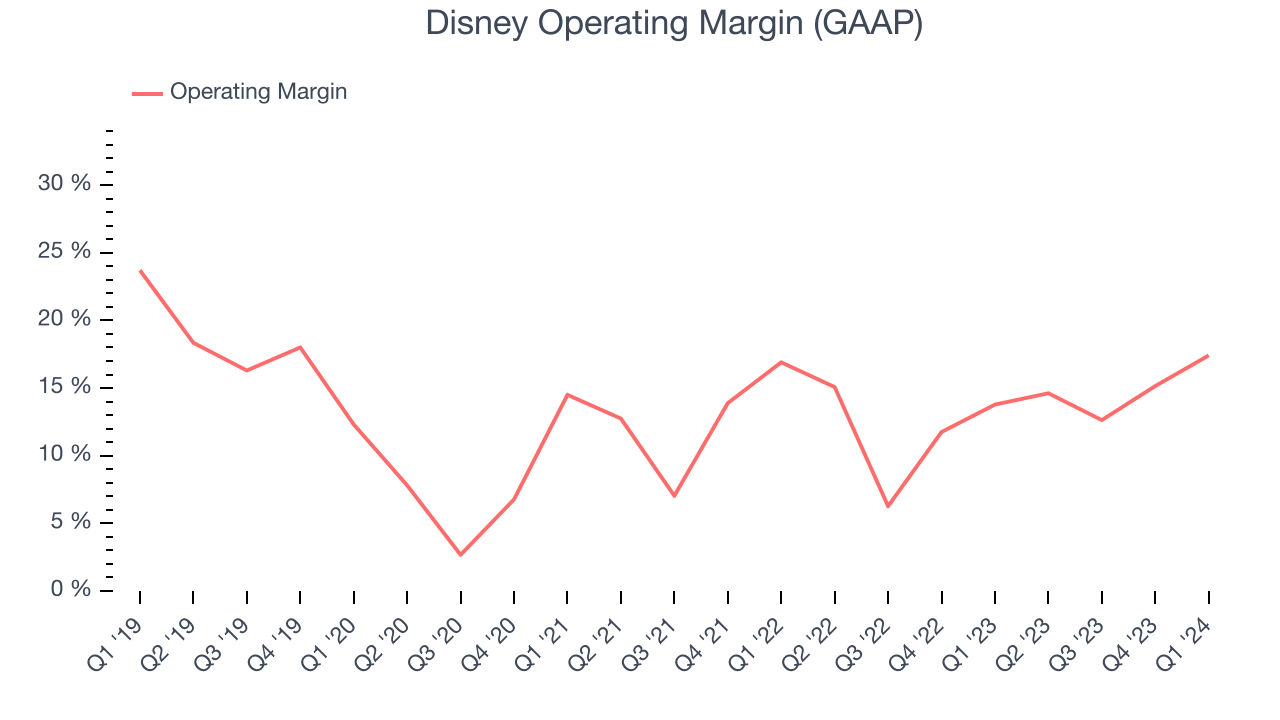
This quarter, Disney generated an operating profit margin of 17.4%, up 3.6 percentage points year on year. Looking ahead, Wall Street expects Disney to become more profitable. Analysts are expecting the company’s trailing 12 month operating margin of 15% to rise to 17.5% in the coming year.
EPS
Analyzing long-term revenue trends tells us about a company's historical growth, but the long-term change in its earnings per share (EPS) points to the profitability of that growth–for example, a company could inflate its sales through excessive spending on advertising and promotions.
Sadly for Disney, its EPS declined by 36.5% annually over the last five years while its revenue grew by 8.3%. All else equal, this tells us its incremental sales were unprofitable. 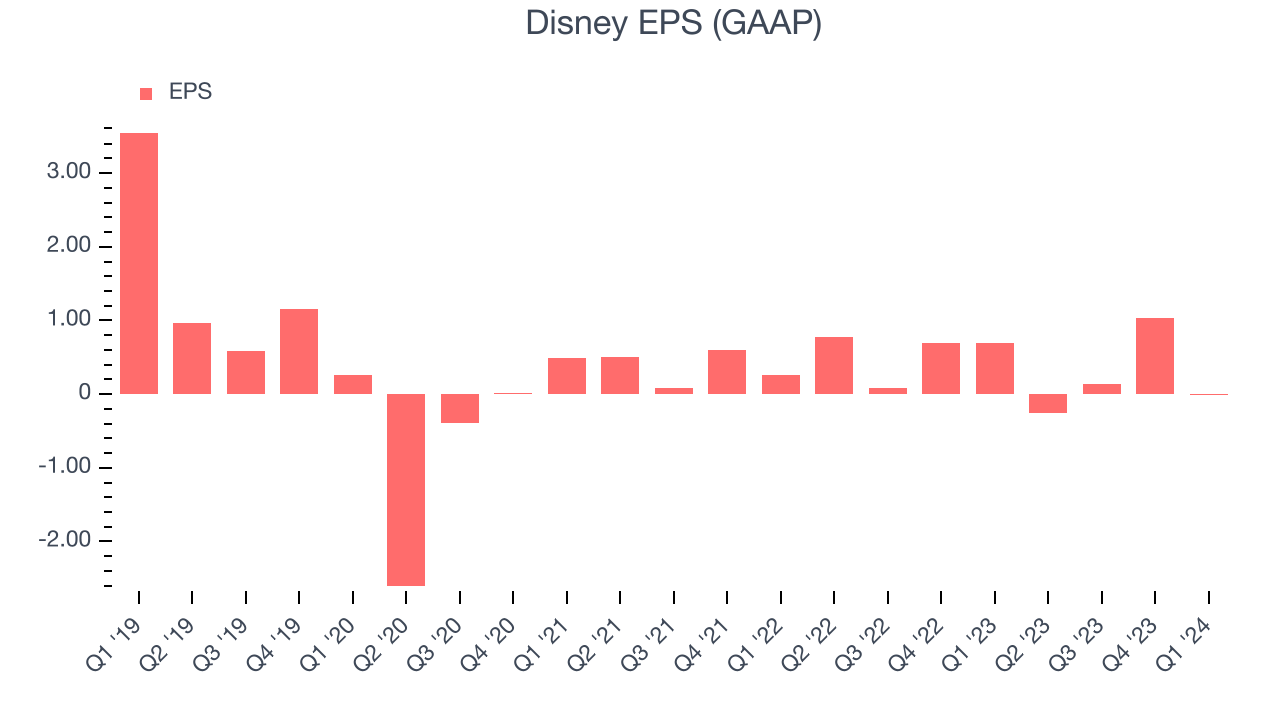
We can delve even further into Disney's earnings performance. While we mentioned earlier that Disney's operating margin improved this quarter, a five-year view shows its margin has declined 6.3 percentage points, leading to lower profitability and earnings. Taxes and interest expenses can also affect EPS but don't tell us as much about a company's fundamentals.
In Q1, Disney reported EPS at negative $0.01, down from $0.69 in the same quarter last year. This print missed analysts' estimates. Over the next 12 months, Wall Street expects Disney to grow its earnings. Analysts are projecting its EPS of $0.92 in the last year to climb by 391% to $4.52.
Cash Is King
If you've followed StockStory for a while, you know we emphasize free cash flow. Why, you ask? We believe that in the end, cash is king, and you can't use accounting profits to pay the bills.
Disney has shown weak cash profitability over the last two years, putting it in a pinch as it gives the company limited opportunities to reinvest, pay down debt, or return capital to shareholders. Its free cash flow margin averaged 5.5%, subpar for a consumer discretionary business.
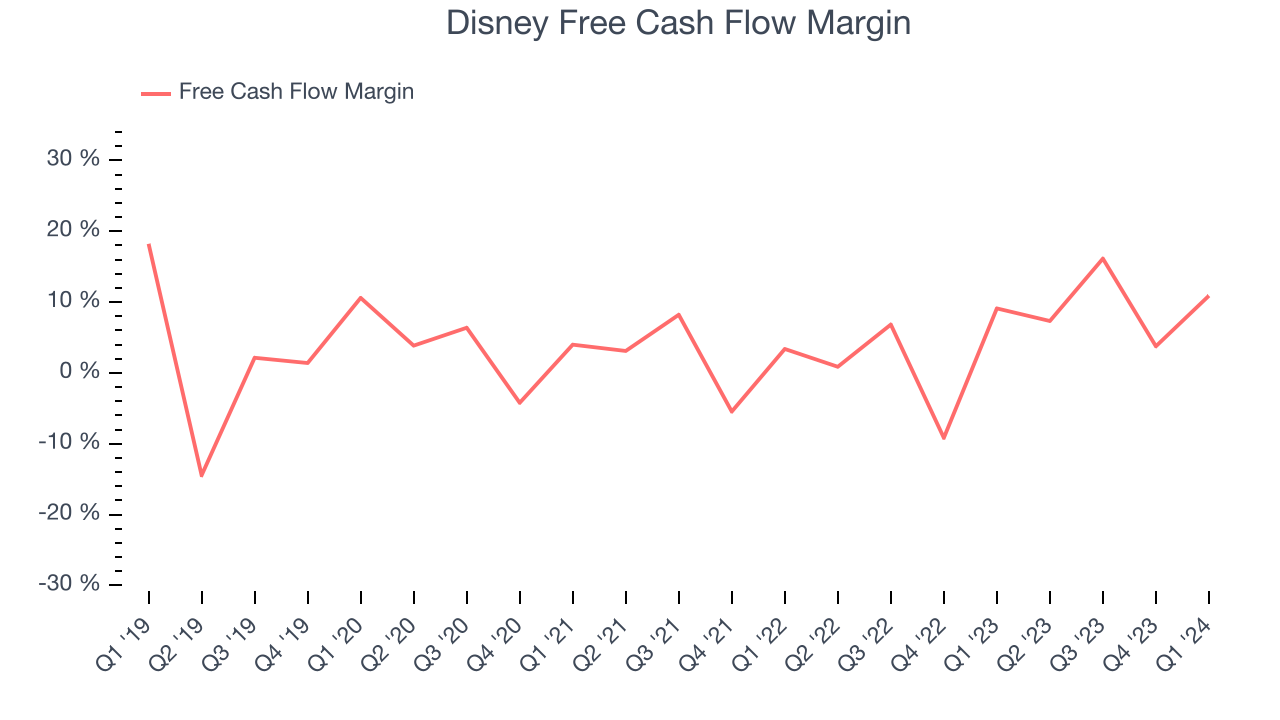
Disney's free cash flow clocked in at $2.41 billion in Q1, equivalent to a 10.9% margin. This quarter's result was good as its margin was 1.8 percentage points higher than in the same quarter last year. Over the next year, analysts predict Disney's cash profitability will fall. Their consensus estimates imply its free cash flow margin of 9.4% for the last 12 months will decrease to 8.1%.
Return on Invested Capital (ROIC)
EPS and free cash flow tell us whether a company was profitable while growing revenue. But was it capital-efficient? A company’s ROIC explains this by showing how much operating profit a company makes compared to how much money the business raised (debt and equity).
Disney's five-year average ROIC was 7.1%, somewhat low compared to the best consumer discretionary companies that consistently pump out 25%+. Its returns suggest it was mediocre at investing in profitable business initiatives.
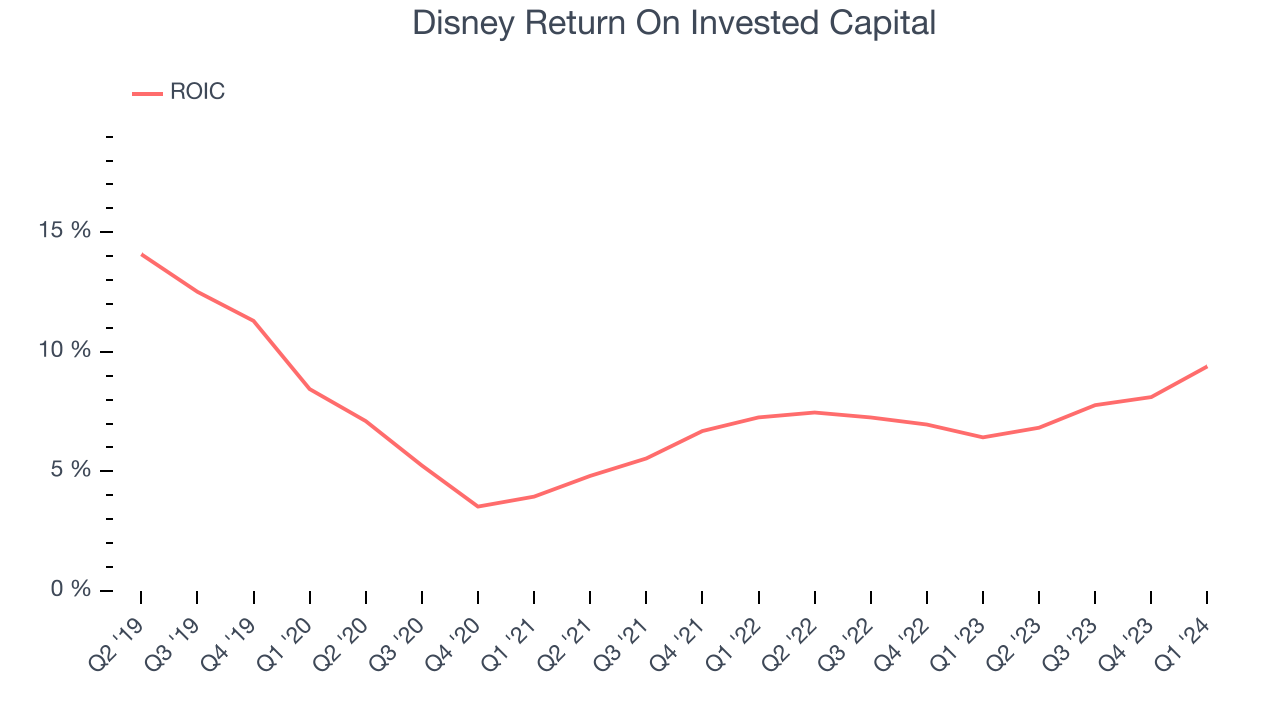
The trend in its ROIC, however, is often what surprises the market and drives the stock price. Over the last few years, Disney's ROIC averaged 1.7 percentage point increases. This is a good sign, and we hope the company can continue improving.
Balance Sheet Risk
Debt is a tool that can boost company returns but presents risks if used irresponsibly.
Disney reported $6.64 billion of cash and $46.3 billion of debt on its balance sheet in the most recent quarter. As investors in high-quality companies, we primarily focus on two things: 1) that a company's debt level isn't too high and 2) that its interest payments are not excessively burdening the business.
With $18.6 billion of EBITDA over the last 12 months, we view Disney's 2.1x net-debt-to-EBITDA ratio as safe. We also see its $1.41 billion of annual interest expenses as appropriate. The company's profits give it plenty of breathing room, allowing it to continue investing in new initiatives.
Key Takeaways from Disney's Q1 Results
It was encouraging to see Disney slightly top analysts' operating margin expectations this quarter. On the other hand, its Experiences segment revenue fell short of Wall Street's estimates, leading to a slight total revenue miss. Additionally, Experiences segment operating income expected to come in comparable vs. last year's amount, lower than Wall Street's expectation. Overall, the results could have been better. The company is down 4.7% on the results and currently trades at $110.93 per share.
Is Now The Time?
Disney may have had a tough quarter, but investors should also consider its valuation and business qualities when assessing the investment opportunity.
We cheer for companies serving consumers, but in the case of Disney, we'll be cheering from the sidelines. Its revenue growth has been a little slower over the last five years, and analysts expect growth to deteriorate from here. And while its projected EPS for the next year implies the company's fundamentals will improve, the downside is its declining EPS over the last five years makes it hard to trust over the long term. On top of that, its relatively low ROIC suggests it has historically struggled to find profitable business opportunities.
Disney's price-to-earnings ratio based on the next 12 months is 22.7x. While one can find things to like about Disney, we think there are better opportunities elsewhere in the market. We don't see many reasons to get involved at the moment.
Wall Street analysts covering the company had a one-year price target of $126.48 per share right before these results (compared to the current share price of $110.93).
To get the best start with StockStory, check out our most recent stock picks, and then sign up for our earnings alerts by adding companies to your watchlist here. We typically have the quarterly earnings results analyzed within seconds of the data being released, and especially for companies reporting pre-market, this often gives investors the chance to react to the results before the market has fully absorbed the information.