
Restaurant company Darden (NYSE:DRI) missed analysts' expectations in Q1 CY2024, with revenue up 6.8% year on year to $2.97 billion. The company's full-year revenue guidance of $11.4 billion at the midpoint also came in slightly below analysts' estimates. It made a non-GAAP profit of $2.62 per share, improving from its profit of $2.34 per share in the same quarter last year.
Darden (DRI) Q1 CY2024 Highlights:
- Revenue: $2.97 billion vs analyst estimates of $3.03 billion (1.7% miss)
- EPS (non-GAAP): $2.62 vs analyst expectations of $2.62 (small miss)
- The company dropped its revenue guidance for the full year from $11.5 billion to $11.4 billion at the midpoint, a 0.9% decrease (slightly below current expectations)
- EPS guidance for the full year of $8.85 at the midpoint slightly below current expectations of $8.86
- Gross Margin (GAAP): 21.7%, up from 21% in the same quarter last year
- Free Cash Flow of $420.1 million, up 134% from the previous quarter
- Same-Store Sales were down 1% year on year (miss vs. expectations of up 1% year on year)
- Store Locations: 2,022 at quarter end, increasing by 132 over the last 12 months
- Market Capitalization: $20.85 billion
Started in 1968 as the famous seafood joint, Red Lobster, Darden (NYSE:DRI) is a leading American restaurant company that owns and operates a portfolio of popular restaurant brands.
Although it no longer owns Red Lobster (sold to private equity firm Golden Gate Capital in 2014), Darden has expanded its banners through acquisitions, including iconic full-service restaurant chains such as Olive Garden, LongHorn Steakhouse, Cheddar's Scratch Kitchen, Yard House, The Capital Grille, Seasons 52, and Bahama Breeze.
Each brand offers a unique culinary experience, showcasing a range of flavors, cuisines, and atmospheres to suit various tastes and dining preferences. For example, casual diners can indulge in unlimited breadsticks and beloved Italian classics at Olive Garden while fine diners can enjoy a perfectly grilled steak at any of The Capital Grille’s upscale locations.
Despite these differences, the unifying theme between Darden’s restaurants is a commitment to exceptional customer service. The company places great emphasis on providing warm and welcoming environments, ensuring that guests feel at home as soon as they step through its restaurants’ doors.
Darden has also embraced technology to meet the evolving demands of the modern dining landscape. Many of its banners offer online reservation systems and convenient mobile apps for easy booking and ordering. These digital innovations streamline the dining process, providing customers with greater convenience and flexibility.
Sit-Down Dining
Sit-down restaurants offer a complete dining experience with table service. These establishments span various cuisines and are renowned for their warm hospitality and welcoming ambiance, making them perfect for family gatherings, special occasions, or simply unwinding. Their extensive menus range from appetizers to indulgent desserts and wines and cocktails. This space is extremely fragmented and competition includes everything from publicly-traded companies owning multiple chains to single-location mom-and-pop restaurants.
Multi-brand full-service restaurant competitors include Bloomin’ Brands (NASDAQ:BLMN), Brinker International (NYSE:EAT), Dine Brands (NYSE:DIN), Texas Roadhouse (NASDAQ:TXRH), and The Cheesecake Factory (NASDAQ:CAKE).Sales Growth
Darden is one of the most widely recognized restaurant chains in the world and benefits from brand equity, giving it customer loyalty and more influence over purchasing decisions.
As you can see below, the company's annualized revenue growth rate of 5.9% over the last five years was weak , but to its credit, it opened new restaurants and grew sales at existing, established dining locations.
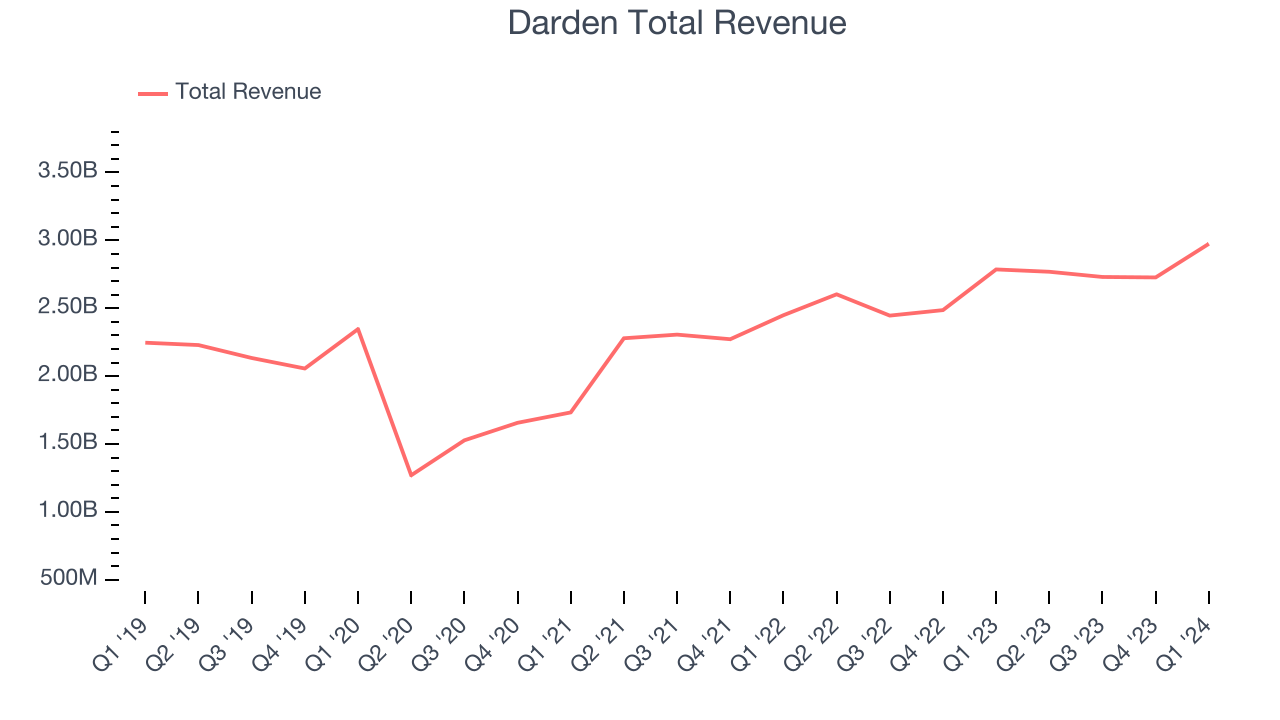
This quarter, Darden's revenue grew 6.8% year on year to $2.97 billion, missing Wall Street's expectations. Looking ahead, Wall Street expects sales to grow 6.9% over the next 12 months, an acceleration from this quarter.
Number of Stores
When a chain like Darden is opening new restaurants, it usually means it's investing for growth because there's healthy demand for its meals and there are markets where the concept has few or no locations. Darden's restaurant count increased by 132, or 7%, over the last 12 months to 2,022 locations in the most recently reported quarter.
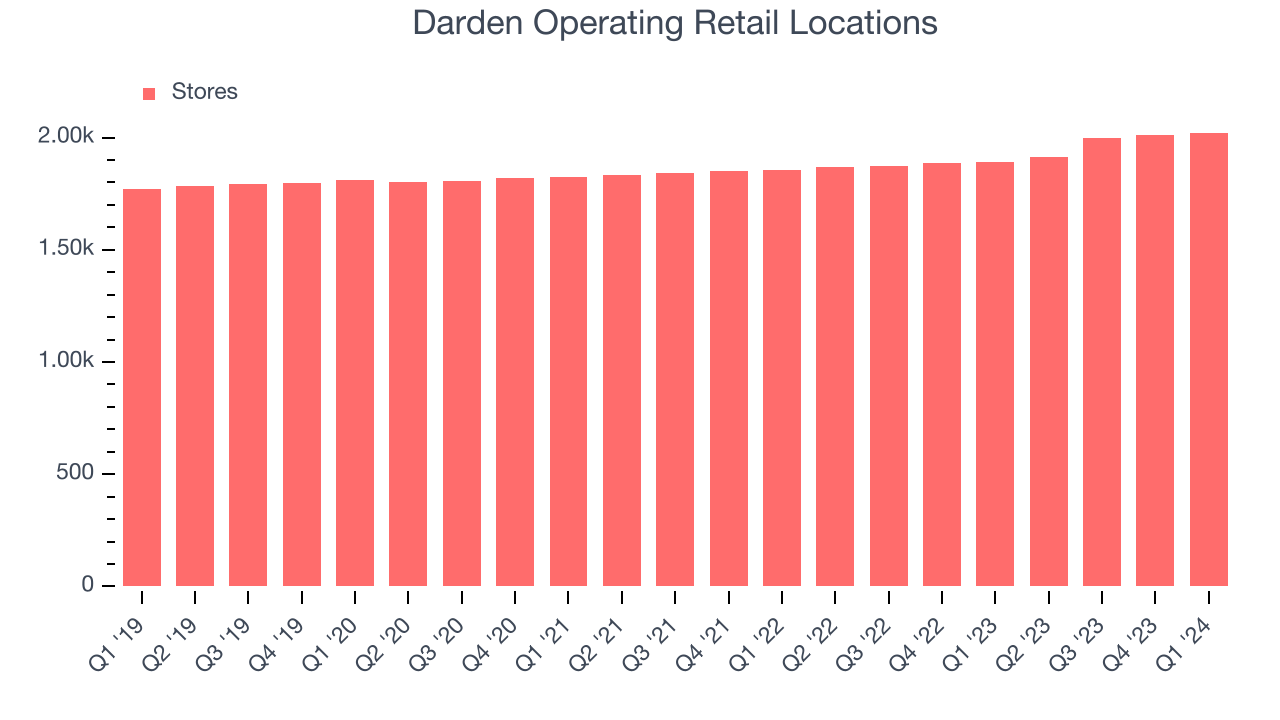
Over the last two years, Darden has rapidly opened new restaurants, averaging 3.8% annual increases in new locations. This growth is among the fastest in the restaurant sector. Analyzing a restaurant's location growth is important because expansion means Darden has more opportunities to feed customers and generate sales.
Same-Store Sales
Same-store sales growth is a key performance indicator used to measure organic growth and demand for restaurants.
Darden's demand within its existing restaurants has generally risen over the last two years but lagged behind the broader sector. On average, the company's same-store sales have grown by 5.7% year on year. With positive same-store sales growth amid an increasing number of restaurants, Darden is reaching more diners and growing sales.
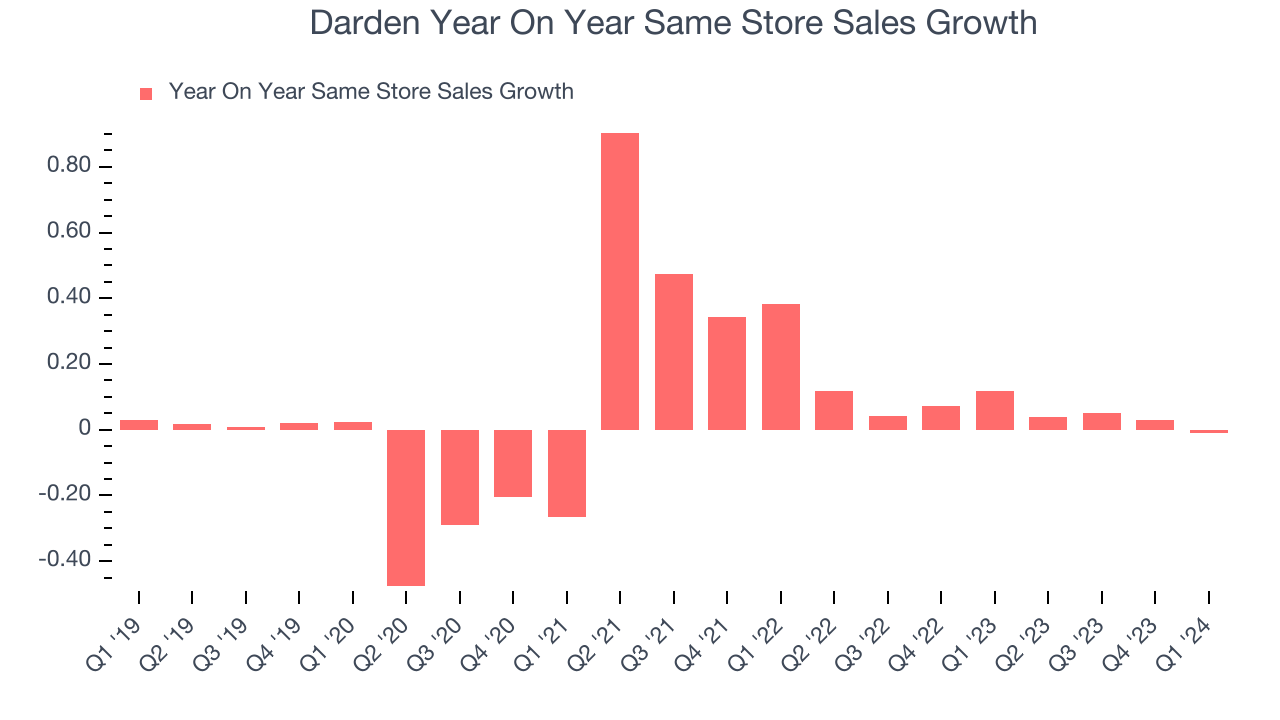
In the latest quarter, Darden's year on year same-store sales were flat. By the company's standards, this growth was a meaningful deceleration from the 11.7% year-on-year increase it posted 12 months ago. We'll be watching Darden closely to see if it can reaccelerate growth.
Gross Margin & Pricing Power
Gross profit margins tell us how much money a restaurant gets to keep after paying for the direct costs of the meals it sells.
Darden's gross profit margin came in at 21.7% this quarter. in line with the same quarter last year. This means the company makes $0.20 for every $1 in revenue before accounting for its operating expenses.
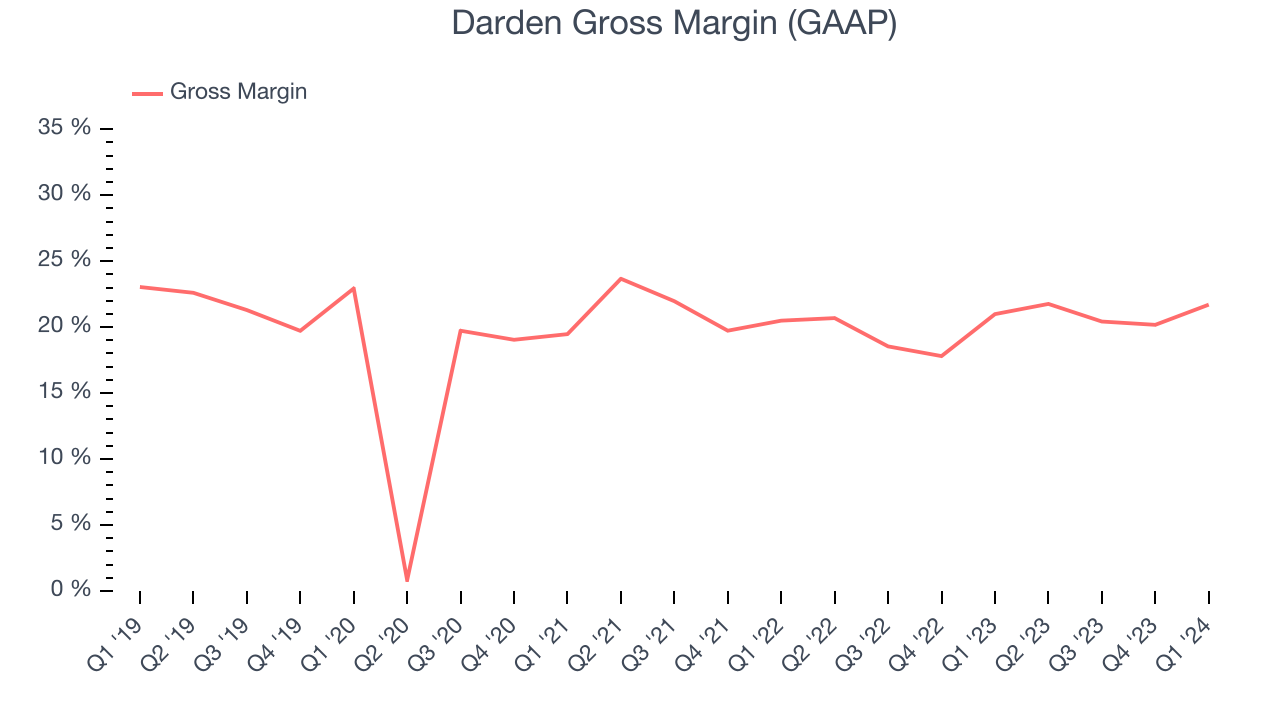
Darden has weak unit economics for a restaurant company, making it difficult to reinvest in the business. As you can see above, it's averaged a 20.3% gross margin over the last eight quarters. Its margin, however, has been trending up over the last 12 months, averaging 8% year-on-year increases each quarter. If this trend continues, it could suggest a less competitive environment.
Operating Margin
Operating margin is an important measure of profitability for restaurants as it accounts for all expenses keeping the lights on, including wages, rent, advertising, and other administrative costs.
In Q1, Darden generated an operating profit margin of 13%, in line with the same quarter last year. This indicates the company's costs have been relatively stable.
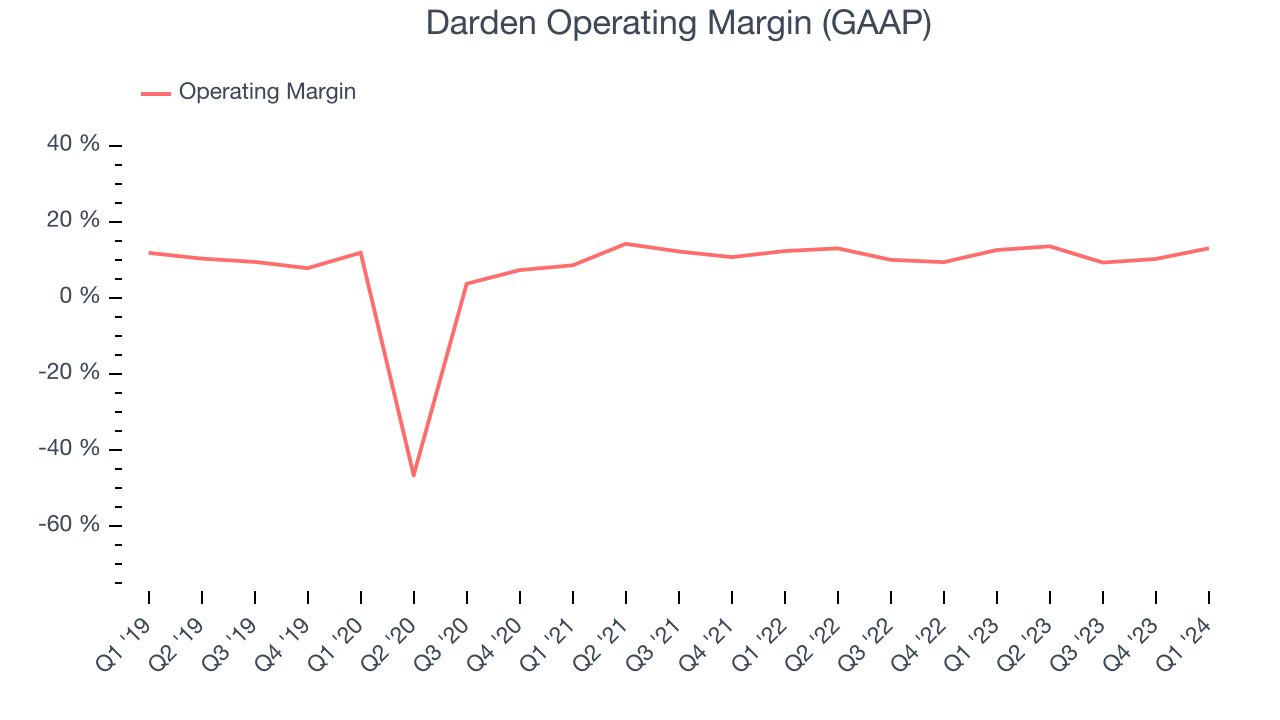 Zooming out, Darden has done a decent job managing its expenses over the last eight quarters. The company has produced an average operating margin of 11.4%, higher than the broader restaurant sector. On top of that, its margin has remained more or less the same, highlighting the consistency of its business. The company's operating profitability was particularly impressive because of its low gross margin, which is mostly a factor of what it sells and takes tectonic shifts to move meaningfully. Companies have more control over their operating margins, and it signals strength if they're high when gross margins are low (like for Darden).
EPS
Earnings growth is a critical metric to track, but for long-term shareholders, earnings per share (EPS) is more telling because it accounts for dilution and share repurchases.
In Q1, Darden reported EPS at $2.62, up from $2.34 in the same quarter a year ago. This print unfortunately missed Wall Street's estimates, but we care more about long-term EPS growth rather than short-term movements.
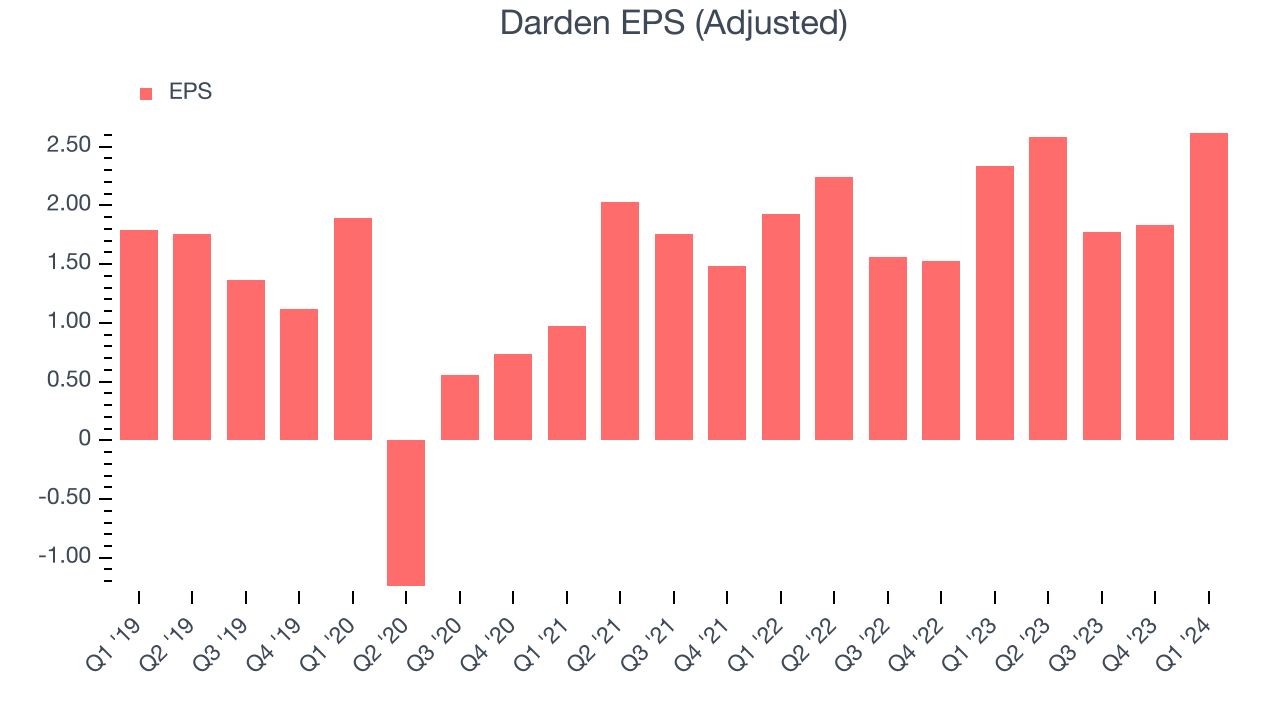
Wall Street expects the company to continue growing earnings over the next 12 months, with analysts projecting an average 7.5% year-on-year increase in EPS.
Cash Is King
Although earnings are undoubtedly valuable for assessing company performance, we believe cash is king because you can't use accounting profits to pay the bills.
Darden's free cash flow came in at $420.1 million in Q1, up 12.1% year on year. This result represents a 14.1% margin.
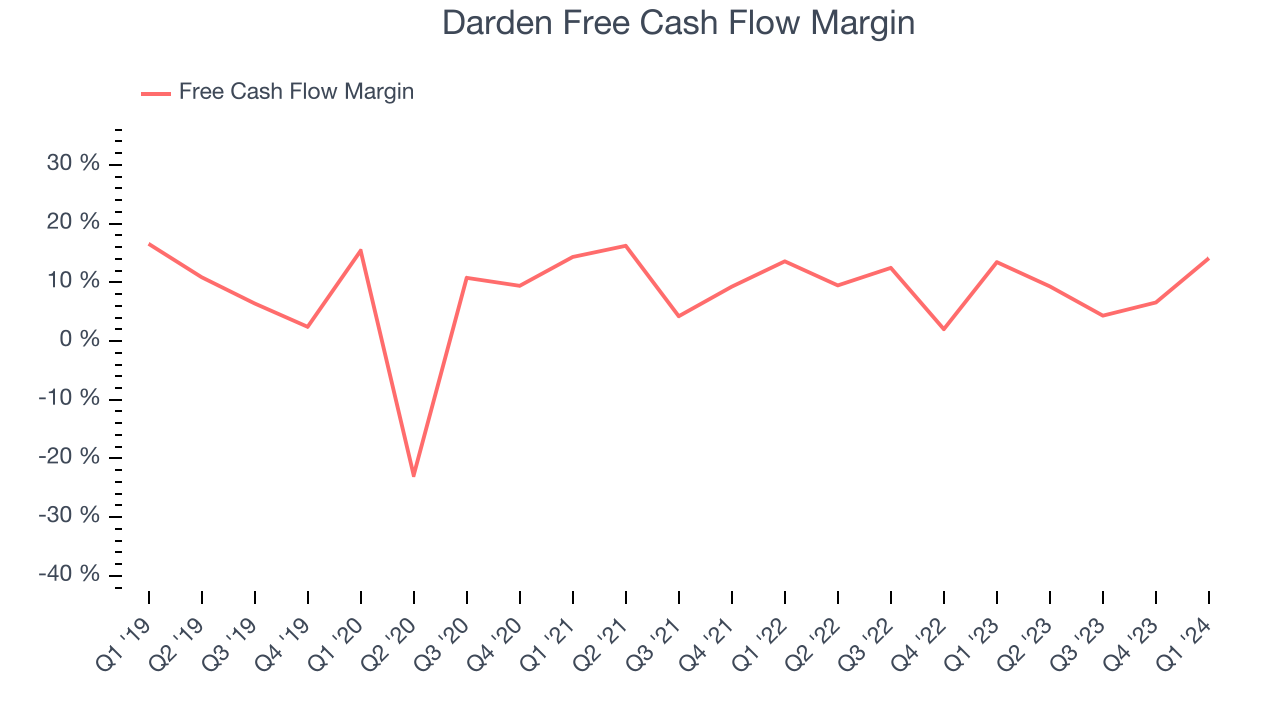
Over the last two years, Darden has shown strong cash profitability, giving it an edge over its competitors and the option to reinvest or return capital to investors while keeping cash on hand for emergencies. The company's free cash flow margin has averaged 9.1%, quite impressive for a restaurant business. Furthermore, its margin has been flat, showing that the company's cash flows are relatively stable.
Return on Invested Capital (ROIC)
EPS and free cash flow tell us whether a company was profitable while growing revenue. But was it capital-efficient? Enter ROIC, a metric showing how much operating profit a company generates relative to how much money the business raised (debt and equity).
Although Darden hasn't been the highest-quality company lately, it historically did a solid job investing in profitable business initiatives. Its five-year average ROIC was 11.8%, higher than most restaurant companies.
The trend in its ROIC, however, is often what surprises the market and drives the stock price. Over the last five years, Darden's ROIC averaged 10.4 percentage point increases each year, although a trough during COVID likely provided a low starting point for this comparison. This is a good sign, and if the company's returns keep rising, there's a chance it could evolve into an investable business.
Key Takeaways from Darden's Q1 Results
Darden's revenue unfortunately missed analysts' expectations and its full-year revenue guidance was lowered and slightly missed Wall Street's estimates. EPS guidance was also slightly below. Overall, this was a mediocre quarter for Darden. The company is down 4.9% on the results and currently trades at $166 per share.
Is Now The Time?
Darden may have had a tough quarter, but investors should also consider its valuation and business qualities when assessing the investment opportunity.
Darden isn't a bad business, but it probably wouldn't be one of our picks. Its revenue growth has been a little slower over the last five years, but at least growth is expected to increase in the short term. And while its unparalleled reputation makes it a household name consumers consistently turn to, the downside is its projected EPS for the next year is lacking. On top of that, its gross margins make it more difficult to reach positive operating profits compared to other restaurant businesses.
Darden's price-to-earnings ratio based on the next 12 months is 18.4x. We don't really see a big opportunity in the stock at the moment, but in the end, beauty is in the eye of the beholder. If you like Darden, it seems to be trading at a reasonable price.
Wall Street analysts covering the company had a one-year price target of $179.67 per share right before these results (compared to the current share price of $166).
To get the best start with StockStory, check out our most recent stock picks, and then sign up to our earnings alerts by adding companies to your watchlist here. We typically have the quarterly earnings results analyzed within seconds of the data being released, and especially for companies reporting pre-market, this often gives investors the chance to react to the results before the market has fully absorbed the information.