
Outdoor lifestyle and recreational products company Solo Brands (NYSE:DTC) reported Q1 CY2024 results beating Wall Street analysts' expectations, with revenue down 3.3% year on year to $85.32 million. The company's full-year revenue guidance of $500 million at the midpoint also came in 1% above analysts' estimates. It made a non-GAAP profit of $0.03 per share, down from its profit of $0.16 per share in the same quarter last year.
Solo Brands (DTC) Q1 CY2024 Highlights:
- Revenue: $85.32 million vs analyst estimates of $78 million (9.4% beat)
- EPS (non-GAAP): $0.03 vs analyst estimates of -$0.01 ($0.04 beat)
- The company reconfirmed its revenue guidance for the full year of $500 million at the midpoint
- Gross Margin (GAAP): 59.2%, down from 61.7% in the same quarter last year
- Free Cash Flow was -$20.91 million, down from $21.11 million in the previous quarter
- Market Capitalization: $114.5 million
Started through a Kickstarter campaign, Solo Brands (NYSE:DTC) is a provider of outdoor and recreational products.
The company was born in 2011 when founders Jeff and Spencer Jan recognized a gap in the market for affordable and high-quality fire pits. With this insight, the duo created its flagship product, the Solo Stove, a smokeless and portable fire pit.
Through several acquisitions, Solo Brands now encompasses various brands, including Solo Stove, Chubbies, Isle, and Oru Kayak. Each brand caters to different outdoor activities with products like outdoor stoves, casual apparel, paddle boards, and foldable kayaks.
Solo Brands's revenue is primarily generated through direct-to-consumer sales through its e-commerce platforms. This approach not only streamlines the purchasing process but also fosters strong customer engagement and brand loyalty, enabling Solo Brands to effectively gather feedback and personalize the customer experience. Select Solo Brands products can also be found at specialty retailers.
Leisure Products
Leisure products cover a wide range of goods in the consumer discretionary sector. Maintaining a strong brand is key to success, and those who differentiate themselves will enjoy customer loyalty and pricing power while those who don’t may find themselves in precarious positions due to the non-essential nature of their offerings.
Competitors in the outdoor and recreation space include YETI Holdings (NYSE:YETI), Clarus (NASDAQ:CLAR), and Johnson Outdoors (NASDAQ:JOUT).Sales Growth
A company's long-term performance can indicate its business quality. Any business can enjoy short-lived success, but best-in-class ones sustain growth over many years. Solo Brands's annualized revenue growth rate of 38.7% over the last three years was incredible for a consumer discretionary business. 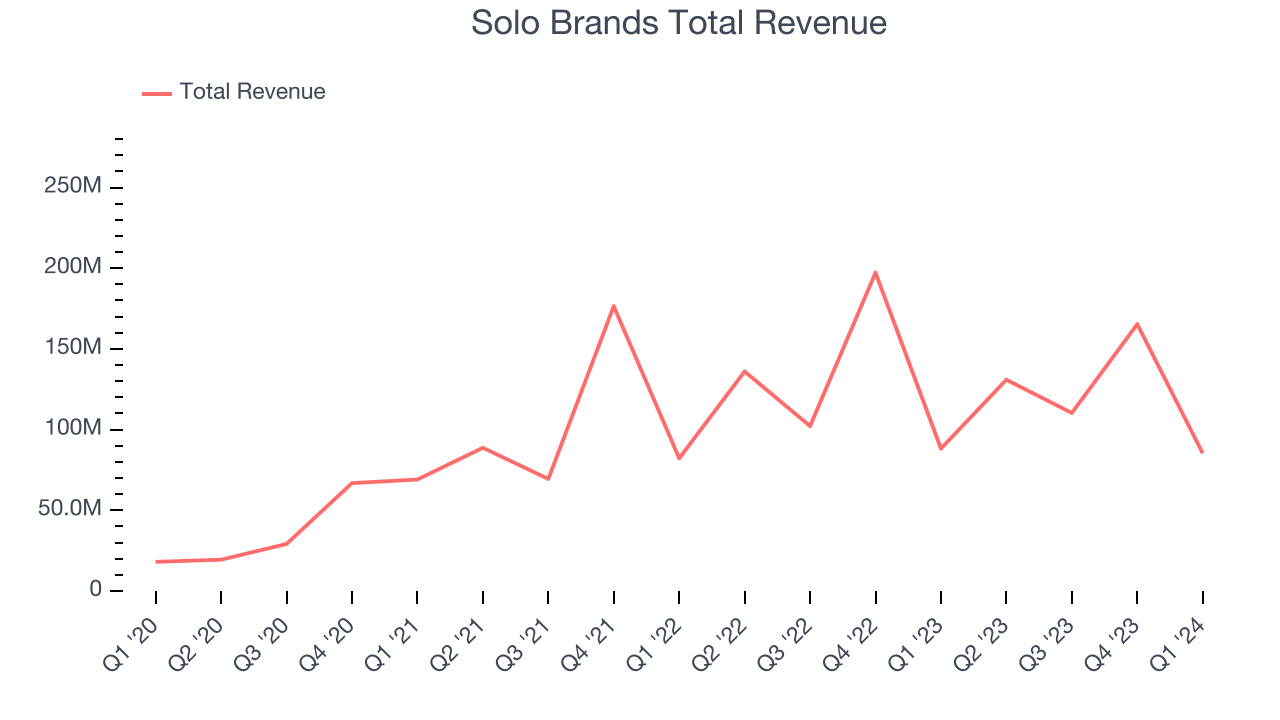 Within consumer discretionary, a long-term historical view may miss a company riding a successful new product or emerging trend. That's why we also follow short-term performance. Solo Brands's recent history shows its momentum has slowed as its annualized revenue growth of 8.6% over the last two years is below its three-year trend.
We can dig even further into the company's revenue dynamics by analyzing its most important segments, Direct-to-Consumer and Wholesale, which are 59.8% and 40.2% of revenue. Over the last two years, Solo Brands's Direct-to-Consumer revenue (direct sales to customers) averaged 5.9% year-on-year growth while its Wholesale revenue (sales to retailers) averaged 59.9% growth.
This quarter, Solo Brands's revenue fell 3.3% year on year to $85.32 million but beat Wall Street's estimates by 9.4%. Looking ahead, Wall Street expects sales to grow 1.2% over the next 12 months, an acceleration from this quarter.
Operating Margin
Operating margin is a key measure of profitability. Think of it as net income–the bottom line–excluding the impact of taxes and interest on debt, which are less connected to business fundamentals.
Given the consumer discretionary industry's volatile demand characteristics, unprofitable companies should be scrutinized. Over the last two years, Solo Brands's high expenses have contributed to an average operating margin of negative 22.7%.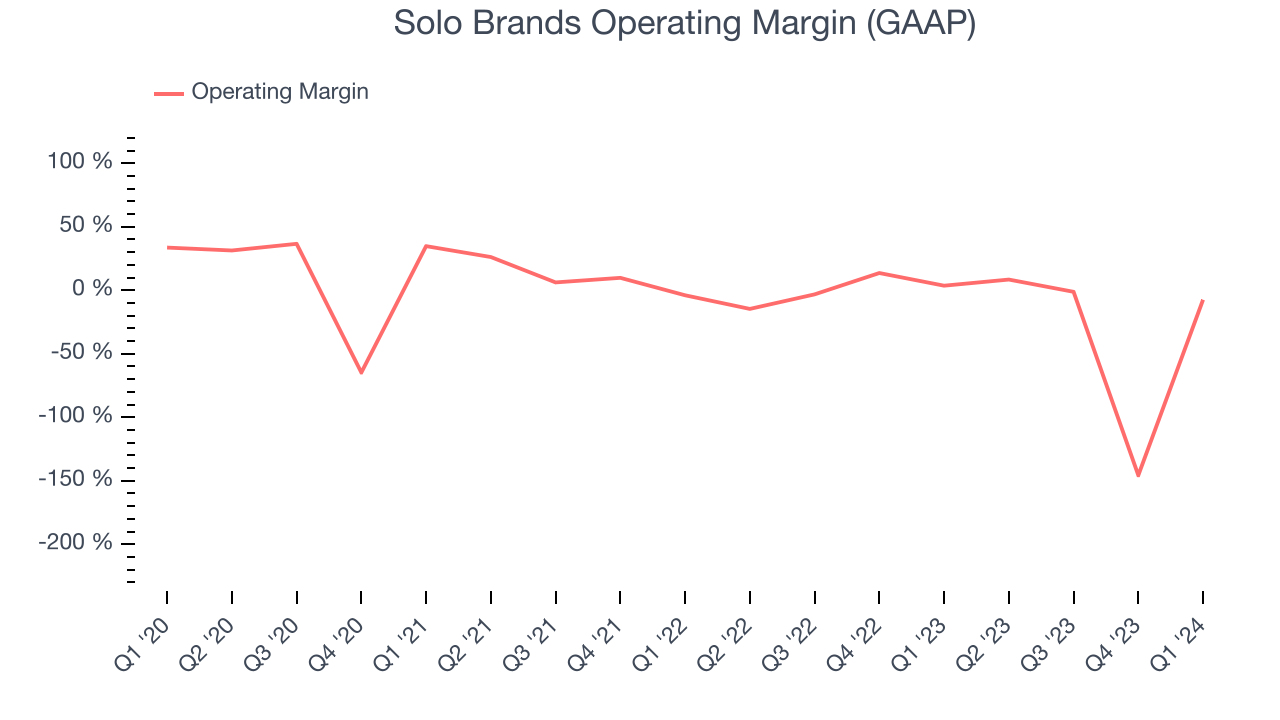
In Q1, Solo Brands generated an operating profit margin of negative 7.4%, down 11.1 percentage points year on year.
EPS
Analyzing long-term revenue trends tells us about a company's historical growth, but the long-term change in its earnings per share (EPS) points to the profitability and efficiency of that growth–for example, a company could inflate its sales through excessive spending on advertising and promotions. 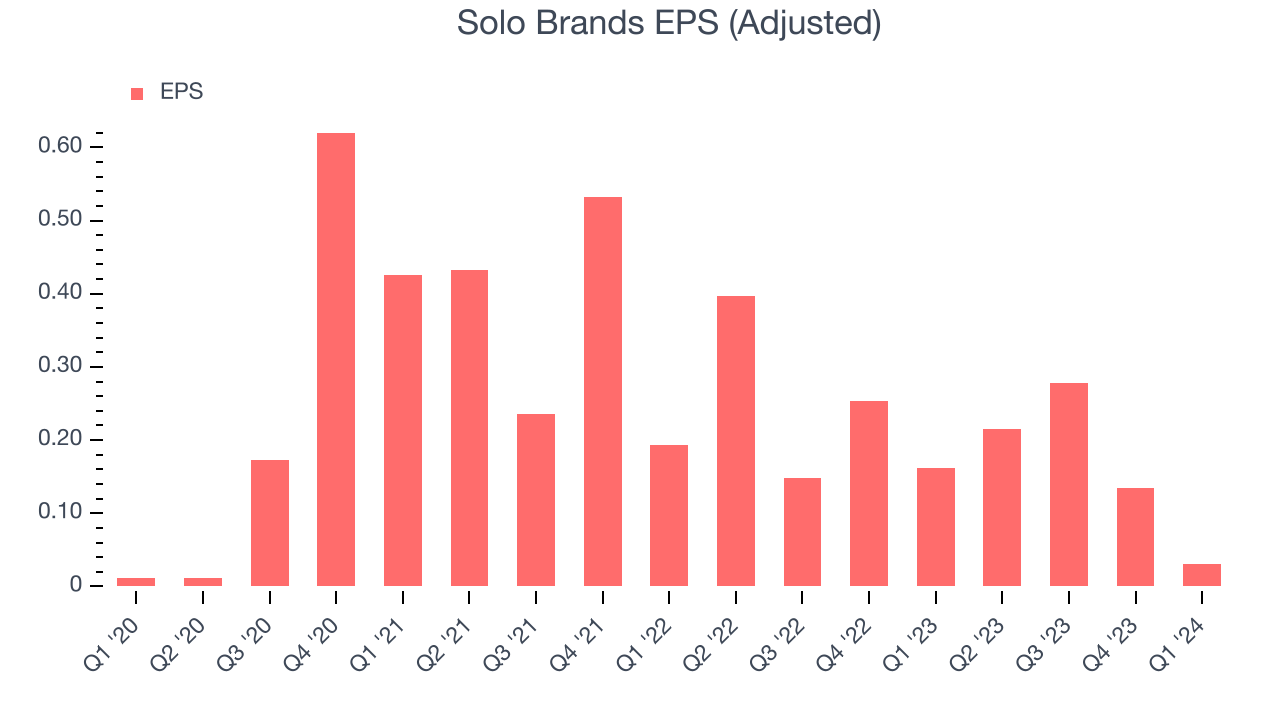
Over the last three years, Solo Brands's EPS dropped 67.8%, translating into 18.8% annualized declines. We tend to steer our readers away from companies with falling EPS, where diminishing earnings could imply changing secular trends or consumer preferences. Consumer discretionary companies are particularly exposed to this, leaving a low margin of safety around the company (making the stock susceptible to large downward swings).
In Q1, Solo Brands reported EPS at $0.03, down from $0.16 in the same quarter last year. Despite falling year on year, this print easily cleared analysts' estimates. Over the next 12 months, Wall Street expects Solo Brands to perform poorly. Analysts are projecting its LTM EPS of $0.66 to shrink by 22.7% to $0.51.
Cash Is King
If you've followed StockStory for a while, you know we emphasize free cash flow. Why, you ask? We believe that in the end, cash is king, and you can't use accounting profits to pay the bills.
Over the last two years, Solo Brands has shown mediocre cash profitability, putting it in a pinch as it gives the company limited opportunities to reinvest, pay down debt, or return capital to shareholders. Its free cash flow margin has averaged 8.2%, subpar for a consumer discretionary business.
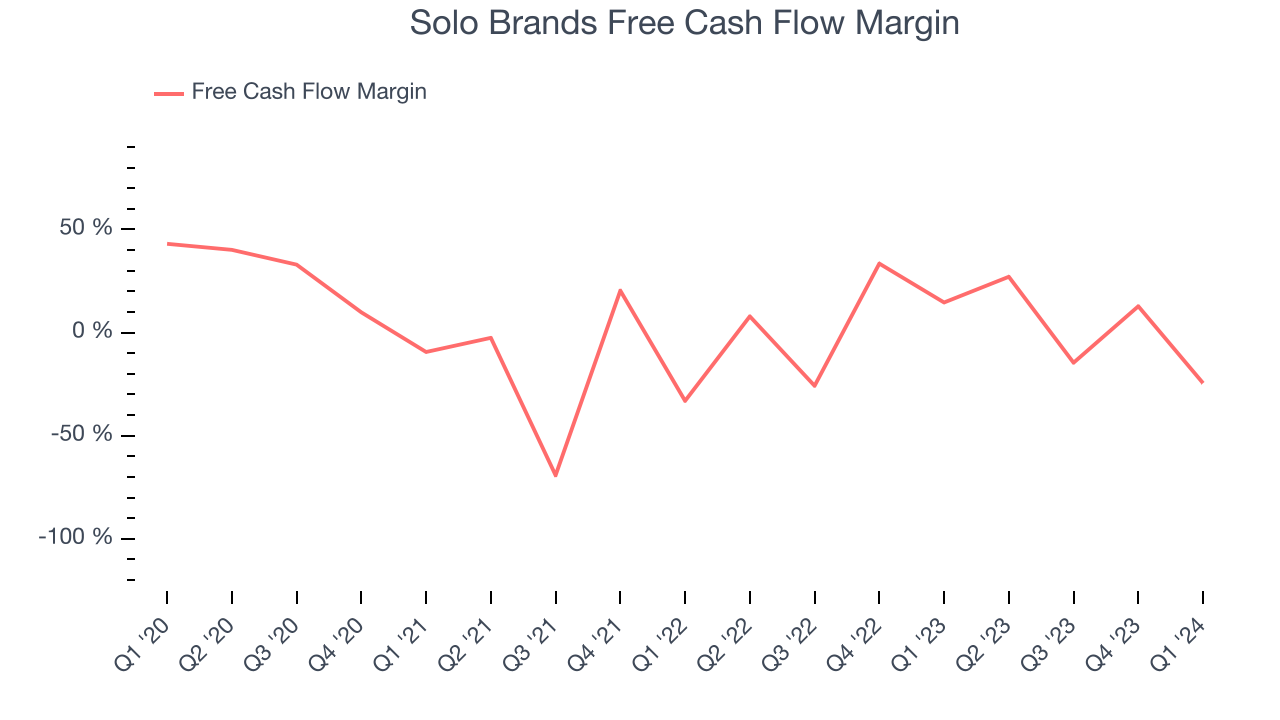
Solo Brands burned through $20.91 million of cash in Q1, equivalent to a negative 24.5% margin. This caught our eye as the company shifted from cash flow positive in the same quarter last year to cash flow negative this quarter.
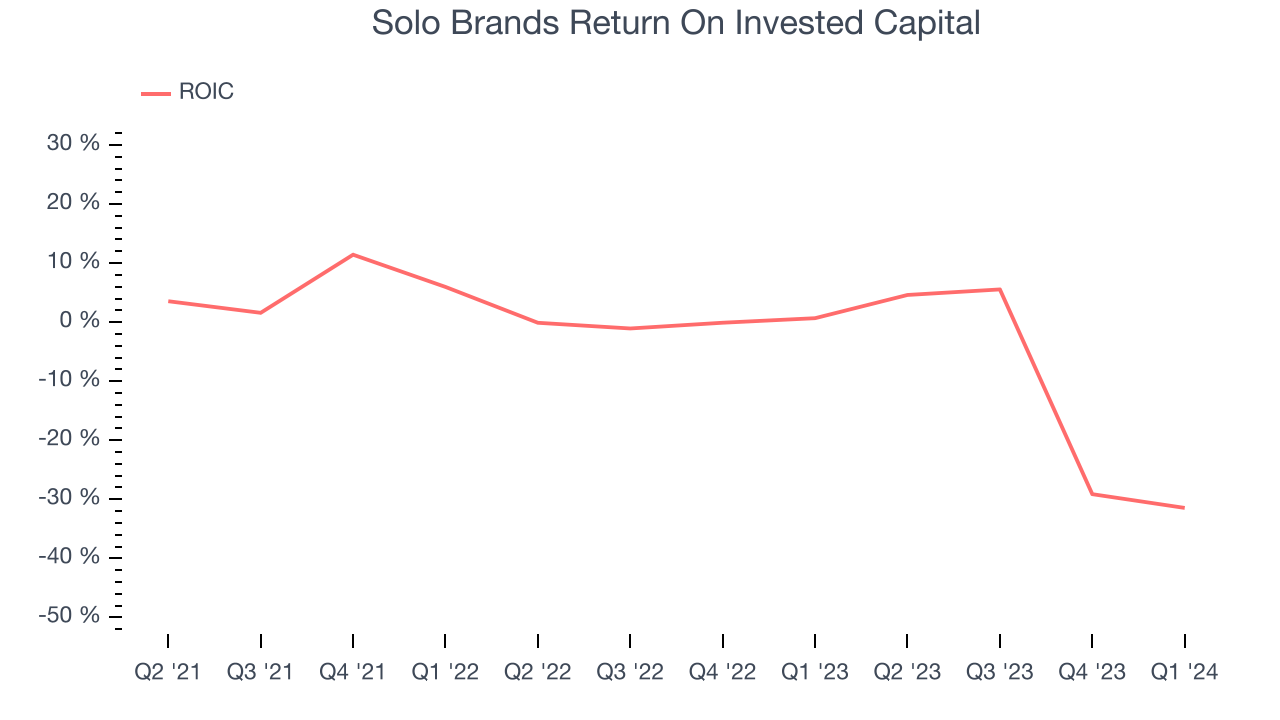
Return on Invested Capital (ROIC)
EPS and free cash flow tell us whether a company was profitable while growing revenue. But was it capital-efficient? A company’s ROIC explains this by showing how much operating profit a company makes compared to how much money the business raised (debt and equity).
Solo Brands's five-year average return on invested capital was negative 8.3%, meaning management lost money while trying to expand the business. Its returns were among the worst in the consumer discretionary sector.
Balance Sheet Risk
As long-term investors, the risk we care most about is the permanent loss of capital. This can happen when a company goes bankrupt or raises money from a disadvantaged position and is separate from short-term stock price volatility, which we are much less bothered by.
Solo Brands reported $15.41 million of cash and $198.3 million of debt on its balance sheet in the most recent quarter. As investors in high-quality companies, we primarily focus on two things: 1) that a company's debt level isn't too high and 2) that its interest payments are not excessively burdening the business.
With $59.11 million of EBITDA over the last 12 months, we view Solo Brands's 3.1x net-debt-to-EBITDA ratio as safe. We also see its $5.61 million of annual interest expenses as appropriate. The company's profits give it plenty of breathing room, allowing it to continue investing in new initiatives.
Key Takeaways from Solo Brands's Q1 Results
We were impressed by Solo Brands revenue and EPS beats versus expectations. On the other hand, its operating margin missed. Overall, we think this was still a fine quarter. The stock is flat after reporting and currently trades at $1.98 per share.
Is Now The Time?
Solo Brands may have had a favorable quarter, but investors should also consider its valuation and business qualities when assessing the investment opportunity.
We cheer for all companies serving consumers, but in the case of Solo Brands, we'll be cheering from the sidelines. Although its revenue growth has been exceptional over the last three years, its declining EPS over the last three years makes it hard to trust. On top of that, its projected EPS for the next year is lacking.
Solo Brands's price-to-earnings ratio based on the next 12 months is 3.9x. While there are some things to like about Solo Brands and its valuation is reasonable, we think there are better opportunities elsewhere in the market right now.
Wall Street analysts covering the company had a one-year price target of $3.99 per share right before these results (compared to the current share price of $1.98).
To get the best start with StockStory, check out our most recent stock picks, and then sign up for our earnings alerts by adding companies to your watchlist here. We typically have the quarterly earnings results analyzed within seconds of the data being released, and especially for companies reporting pre-market, this often gives investors the chance to react to the results before the market has fully absorbed the information.