Casual restaurant chain Brinker International (NYSE:EAT) reported results in line with analysts' expectations in Q1 CY2024, with revenue up 3.4% year on year to $1.12 billion. The company's outlook for the full year was also close to analysts' estimates with revenue guided to $4.34 billion at the midpoint. Its non-GAAP profit of $1.24 per share was flat year on year.
Brinker International (EAT) Q1 CY2024 Highlights:
- Revenue: $1.12 billion vs analyst estimates of $1.12 billion (small miss)
- EPS (non-GAAP): $1.24 vs analyst estimates of $1.15 (8% beat)
- The company raised both its revenue and EPS guidance for the full year (revenue now slightly ahead of Consensus, EPS well ahead)
- Gross Margin (GAAP): 15%, up from 14.2% in the same quarter last year
- Free Cash Flow of $78.7 million, up 61.9% from the previous quarter
- Same-Store Sales were up 3% year on year (in line)
- Store Locations: 1,618 at quarter end, decreasing by 36 over the last 12 months
- Market Capitalization: $2.20 billion
Founded by Norman Brinker in Dallas, Texas, Brinker International (NYSE:EAT) is a casual restaurant chain that operates under the Chili’s, Maggiano’s Little Italy, and It’s Just Wings banners.
The company’s history starts with its 1983 acquisition of Chili’s, which at the time was a Dallas burger joint. Chili’s became the cornerstone of Brinker’s portfolio, and the parent company expanded the Chili’s menu and experience to feature Southwestern American casual fare. Today, Chili’s most famous dish is its Baby Back Ribs.
From that initial acquisition, Brinker has added to its portfolio. The focus was familiar, comfort food served in an inviting family atmosphere. Maggiano’s Little Italy offers big plates of pasta and classic dishes like Chicken Parmasean for the table to share. Just Wings is exactly what the name describes, and it is actually a virtual restaurant. Customers order through an app and have the product delivered, which means there is no physical store to visit and dine in.
For Chili’s and Maggiano’s, the core customer is a middle-income family looking for a nice, full service dinner out. They don’t want to break the bank or visit a restaurant that is too stuffy and serious, though. The Just Wings customer is more tech savvy since the concept is a virtual one. This customer also values the convenience of home delivery.
Sit-Down Dining
Sit-down restaurants offer a complete dining experience with table service. These establishments span various cuisines and are renowned for their warm hospitality and welcoming ambiance, making them perfect for family gatherings, special occasions, or simply unwinding. Their extensive menus range from appetizers to indulgent desserts and wines and cocktails. This space is extremely fragmented and competition includes everything from publicly-traded companies owning multiple chains to single-location mom-and-pop restaurants.
Multi-brand full-service restaurant competitors include Darden (NYSE:DRI), Bloomin’ Brands (NASDAQ:BLMN), Dine Brands (NYSE:DIN), and The Cheesecake Factory (NASDAQ:CAKE).Sales Growth
Brinker International is one of the larger restaurant chains in the industry and benefits from a strong brand, giving it customer mindshare and influence over purchasing decisions.
As you can see below, the company's annualized revenue growth rate of 6% over the last five years was weak as its restaurant footprint remained unchanged, implying that growth was driven by more sales at existing, established dining locations.
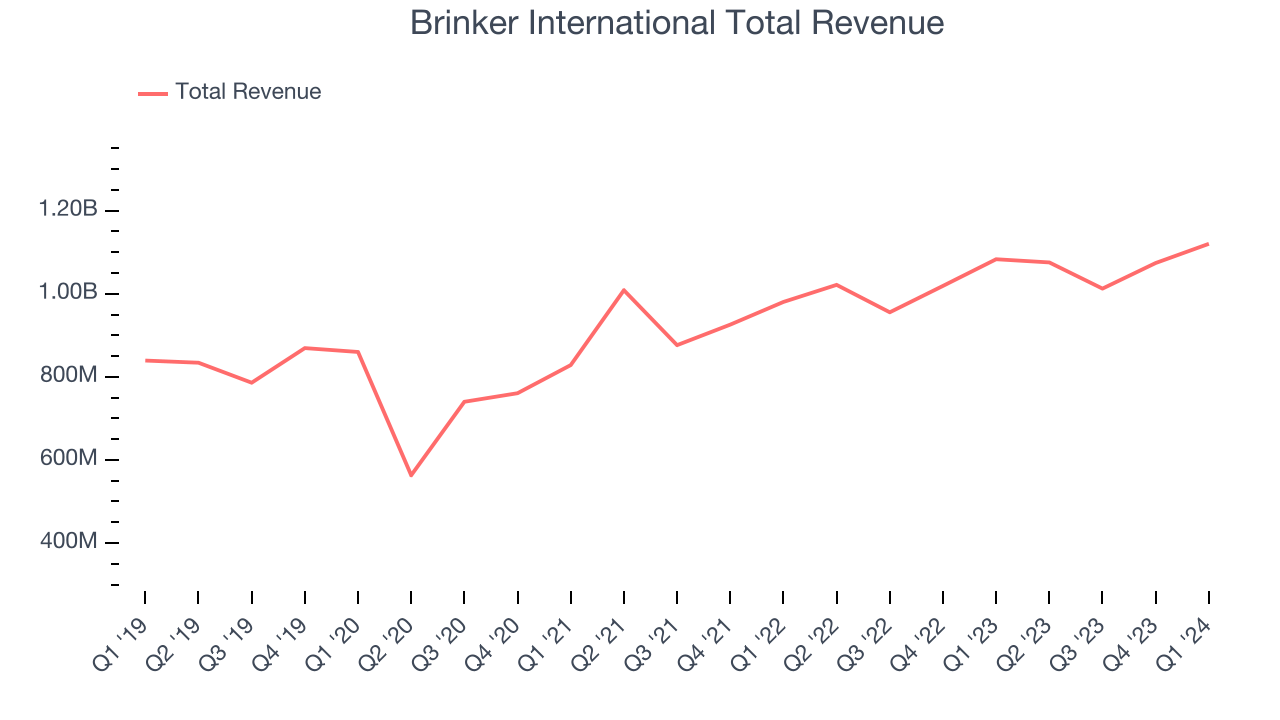
This quarter, Brinker International's revenue grew 3.4% year on year to $1.12 billion, falling short of Wall Street's estimates. Looking ahead, Wall Street expects sales to grow 4% over the next 12 months, an acceleration from this quarter.
Same-Store Sales
Brinker International's demand within its existing restaurants has generally risen over the last two years but lagged behind the broader sector. On average, the company's same-store sales have grown by 6.2% year on year. Given its flat restaurant base over the same period, this performance stems from increased foot traffic or larger order sizes per customer at existing locations.
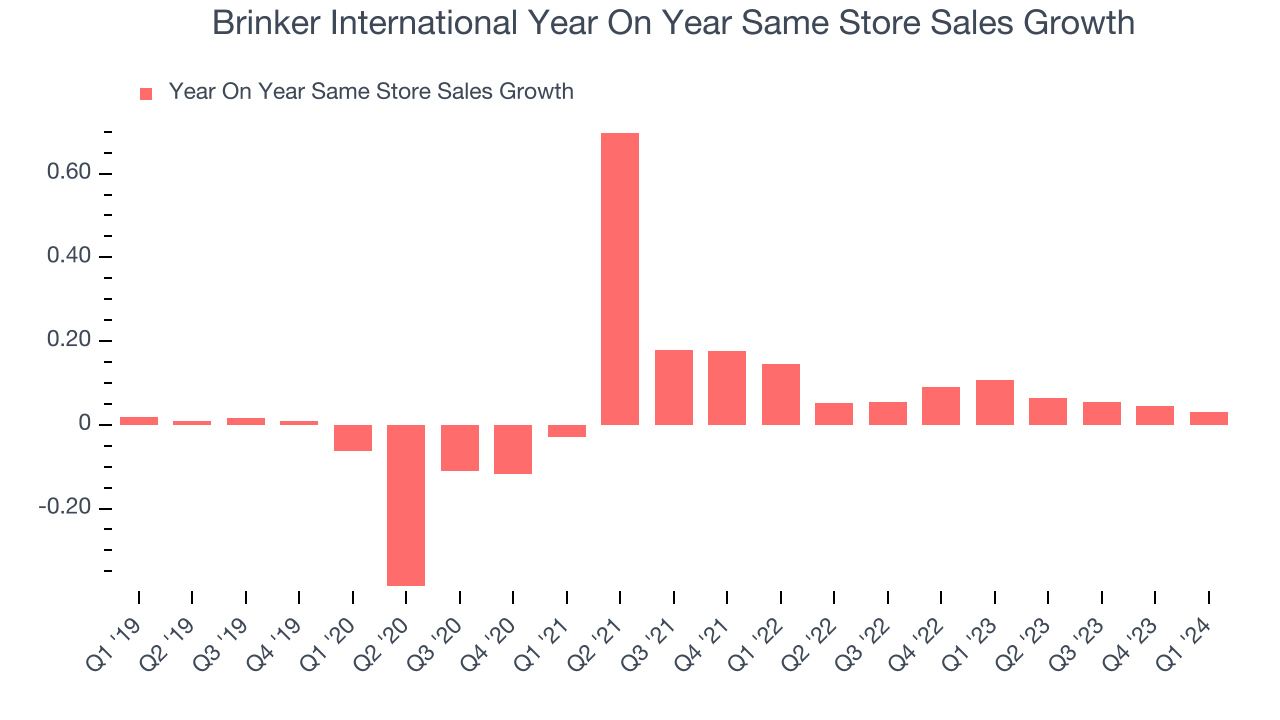
In the latest quarter, Brinker International's same-store sales rose 3% year on year. By the company's standards, this growth was a meaningful deceleration from the 10.7% year-on-year increase it posted 12 months ago. We'll be watching Brinker International closely to see if it can reaccelerate growth.
Number of Stores
A restaurant chain's total number of dining locations is a crucial factor influencing how much it can sell and how quickly company-level sales can grow.
When a chain like Brinker International doesn't open many new restaurants, it usually means there's stable demand for its meals and it's focused on improving operational efficiency to increase profitability. At the end of this quarter, Brinker International operated 1,618 total locations, in line with its restaurant count 12 months ago.
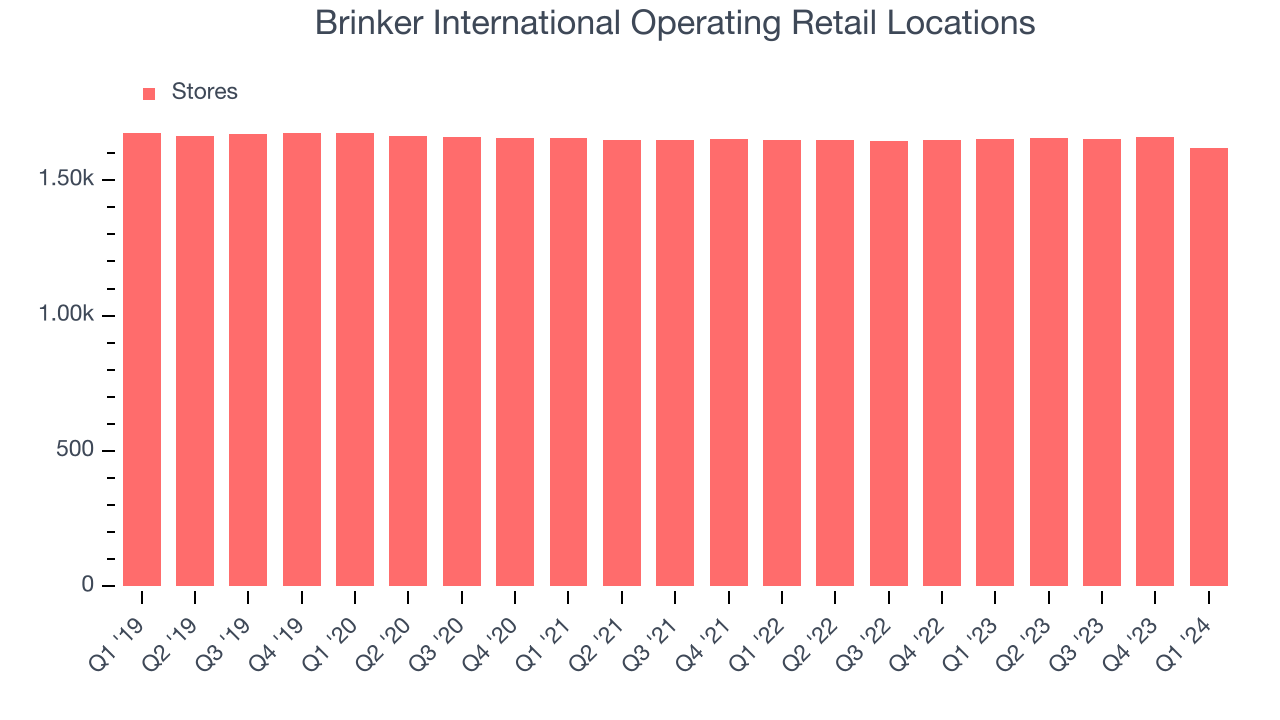
Taking a step back, Brinker International has kept its locations more or less flat over the last two years compared to other restaurant businesses. A flat restaurant base means Brinker International needs to boost foot traffic and turn tables faster at existing restaurants or raise prices to generate revenue growth.
Gross Margin & Pricing Power
We prefer higher gross margins because they make it easier to generate more operating profits.
Brinker International's gross profit margin came in at 15% this quarter. in line with the same quarter last year. This means the company makes $0.13 for every $1 in revenue before accounting for its operating expenses.
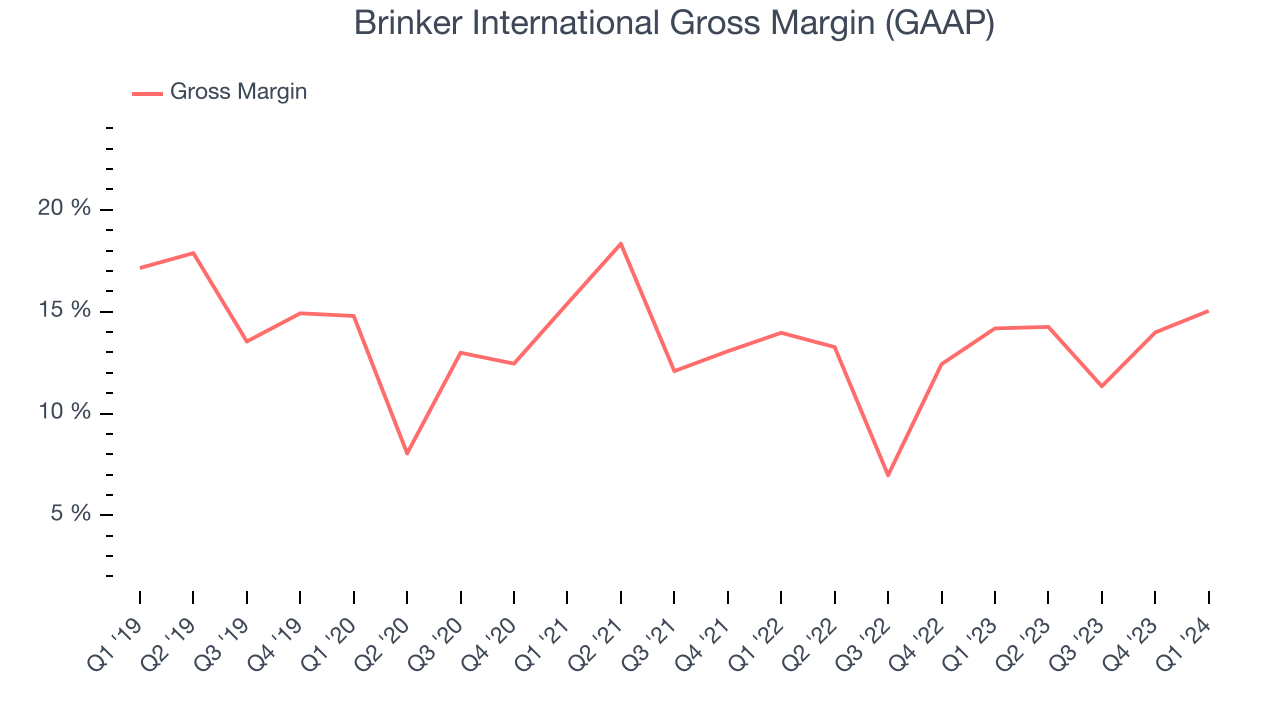
Brinker International has poor unit economics for a restaurant company, leaving it with little room for error if things go awry. As you can see above, it's averaged a 12.8% gross margin over the last two years. Its margin, however, has been trending up over the last 12 months, averaging 22.2% year-on-year increases each quarter. If this trend continues, it could suggest a less competitive environment.
Operating Margin
Operating margin is an important measure of profitability for restaurants as it accounts for all expenses keeping the lights on, including wages, rent, advertising, and other administrative costs.
This quarter, Brinker International generated an operating profit margin of 6.2%, in line with the same quarter last year. This indicates the company's costs have been relatively stable.
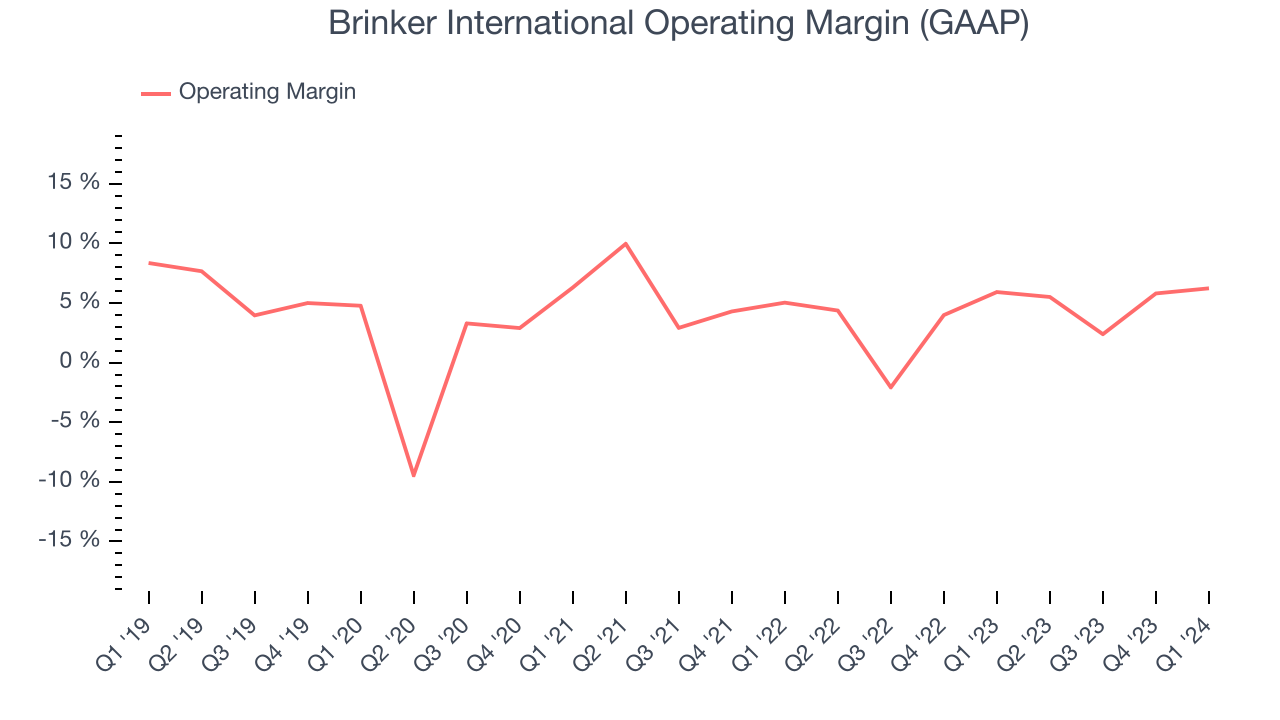 Zooming out, Brinker International was profitable over the last eight quarters but held back by its large expense base. It's demonstrated subpar profitability for a restaurant business, producing an average operating margin of 4.1%. However, Brinker International's margin has improved, on average, by 1.9 percentage points each year, an encouraging sign for shareholders. The tide could be turning.
EPS
Earnings growth is a critical metric to track, but for long-term shareholders, earnings per share (EPS) is more telling because it accounts for dilution and share repurchases.
In Q1, Brinker International reported EPS at $1.24, in line with the same quarter a year ago. This print beat Wall Street's estimates by 8%.
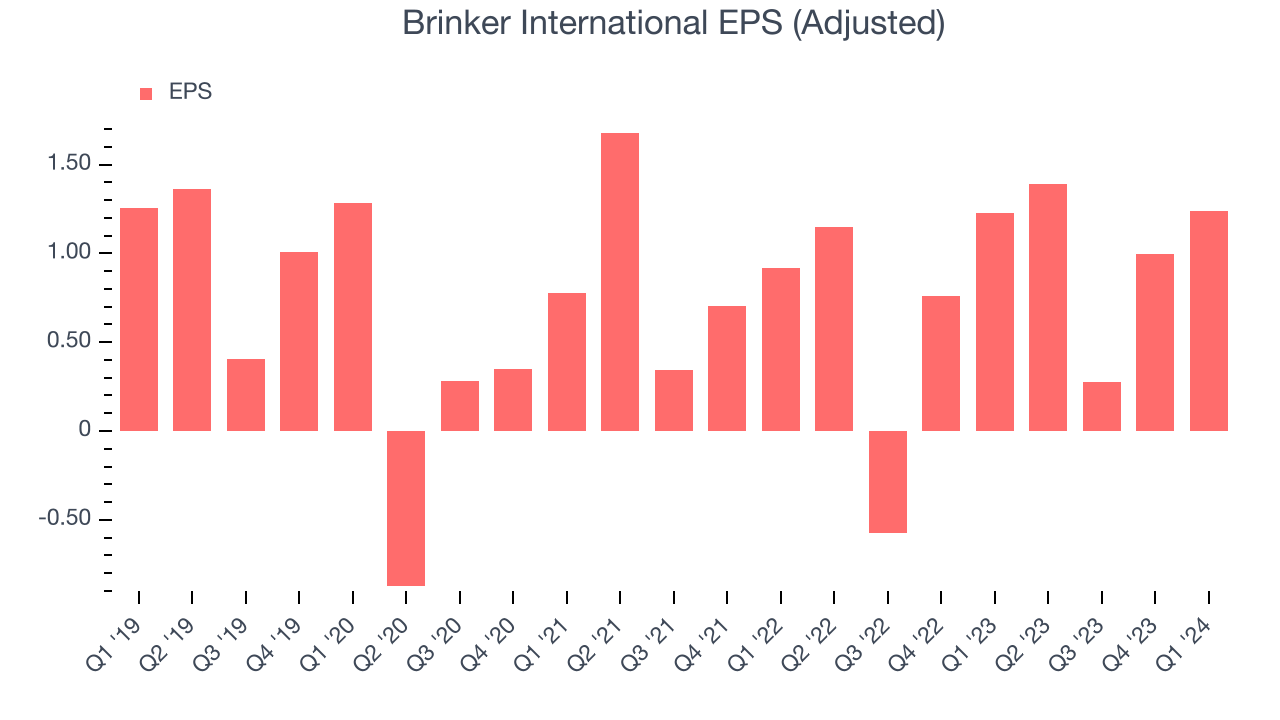
On the bright side, Wall Street expects the company to continue growing earnings over the next 12 months, with analysts projecting an average 4.6% year-on-year increase in EPS.
Cash Is King
Although earnings are undoubtedly valuable for assessing company performance, we believe cash is king because you can't use accounting profits to pay the bills.
Brinker International's free cash flow came in at $78.7 million in Q1, down 14% year on year. This result represents a 7% margin.
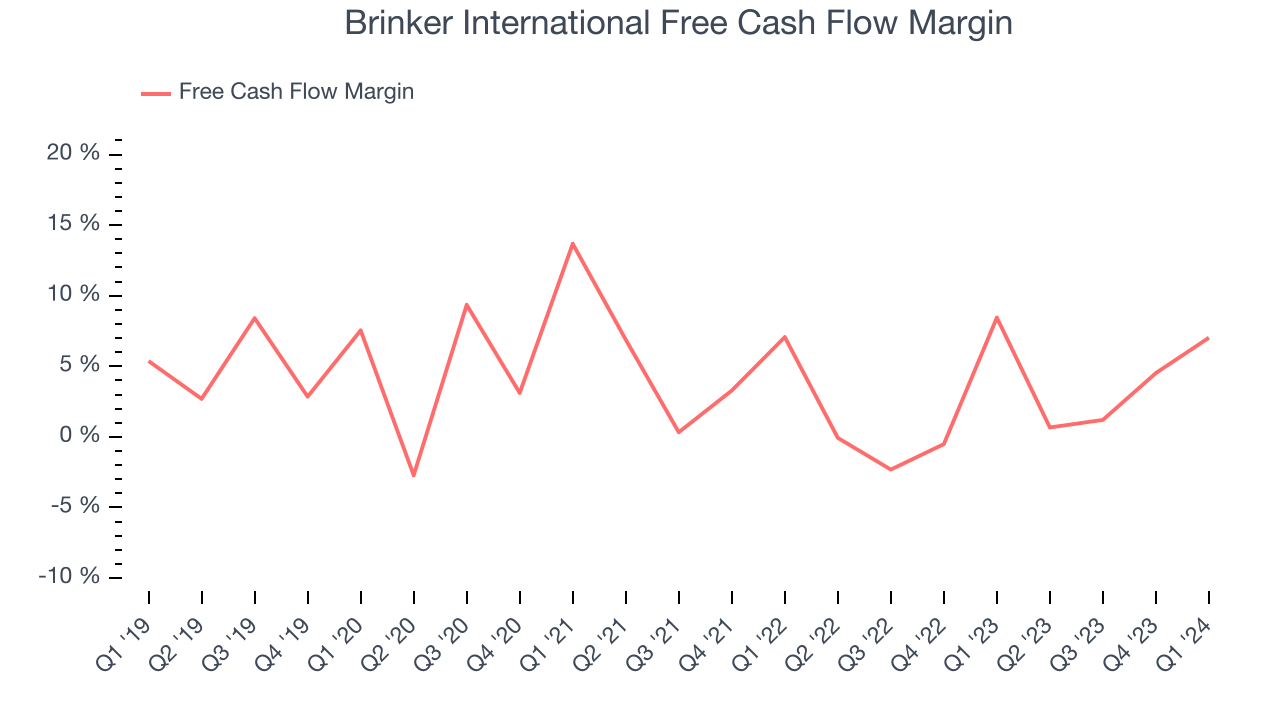
Over the last eight quarters, Brinker International has shown mediocre cash profitability, putting it in a pinch as it gives the company limited opportunities to reinvest, pay down debt, or return capital to shareholders. Its free cash flow margin has averaged 2.5%, subpar for a restaurant business. However, its margin has averaged year-on-year increases of 1.9 percentage points. Continued momentum should improve its cash flow prospects.
Return on Invested Capital (ROIC)
EPS and free cash flow tell us whether a company was profitable while growing revenue. But was it capital-efficient? Enter ROIC, a metric showing how much operating profit a company generates relative to how much money the business raised (debt and equity).
Brinker International's five-year average ROIC was 9.1%, slightly better than the broader sector. Just as you’d like your investment dollars to generate returns, Brinker International's invested capital has produced decent profits.
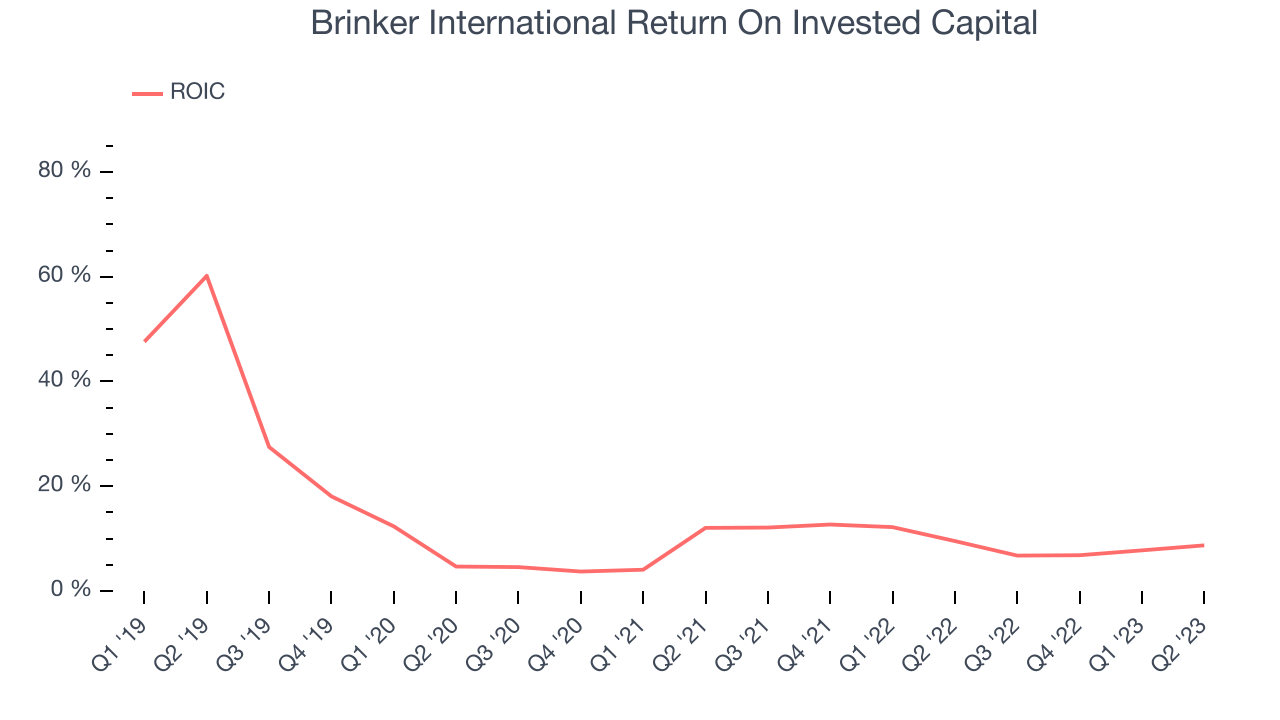
The trend in its ROIC, however, is often what surprises the market and drives the stock price. Over the last few years, Brinker International's ROIC averaged 1.8 percentage point increases. This is a good sign, and we hope the company can continue improving.
Balance Sheet Risk
As long-term investors, the risk we care most about is the permanent loss of capital. This can happen when a company goes bankrupt or raises money from a disadvantaged position and is separate from short-term stock price volatility, which we are much less bothered by.
Brinker International reported $15.5 million of cash and $1.90 billion of debt on its balance sheet in the most recent quarter. As investors in high-quality companies, we primarily focus on two things: 1) that a company's debt level isn't too high and 2) that its interest payments are not excessively burdening the business.
With $416.3 million of EBITDA over the last 12 months, we view Brinker International's 4.5x net-debt-to-EBITDA ratio as safe. We also see its $32 million of annual interest expenses as appropriate. The company's profits give it plenty of breathing room, allowing it to continue investing in new initiatives.
Key Takeaways from Brinker International's Q1 Results
Despite in line same store sales and a slight miss on the revenue line, Brinker International beat analysts' gross margin and EPS expectations this quarter. We were also impressed that the company raised its full-year revenue and earnings guidance, both of which now exceeded Wall Street's estimates. Overall, we think this was a solid quarter that should satisfy shareholders. The stock is flat after reporting and currently trades at $49.9 per share.
Is Now The Time?
Brinker International may have had a good quarter, but investors should also consider its valuation and business qualities when assessing the investment opportunity.
We cheer for all companies serving consumers, but in the case of Brinker International, we'll be cheering from the sidelines. Its revenue growth has been a little slower over the last five years, and analysts expect growth to deteriorate from here. And while its well-known reputation makes consumers more likely to eat at its restaurants, the downside is its gross margins make it more challenging to reach positive operating profits compared to other restaurant businesses. On top of that, its projected EPS for the next year is lacking.
Brinker International's price-to-earnings ratio based on the next 12 months is 12.1x. While there are some things to like about Brinker International and its valuation is reasonable, we think there are better opportunities elsewhere in the market right now.
Wall Street analysts covering the company had a one-year price target of $48.33 per share right before these results (compared to the current share price of $49.90).
To get the best start with StockStory, check out our most recent stock picks, and then sign up to our earnings alerts by adding companies to your watchlist here. We typically have the quarterly earnings results analyzed within seconds of the data being released, and especially for companies reporting pre-market, this often gives investors the chance to react to the results before the market has fully absorbed the information.