
Cosmetics company e.l.f. Beauty (NYSE:ELF) reported Q3 FY2024 results exceeding Wall Street analysts' expectations, with revenue up 84.9% year on year to $270.9 million. The company's full-year revenue guidance of $985 million at the midpoint also came in 6.2% above analysts' estimates. It made a non-GAAP profit of $0.74 per share, improving from its profit of $0.48 per share in the same quarter last year.
e.l.f. (ELF) Q3 FY2024 Highlights:
- Revenue: $270.9 million vs analyst estimates of $238.9 million (13.4% beat)
- EPS (non-GAAP): $0.74 vs analyst estimates of $0.56 (32.7% beat)
- The company lifted its revenue guidance for the full year from $901 million to $985 million at the midpoint, a 9.3% increase
- Free Cash Flow was -$21.65 million, down from $27.07 million in the previous quarter
- Gross Margin (GAAP): 70.8%, up from 67.4% in the same quarter last year
- Market Capitalization: $9.37 billion
e.l.f. Beauty (NYSE:ELF), which stands for ‘eyes, lips, face’, offers high-quality beauty products at accessible price points.
The company was founded in 2004 on a simple but “crazy” idea: sell premium cosmetics over the internet for $1. Today, e.l.f. has expanded its price points and distribution channels. Specifically, e.l.f. offers a wide range of makeup, skincare, and beauty tools such as mascara, face washes, and makeup brushes under its namesake brand.
e.l.f. targets the budget-conscious beauty enthusiast who is likely young and trend-conscious. Since these individuals are more likely to experiment with different looks and buy cosmetics with more frequency and breadth, the company’s affordable prices and trendy products are attractive. e.l.f. prides itself on selling its products at everyday low prices rather than running occasional promotions and sales.
e.l.f. products can be found in various types of retailers and businesses, making them easily accessible. Mass retailers such as Walmart (NYSE:WMT), national drug store chains such as CVS (NYSE:CVS), and beauty specialty stores such as Ulta (NASDAQ:ULTA) all carry e.l.f. Products. Additionally, e.l.f. allows consumers to buy directly from the company and access exclusive deals, beauty tutorials, and product recommendations.
Personal Care
Personal care products include lotions, fragrances, shampoos, cosmetics, and nutritional supplements, among others. While these products may seem more discretionary than food, consumers tend to maintain or even boost their spending on the category during tough times. This phenomenon is known as "the lipstick effect" by economists, which states that consumers still want some semblance of affordable luxuries like beauty and wellness when the economy is sputtering. As with other consumer staples categories, personal care brands must exude quality and be priced optimally given the crowded competitive landscape. Consumer tastes are constantly changing, and personal care companies are currently responding to the public’s increased desire for ethically produced goods by featuring natural ingredients in their products.
Competitors that offer beauty or cosmetics products include Coty (NYSE:COTY), Estee Lauder (NYSE:EL), and L’Oreal (ENXTPA:OR).Sales Growth
e.l.f. is a small consumer staples company, which sometimes brings disadvantages compared to larger competitors benefitting from better brand awareness and economies of scale. On the other hand, one advantage is that its growth rates can be higher because it's growing off a small base.
As you can see below, the company's annualized revenue growth rate of 43.7% over the last three years was incredible for a consumer staples business. Contributing to this is the acquisition of drugstore skincare brand Naturium for $355 million in cash and stock.
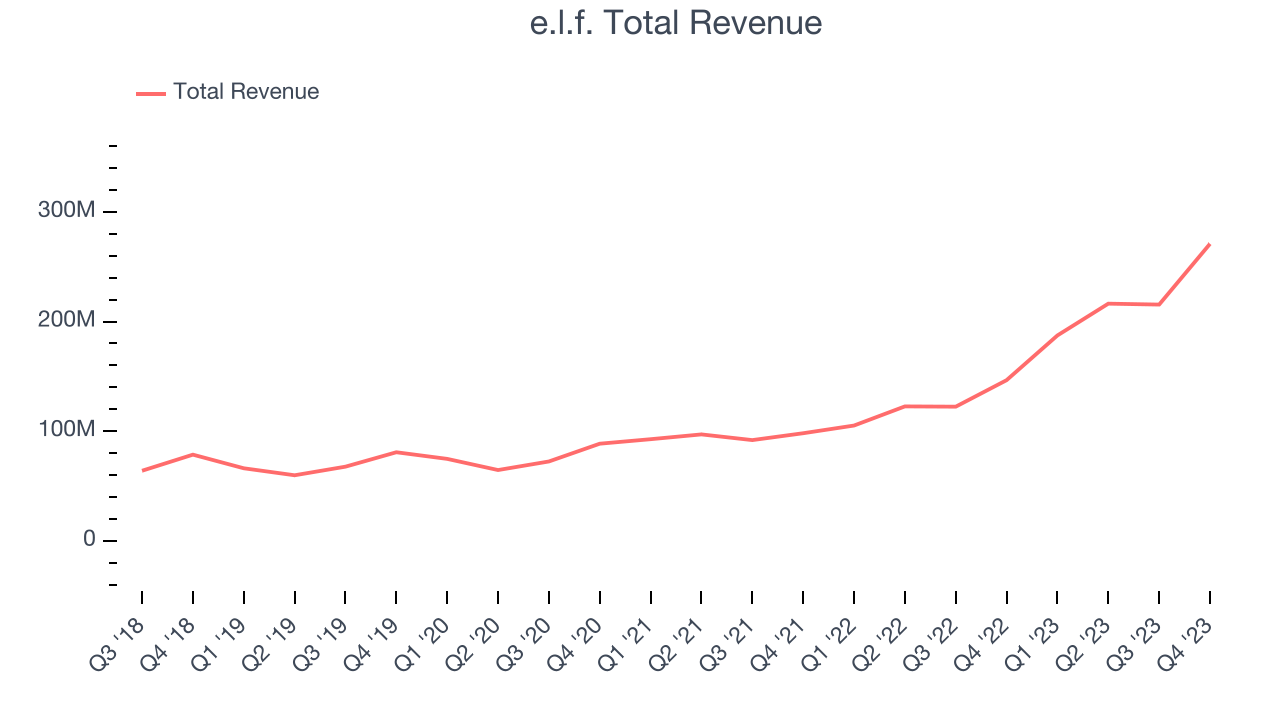
This quarter, e.l.f. reported year-on-year revenue growth of 84.9%, and its $270.9 million in revenue beat Wall Street's estimates by 13.4%. Looking ahead, Wall Street expects sales to grow 23.7% over the next 12 months, a deceleration from this quarter.
Gross Margin & Pricing Power
All else equal, we prefer higher gross margins. They usually indicate that a company sells more differentiated products and commands stronger pricing power.
e.l.f.'s gross profit margin came in at 70.8% this quarter, up 3.5 percentage points year on year. That means for every $1 in revenue, only $0.29 went towards paying for raw materials, production of goods, and distribution expenses. 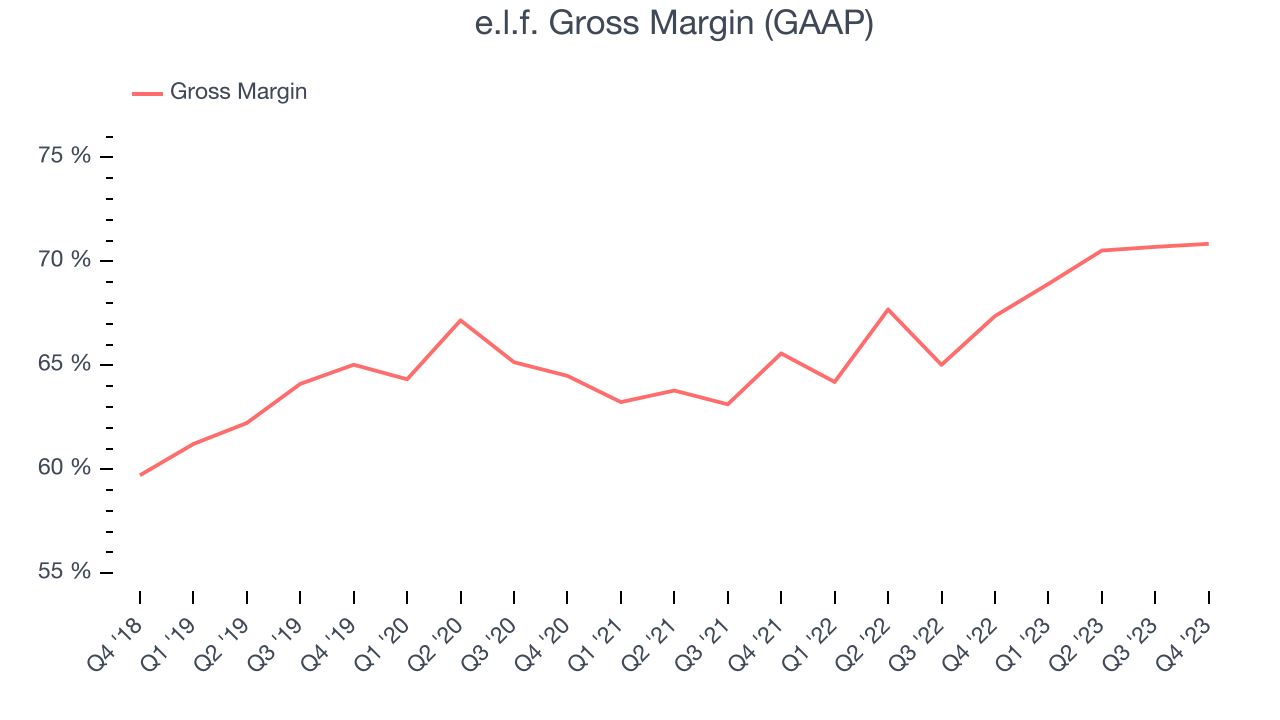
e.l.f. has best-in-class unit economics for a consumer staples company, enabling it to invest in areas such as marketing and talent to stay one step ahead of the competition. As you can see above, it's averaged an exceptional 68.2% gross margin over the last two years. Its margin has also been trending up over the last 12 months, averaging 6.4% year-on-year increases each quarter. If this trend continues, it could suggest a less competitive environment where the company has better pricing power and more favorable input costs (such as raw materials).
Operating Margin
Operating margin is a key profitability metric for companies because it accounts for all expenses enabling a business to operate smoothly, including marketing and advertising, IT systems, wages, and other administrative costs.
In Q3, e.l.f. generated an operating profit margin of 11.8%, down 4.1 percentage points year on year. Conversely, the company's gross margin actually increased, so we can assume the reduction was driven by operational inefficiencies and a step up in discretionary spending in areas like corporate overhead and advertising.
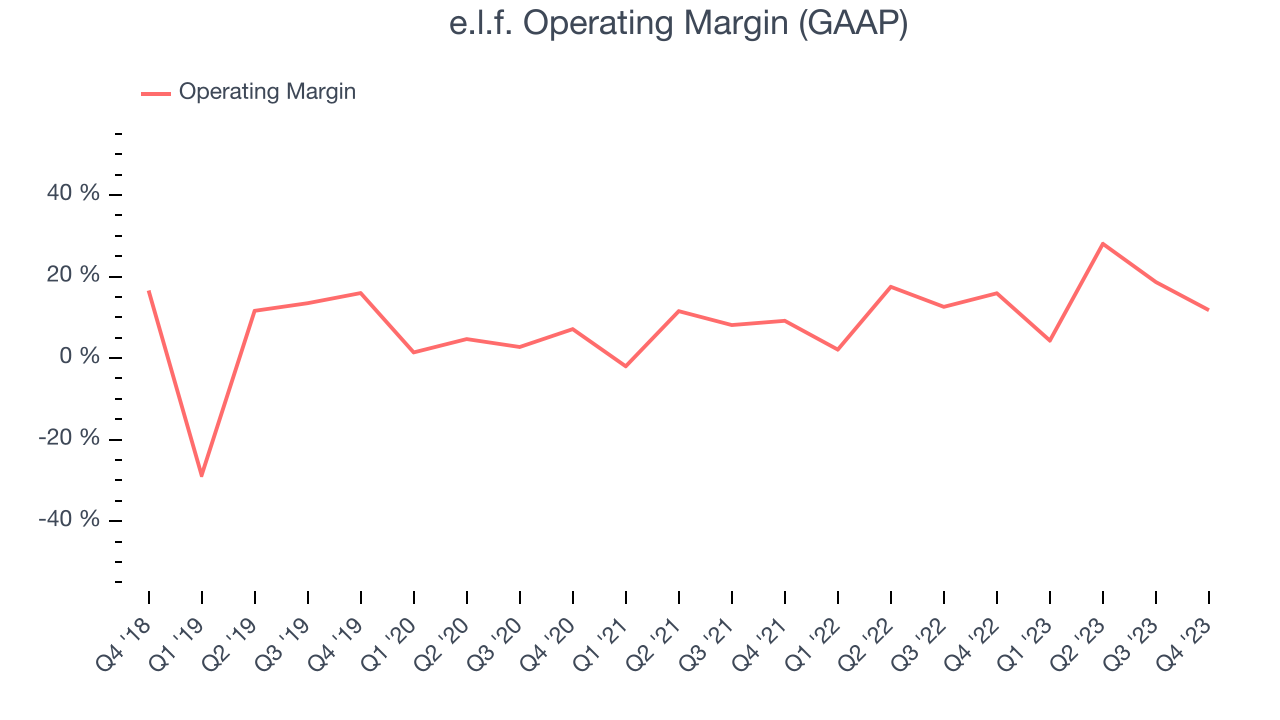 Zooming out, e.l.f. has managed its expenses well over the last two years. It's demonstrated solid profitability for a consumer staples business, producing an average operating margin of 13.8%. On top of that, its margin has improved by 3.3 percentage points on average over the last year, a great sign for shareholders.
 EPS
Earnings growth is a critical metric to track, but for long-term shareholders, earnings per share (EPS) is more telling because it accounts for dilution and share repurchases.
In Q3, e.l.f. reported EPS at $0.74, up from $0.48 in the same quarter a year ago. This print beat Wall Street's estimates by 32.7%.
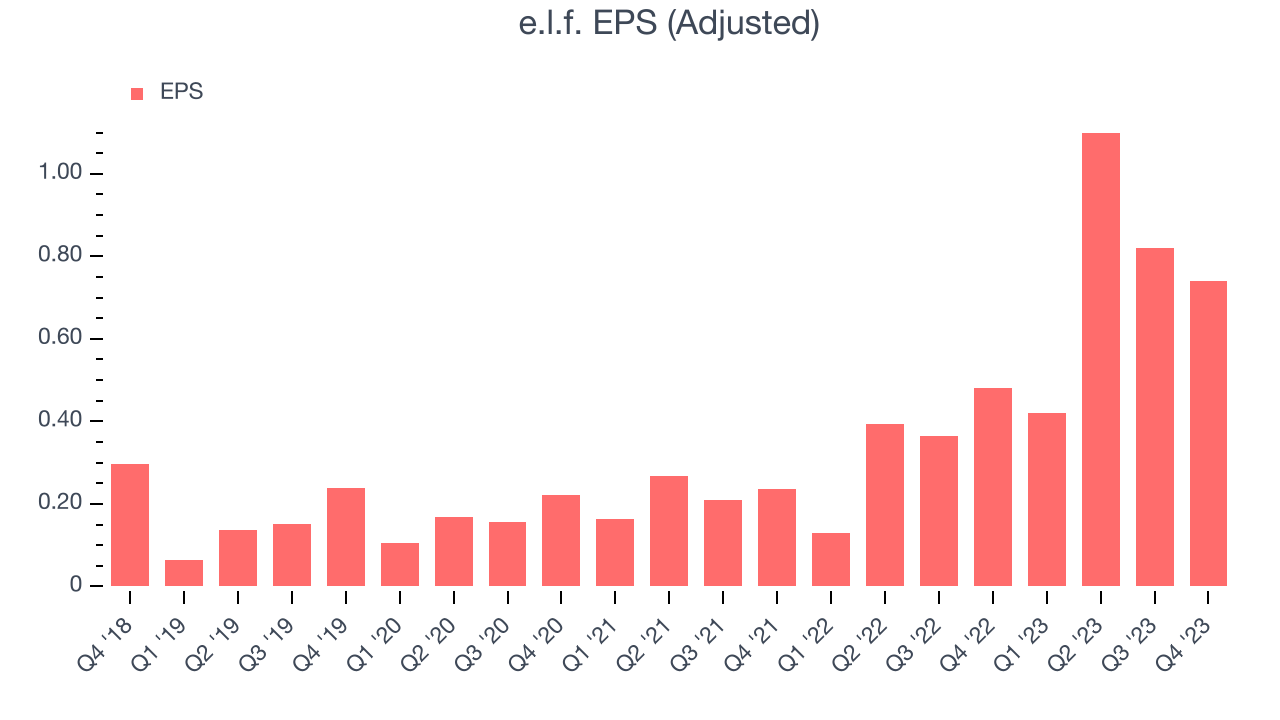
Between FY2021 and FY2024, e.l.f.'s EPS grew 372%, translating into an astounding 67.8% compounded annual growth rate (Natrium acquisition had an impact here too). This growth is materially higher than its revenue growth over the same period, showing that e.l.f. has excelled in managing its expenses.
Over the next 12 months, however, Wall Street is projecting e.l.f.'s EPS to stay flat.
Cash Is King
Although earnings are undoubtedly valuable for assessing company performance, we believe cash is king because you can't use accounting profits to pay the bills.
e.l.f. burned through $21.65 million of cash in Q3, representing a negative 8% free cash flow margin. The company shifted to cash flow negative from cash flow positive in the same quarter last year, which caught our eye as we'd like consumer staples companies to have more consistent performance.
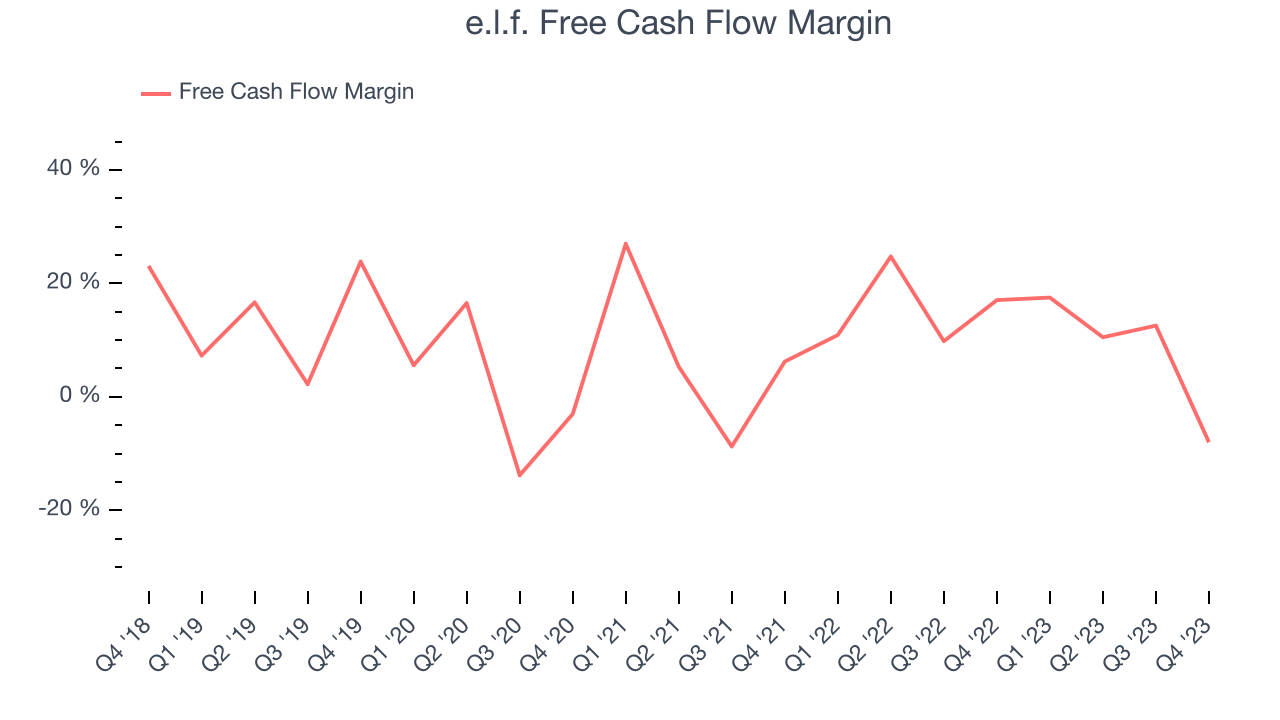
Over the last two years, e.l.f. has shown strong cash profitability, giving it an edge over its competitors and the option to reinvest or return capital to investors while keeping cash on hand for emergencies. The company's free cash flow margin has averaged 11.9%, quite impressive for a consumer staples business. However, its margin has averaged year-on-year declines of 9 percentage points over the last 12 months.
Return on Invested Capital (ROIC)
EPS and free cash flow tell us whether a company's revenue growth was profitable. But was it capital-efficient? If two companies had equal growth, we’d prefer the one with lower reinvestment requirements.
Enter ROIC, a metric showing how much operating profit a company generates relative to its invested capital (debt and equity). ROIC not only gauges the ability to grow profits but also a management team's ability to allocate limited resources.
Although e.l.f. has shown solid business quality lately, it historically did a subpar job investing in profitable growth initiatives. Its five-year average ROIC was 9.7%, somewhat low compared to the best consumer staples companies that consistently pump out 20%+.
The trend in its ROIC, however, is often what surprises the market and drives the stock price. Over the last two years, e.l.f.'s ROIC has averaged a 15 percentage point increase each year. e.l.f.'s rising ROIC is a good sign and could suggest its competitive advantage or profitable investment opportunities are growing.
Key Takeaways from e.l.f.'s Q3 Results
We were impressed by how significantly e.l.f. blew past analysts' revenue expectations this quarter. We were also glad its full-year revenue guidance came in higher than Wall Street's estimates. On the other hand, its operating margin missed analysts' expectations. Overall, we think this was a really good quarter that should please shareholders. The stock is up 1.7% after reporting and currently trades at $176.26 per share.
Is Now The Time?
e.l.f. may have had a good quarter, but investors should also consider its valuation and business qualities when assessing the investment opportunity.
We think e.l.f. is a solid business. First off, its revenue growth has been exceptional over the last three years. And while its subpar brand reputation keeps it from exerting much influence over consumers, its impressive gross margins are a wonderful starting point for the overall profitability of the business. On top of that, its average annual EPS growth over the last three years has been fantastic.
e.l.f.'s price-to-earnings ratio based on the next 12 months is 56.6x. There are definitely things to like about e.l.f., and looking at the consumer staples landscape right now, it seems to be trading at a pretty interesting price.
To get the best start with StockStory, check out our most recent stock picks, and then sign up to our earnings alerts by adding companies to your watchlist here. We typically have the quarterly earnings results analyzed within seconds of the data being released, and especially for companies reporting pre-market, this often gives investors the chance to react to the results before the market has fully absorbed the information.