
Footwear and apparel retailer Foot Locker (NYSE:FL) announced better-than-expected results in Q4 FY2023, with revenue up 2% year on year to $2.38 billion. It made a non-GAAP profit of $0.38 per share, down from its profit of $0.97 per share in the same quarter last year.
Foot Locker (FL) Q4 FY2023 Highlights:
- Revenue: $2.38 billion vs analyst estimates of $2.28 billion (4.6% beat)
- EPS (non-GAAP): $0.38 vs analyst estimates of $0.32 (18.6% beat)
- Guidance for full year EPS (non-GAAP): $1.70 vs analyst estimates of $1.95 (12.8% miss)
- Free Cash Flow of $112 million, down 18.8% from the same quarter last year
- Gross Margin (GAAP): 26.8%, down from 30.2% in the same quarter last year
- Same-Store Sales were down 0.7% year on year
- Store Locations: 2,523 at quarter end, decreasing by 191 over the last 12 months
- Market Capitalization: $3.23 billion
Known for store associates whose uniforms resemble those of referees, Foot Locker (NYSE:FL) is a specialty retailer that sells athletic footwear, clothing, and accessories.
When you walk into a store, there are usually sneakers displayed prominently on the walls and divided into sections such as basketball, running, and lifestyle. The floor may feature displays of the hottest sneakers as well as apparel and accessories such as hats. The average Foot Locker store is roughly 2,500 square feet and located in high-traffic areas such as shopping malls and street-level storefronts. The company also has an active e-commerce presence, established in 1997, that gives customers the option of purchasing their sneakers and apparel online.
The core Foot Locker customer sits at the intersection of athletic and fashion enthusiasm and tends to be under 35. This individual doesn’t just buy athletic footwear for playing sports but is more likely to favor sneakers as a fashion accessory in everyday life.
Over the last few decades, sneakers have grown massively in popularity and cultural impact. Many cite Michael Jordan’s first signature shoe with Nike in the 1980s as the catalyst for sneakers as fashion. Today, there is even an active subculture of ‘sneakerheads’ who will camp outside of Foot Locker stores to ensure access to certain new releases when the store opens on the ‘drop’ date.
Athletic Apparel and Footwear Retailer
Apparel and footwear was once a category thought to be relatively safe from major e-commerce penetration because of the need to try on, touch, and feel products, but the category is now meaningfully transacted online. Everyone still needs clothes and shoes to go outside unless they want some curious (or horrified) looks. But this ongoing digitization is forcing apparel and footwear retailers–that once only had brick-and-mortar stores–to respond with omnichannel offerings. The online shopping experience continues to improve and retail foot traffic in places like shopping malls continues to stagnate, so the evolution of clothing and shoes sellers marches on.
Retailers offering athletic footwear and apparel include Dick’s Sporting Goods (NYSE:DKS), Hibbett (NASDAQ:HIBB), and believe it or not, eBay (NASDAQ:EBAY), which is an active resale marketplace for popular or rare sneakers.Sales Growth
Foot Locker is larger than most consumer retail companies and benefits from economies of scale, giving it an edge over its competitors.
As you can see below, the company's revenue was flat over the last four years (we compare to 2019 to normalize for COVID-19 impacts) as its store count dropped.
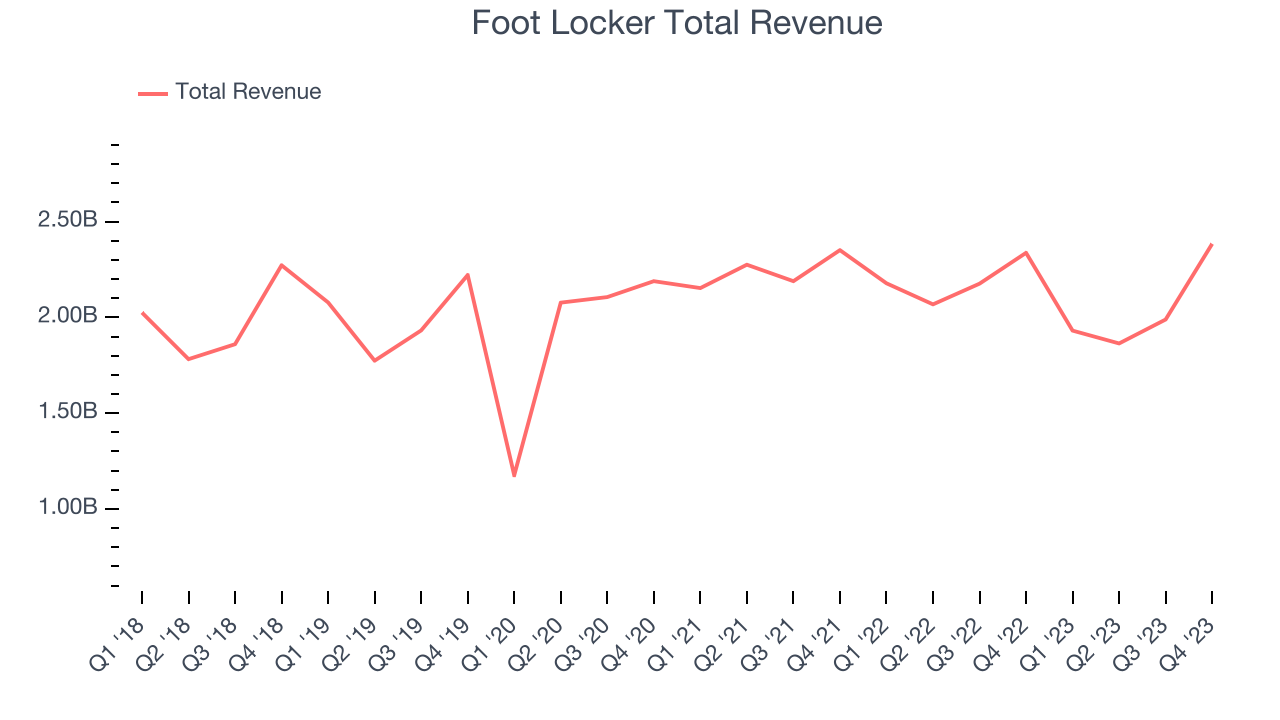
This quarter, Foot Locker reported decent year-on-year revenue growth of 2%, and its $2.38 billion in revenue topped Wall Street's estimates by 4.6%. Looking ahead, Wall Street expects revenue to decline 2% over the next 12 months, a deceleration from this quarter.
Number of Stores
The number of stores a retailer operates is a major determinant of how much it can sell, and its growth is a critical driver of how quickly company-level sales can grow.
When a retailer like Foot Locker is shuttering stores, it usually means that brick-and-mortar demand is less than supply, and the company is responding by closing underperforming locations and possibly shifting sales online. Since last year, Foot Locker's store count shrank by 191 locations, or 7%, to 2,523 total retail locations in the most recently reported quarter.
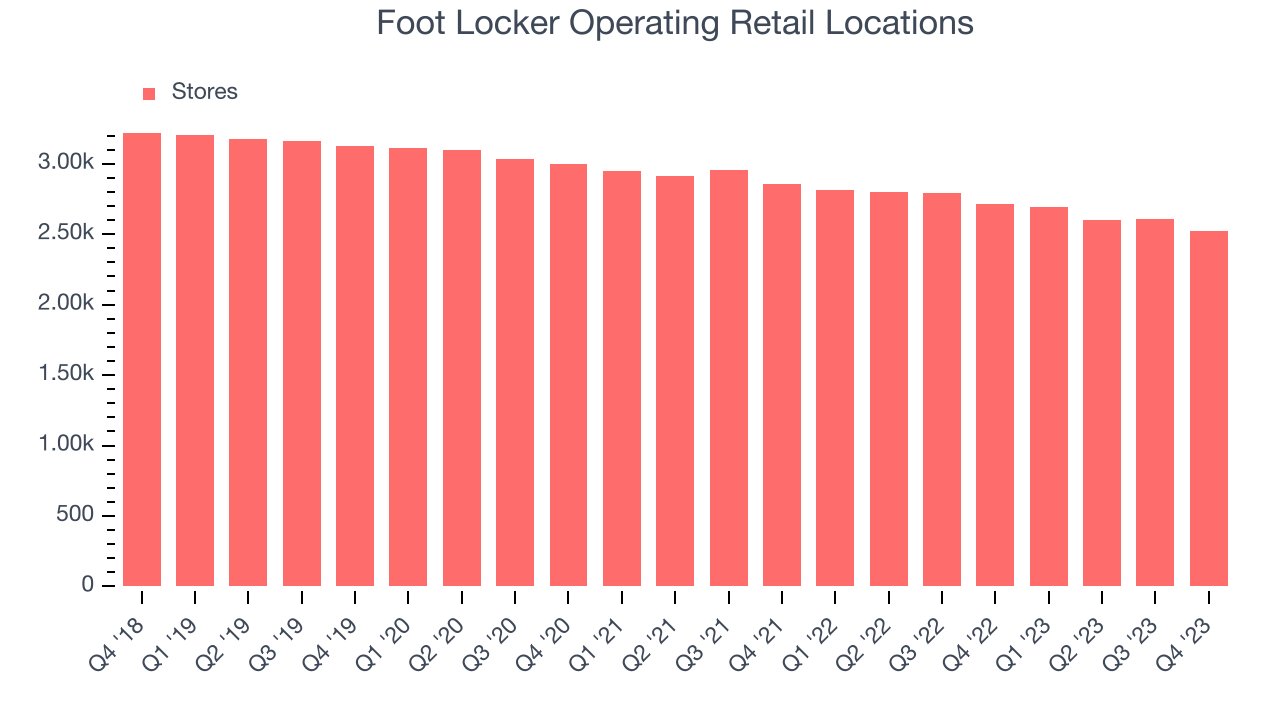
Taking a step back, the company has generally closed its stores over the last two years, averaging a 5.5% annual decline in its physical footprint. A smaller store base means that the company must rely on higher foot traffic and sales per customer at its remaining stores as well as e-commerce sales to fuel revenue growth.
Same-Store Sales
Same-store sales growth is a key performance indicator used to measure organic growth and demand for retailers.
Foot Locker's demand has been shrinking over the last eight quarters, and on average, its same-store sales have declined by 4.3% year on year. The company has been reducing its store count as fewer locations sometimes lead to higher same-store sales, but that hasn't been the case here.
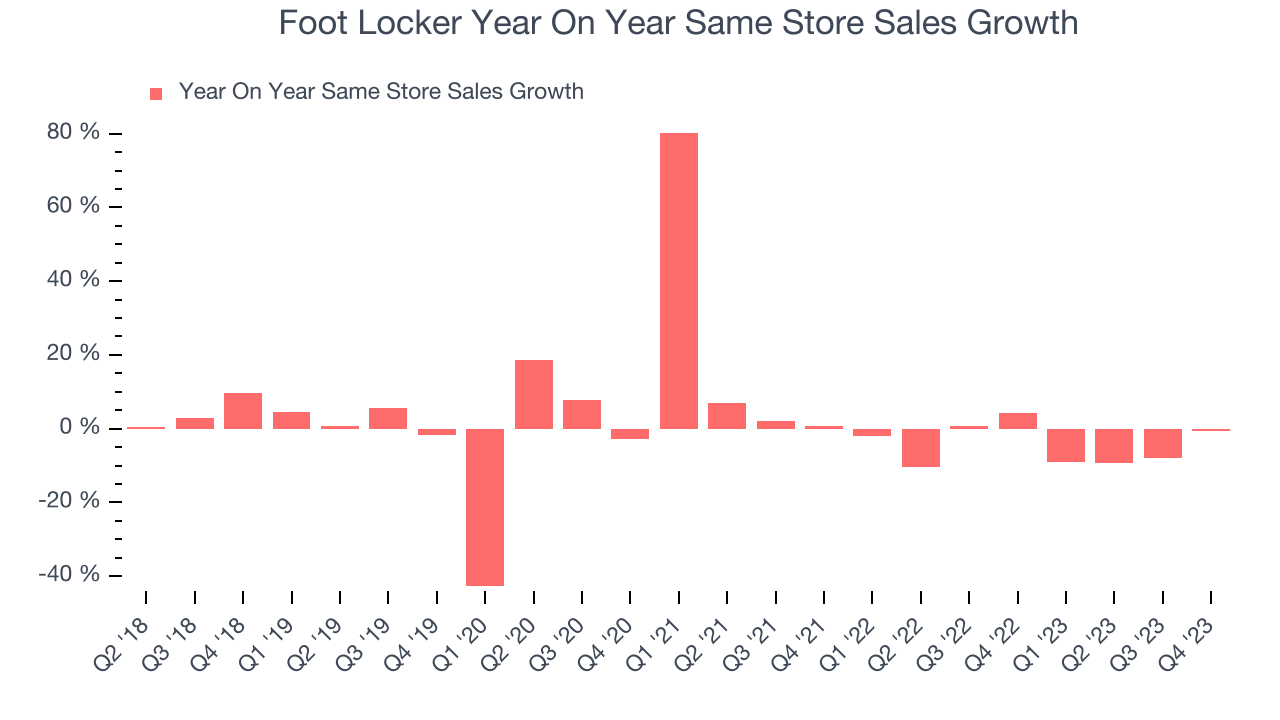
In the latest quarter, Foot Locker's year on year same-store sales were flat. By the company's standards, this growth was a meaningful deceleration from the 4.2% year-on-year increase it posted 12 months ago. We'll be watching Foot Locker closely to see if it can reaccelerate growth.
Gross Margin & Pricing Power
Foot Locker has poor unit economics for a retailer, leaving it with little room for error if things go awry. As you can see below, it's averaged a 30% gross margin over the last two years. This means the company makes $0.30 for every $1 in revenue before accounting for its operating expenses. 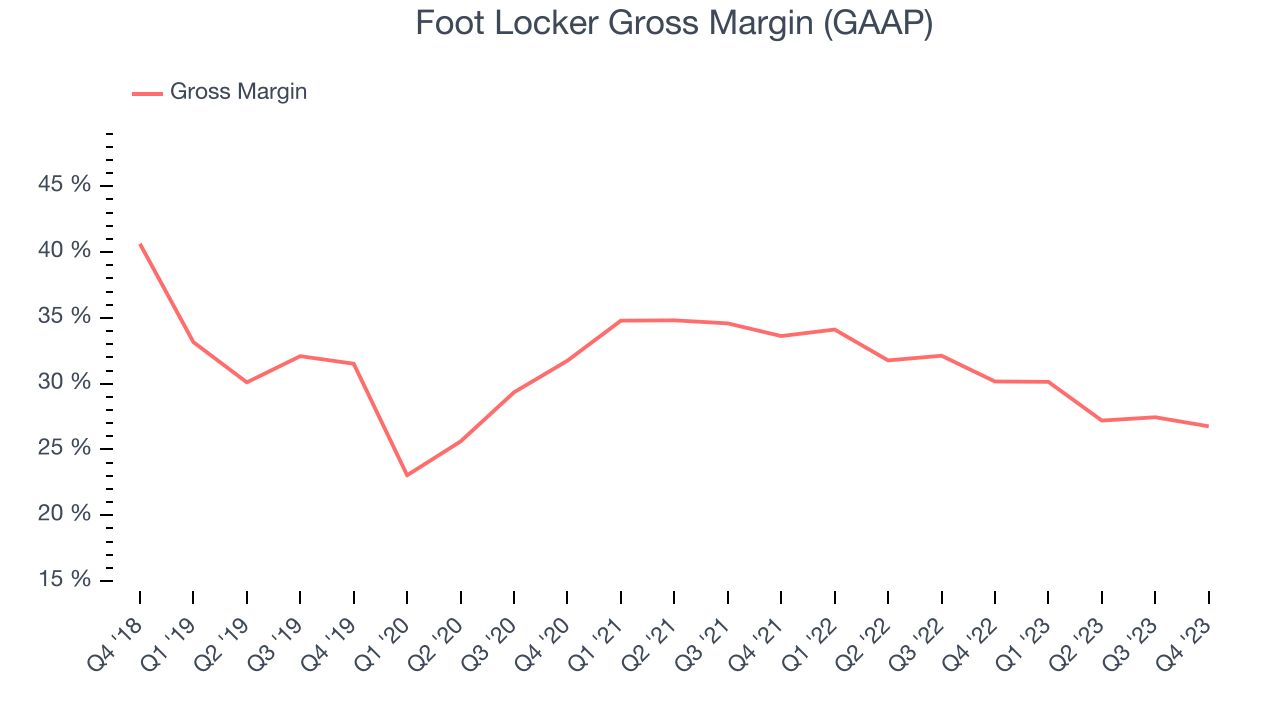
Foot Locker's gross profit margin came in at 26.8% this quarter, marking a 3.4 percentage point decrease from 30.2% in the same quarter last year. Although the company could've performed better, we care more about its long-term trends rather than just one quarter. Additionally, a retailer's gross margin can often change due to factors outside its control, such as product discounting and dynamic input costs (think distribution and freight expenses to move goods). We'll keep a close eye on this.
Operating Margin
Operating margin is an important measure of profitability for retailers as it accounts for all expenses keeping the lights on, including wages, rent, advertising, and other administrative costs.
In Q4, Foot Locker generated an operating profit margin of 1.4%, down 1.1 percentage points year on year. This reduction was driven by weaker pricing power, as indicated by the company's larger drop in gross margin.
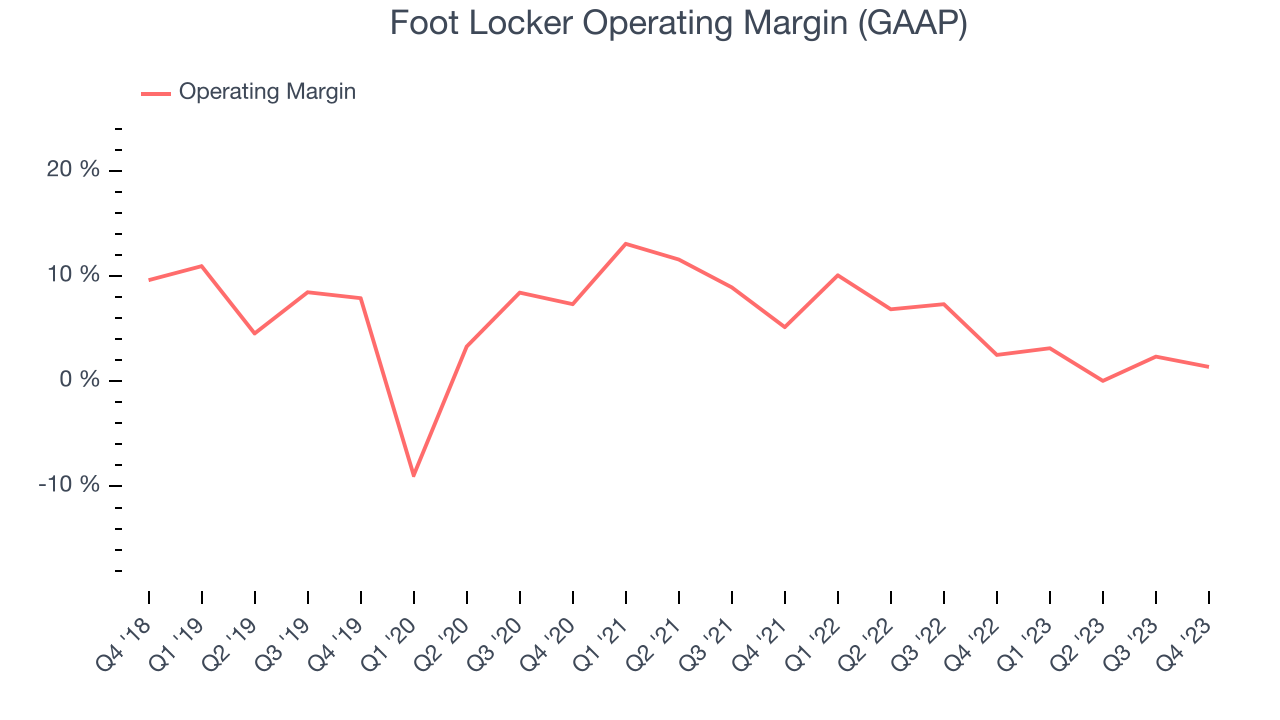 Zooming out, Foot Locker was profitable over the last eight quarters but held back by its large expense base. It's demonstrated subpar profitability for a consumer retail business, producing an average operating margin of 4.3%. On top of that, Foot Locker's margin has declined, on average, by 4.9 percentage points year on year. This shows the company is heading in the wrong direction, and investors were likely hoping for better results.
EPS
Earnings growth is a critical metric to track, but for long-term shareholders, earnings per share (EPS) is more telling because it accounts for dilution and share repurchases.
In Q4, Foot Locker reported EPS at $0.38, down from $0.97 in the same quarter a year ago. This print beat Wall Street's estimates by 18.6%.
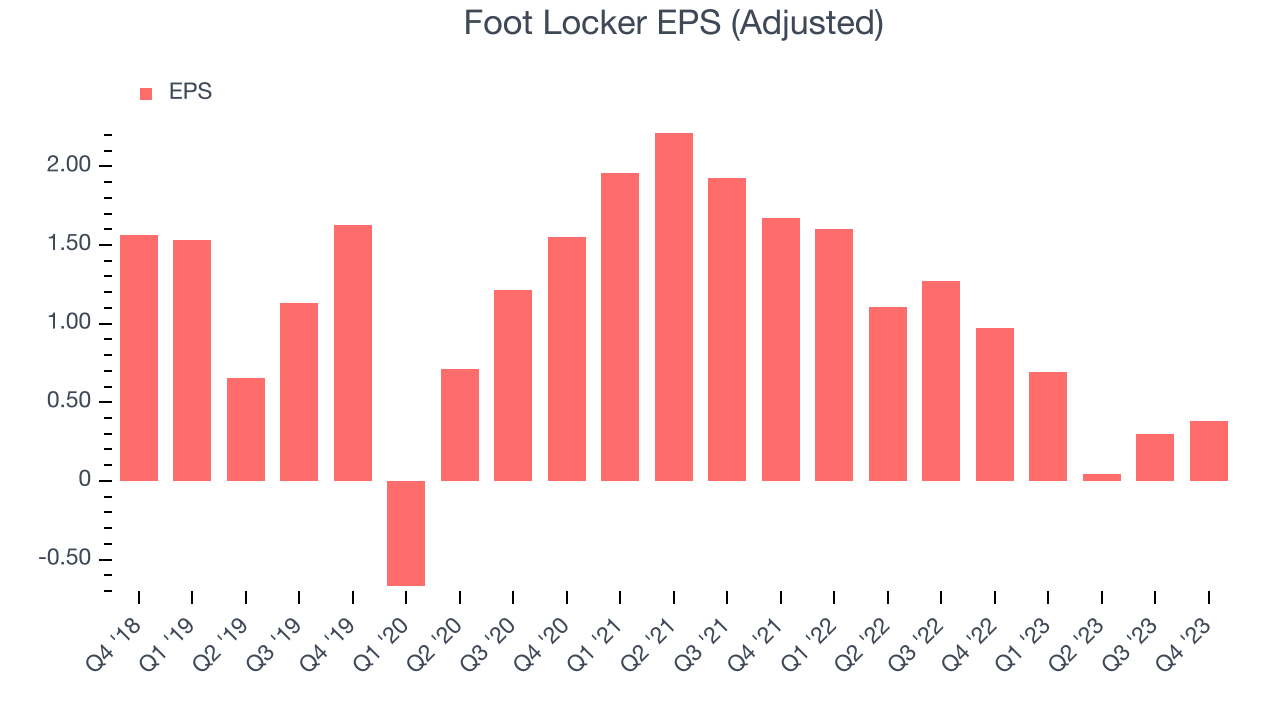
Between FY2019 and FY2023, Foot Locker's adjusted diluted EPS dropped 71.3%, translating into 26.8% annualized declines. In a mature sector such as consumer retail, we tend to steer our readers away from companies with falling EPS. If there's no earnings growth, it's difficult to build confidence in a business's underlying fundamentals, leaving a low margin of safety around the company's valuation (making the stock susceptible to large downward swings).
On the bright side, Wall Street expects the company's earnings to grow over the next 12 months, with analysts projecting an average 38.6% year-on-year increase in EPS.
Cash Is King
Although earnings are undoubtedly valuable for assessing company performance, we believe cash is king because you can't use accounting profits to pay the bills.
Foot Locker's free cash flow came in at $112 million in Q4, down 18.8% year on year. This result represents a 4.7% margin.
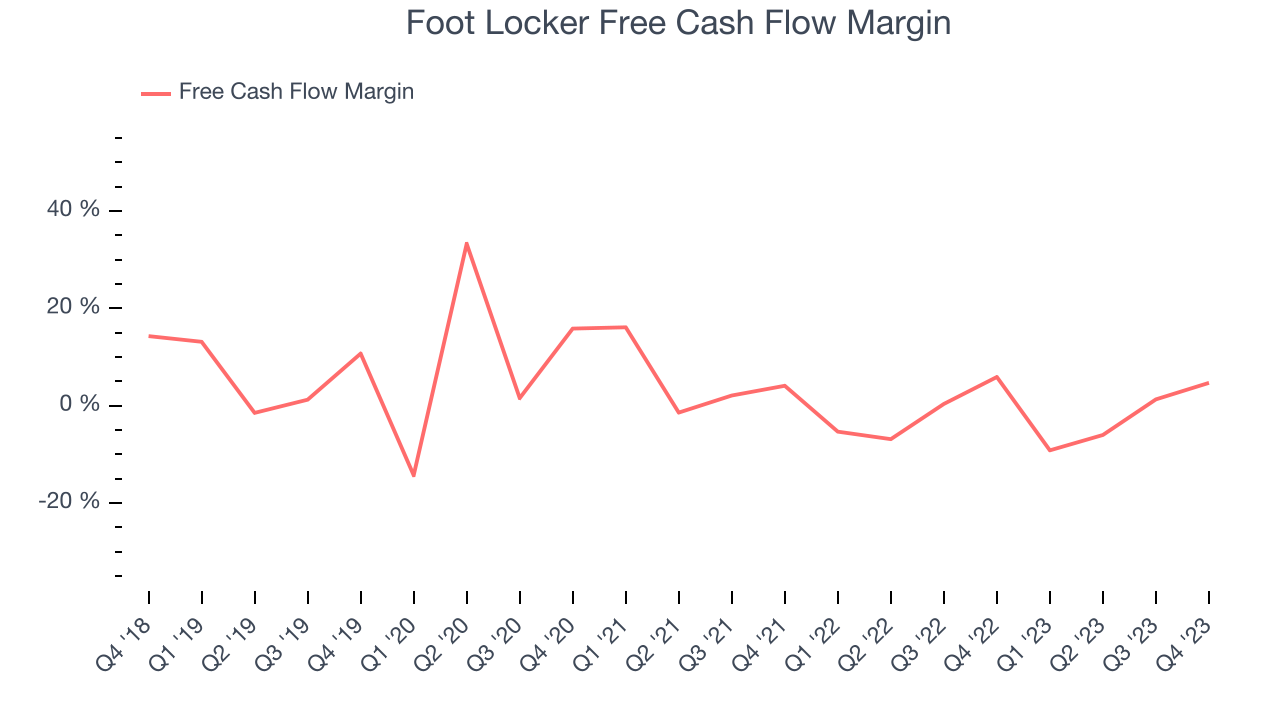
While Foot Locker posted positive free cash flow this quarter, the broader story hasn't been so clean. Over the last two years, Foot Locker's capital-intensive business model and demanding reinvestment strategy have consumed many company resources. Its free cash flow margin has averaged negative 1.6%, weak for a consumer retail business. Investors are likely hoping for consistent free cash flow generation in the future.
Return on Invested Capital (ROIC)
EPS and free cash flow tell us whether a company was profitable while growing revenue. But was it capital-efficient? A company’s ROIC explains this by showing how much operating profit a company makes compared to how much money the business raised (debt and equity).
Foot Locker's five-year average ROIC was 6.7%, somewhat low compared to the best retail companies that consistently pump out 25%+. Its returns suggest it historically did a subpar job investing in profitable business initiatives.
The trend in its ROIC, however, is often what surprises the market and drives the stock price. Unfortunately, Foot Locker's ROIC has stayed the same over the last two years. If the company wants to become an investable business, it will need to increase its returns.
Key Takeaways from Foot Locker's Q4 Results
We liked how revenue and EPS outperformed Wall Street's estimates. On the other hand, its full-year earnings forecast missed analysts' expectations by a large amount, and this is dragging the stock down. The stock is down 18.7% after reporting, trading at $27.9 per share.
Is Now The Time?
Foot Locker may have had a favorable quarter, but investors should also consider its valuation and business qualities when assessing the investment opportunity.
We cheer for all companies serving consumers, but in the case of Foot Locker, we'll be cheering from the sidelines. Its revenue growth has been weak over the last four years, and analysts expect growth to deteriorate from here. And while its projected EPS for the next year implies the company's fundamentals will improve, the downside is its declining EPS over the last four years makes it hard to trust. On top of that, its declining physical locations suggests its demand is falling.
Foot Locker's price-to-earnings ratio based on the next 12 months is 17.4x. While we've no doubt one can find things to like about Foot Locker, we think there are better opportunities elsewhere in the market. We don't see many reasons to get involved at the moment.
Wall Street analysts covering the company had a one-year price target of $26.20 per share right before these results (compared to the current share price of $27.90), implying they didn't see much short-term potential in Foot Locker.
To get the best start with StockStory, check out our most recent stock picks, and then sign up to our earnings alerts by adding companies to your watchlist here. We typically have the quarterly earnings results analyzed within seconds of the data being released, and especially for companies reporting pre-market, this often gives investors the chance to react to the results before the market has fully absorbed the information.