
North American amusement park operator Cedar Fair (NYSE:FUN) reported Q3 CY2023 results exceeding Wall Street analysts' expectations, with revenue flat year on year at $842 million. It made a non-GAAP profit of $4.21 per share, down from its profit of $5.86 per share in the same quarter last year.
Cedar Fair (FUN) Q3 CY2023 Highlights:
- Revenue: $842 million vs analyst estimates of $822 million (2.4% beat)
- EPS (non-GAAP): $4.21 vs analyst estimates of $3.75 (12.2% beat)
- Gross Margin (GAAP): 55.9%, up from 53% in the same quarter last year
- Free Cash Flow of $271.8 million, up from $50.48 million in the previous quarter
- Visitors: 12.43 million
- Market Capitalization: $2.1 billion
Originally a lakeside resort, Cedar Fair (NYSE:FUN) operates amusement parks and resorts, delivering thrilling experiences and family entertainment across North America.
Cedar Fair started on the shores of Lake Erie as a leisure destination. Recognizing the potential for larger-scale entertainment, Cedar Fair transitioned from a simple bathing resort to a full-fledged amusement park. The company's goal was to create a destination for visitors distinct from their daily routines.
Today, Cedar Fair's portfolio includes large themed areas, roller coasters, water attractions, live performances, and seasonal events. Each park offers settings of fantasy and adventure, aiming to provide lasting memories for visitors.
Cedar Fair's largest source of revenue stems from gate admissions, followed by in-park spending on food, merchandise, and games. Its annual pass programs and onsite resorts provide additional avenues of income.
In November 2023, Cedar Fair announced it would merge with Six Flags (NYSE:SIX), another scaled theme park operator. According to the press release, Cedar Fair shareholders will own ~51.2% of the combined company while Six Flags shareholders will own ~48.8%. The combined entity will be renamed to Six Flags and will trade under the ticker symbol NYSE:FUN. The deal is expected to close in June 2024 and was valued at $8 billion.
Leisure Facilities
Leisure facilities companies often sell experiences rather than tangible products, and in the last decade-plus, consumers have slowly shifted their spending from "things" to "experiences". Leisure facilities seek to benefit but must innovate to do so because of the industry's high competition and capital intensity.
Theme park competitors of Cedar Fair include SeaWorld (NYSE:SEAS) and Disney (NYSE:DIS) while indirect competitors include other entertainment venues such as TopGolf Callaway (NYSE:MODG) and Bowlero (NYSE:BOWL).Sales Growth
Examining a company's long-term performance can provide clues about its business quality. Any business can put up a good quarter or two, but the best consistently grow over the long haul. Cedar Fair's annualized revenue growth rate of 6.2% over the last five years was weak for a consumer discretionary business. 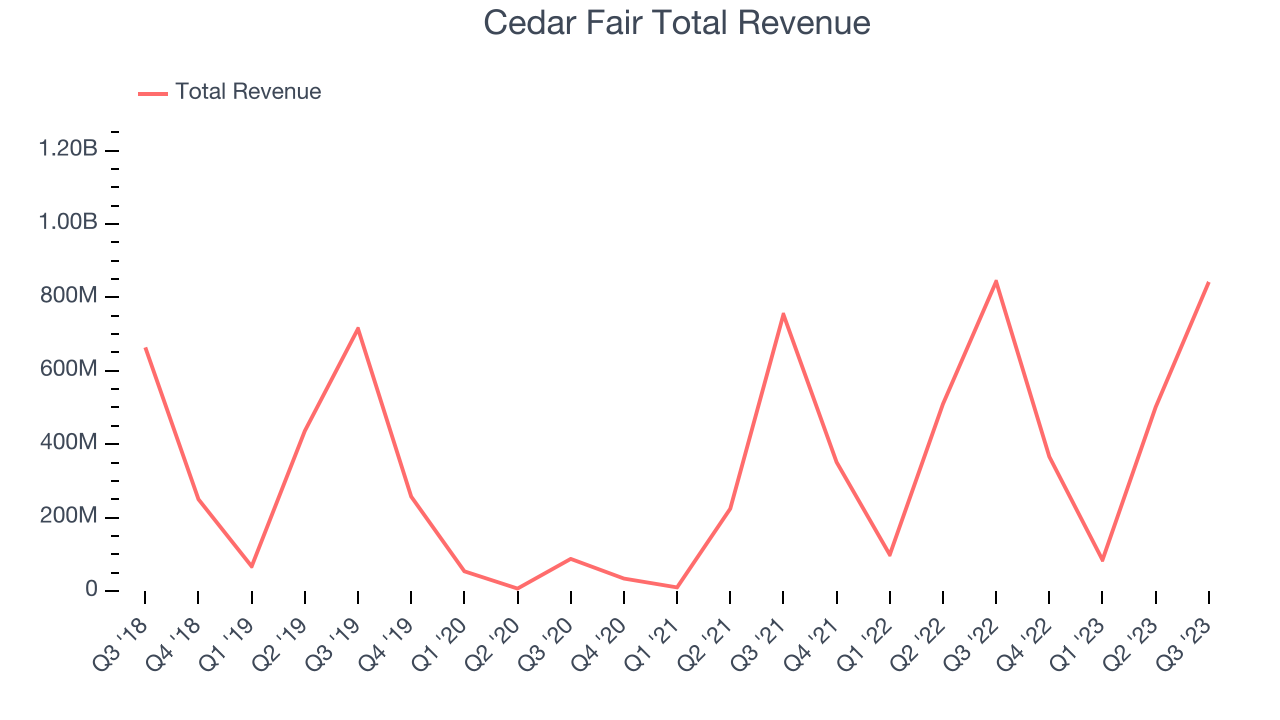 Within consumer discretionary, product cycles are short and revenue can be hit-driven due to rapidly changing trends. That's why we also follow short-term performance. Cedar Fair's annualized revenue growth of 32.5% over the last two years is above its five-year trend, suggesting some bright spots.
We can better understand the company's revenue dynamics by analyzing its number of visitors, which reached 12.43 million in the latest quarter. Over the last two years, Cedar Fair's visitors grew massively as COVID impacted its base year numbers. 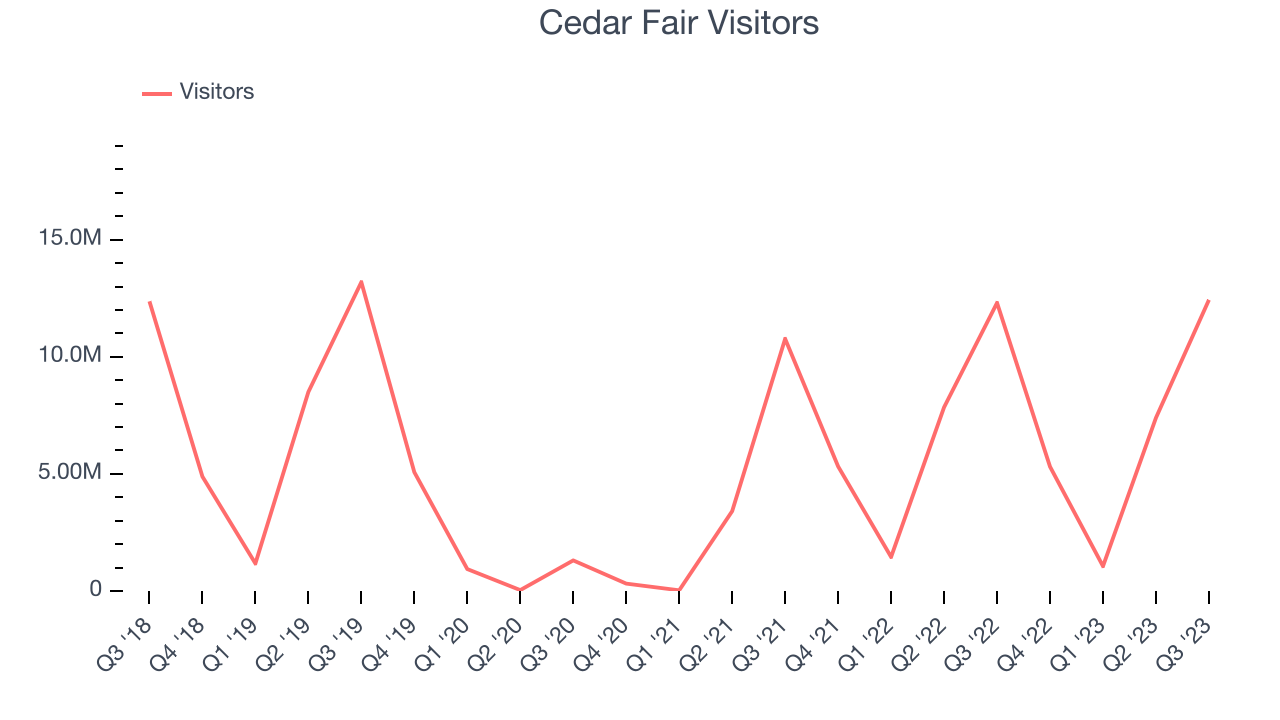
This quarter, Cedar Fair's $842 million of revenue was flat year on year but beat Wall Street's estimates by 2.4%. Looking ahead, Wall Street expects sales to grow 4.6% over the next 12 months, an acceleration from this quarter.
Operating Margin
Operating margin is a key measure of profitability. Think of it as net income–the bottom line–excluding the impact of taxes and interest on debt, which are less connected to business fundamentals.
Cedar Fair has been a well-oiled machine over the last two years. It's demonstrated elite profitability for a consumer discretionary business, boasting an average operating margin of 23%.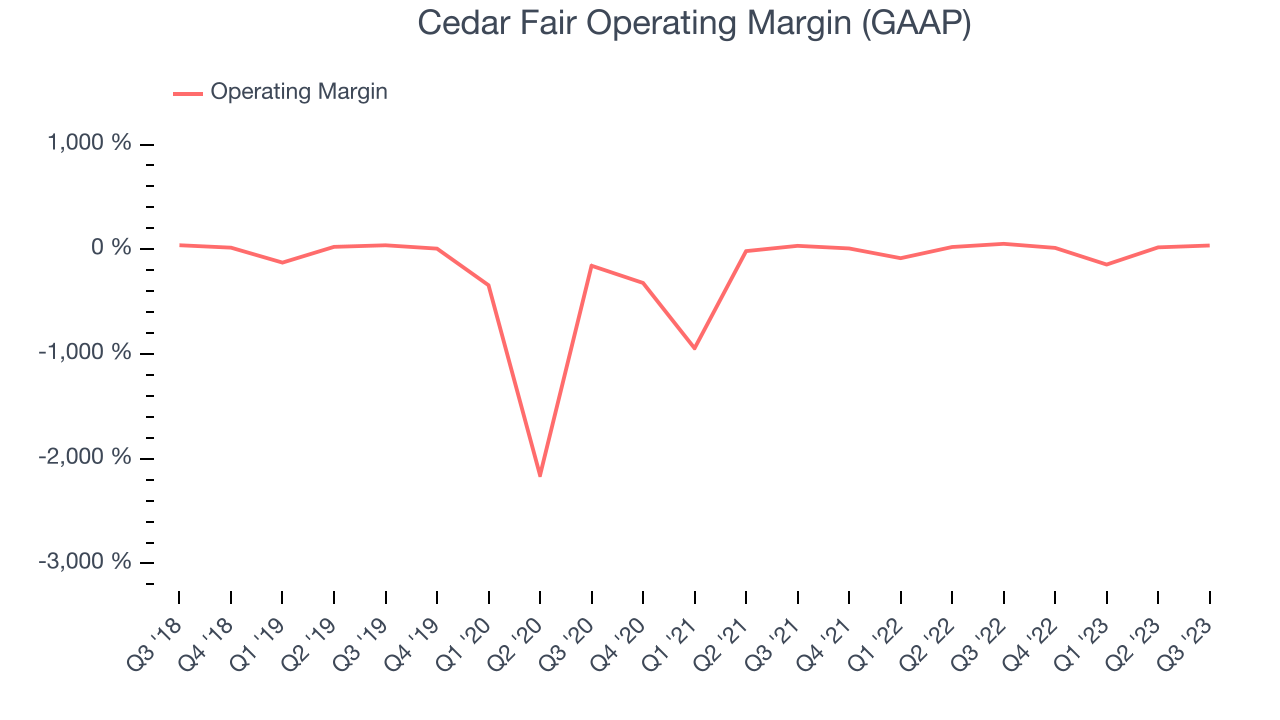
This quarter, Cedar Fair generated an operating profit margin of 36.4%, down 16 percentage points year on year.
Over the next 12 months, Wall Street expects Cedar Fair to become more profitable. Analysts are expecting the company’s LTM operating margin of 18.2% to rise to 19.4%.EPS
Analyzing long-term revenue trends tells us about a company's historical growth, but the long-term change in its earnings per share (EPS) points to the profitability and efficiency of that growth–for example, a company could inflate its sales through excessive spending on advertising and promotions. 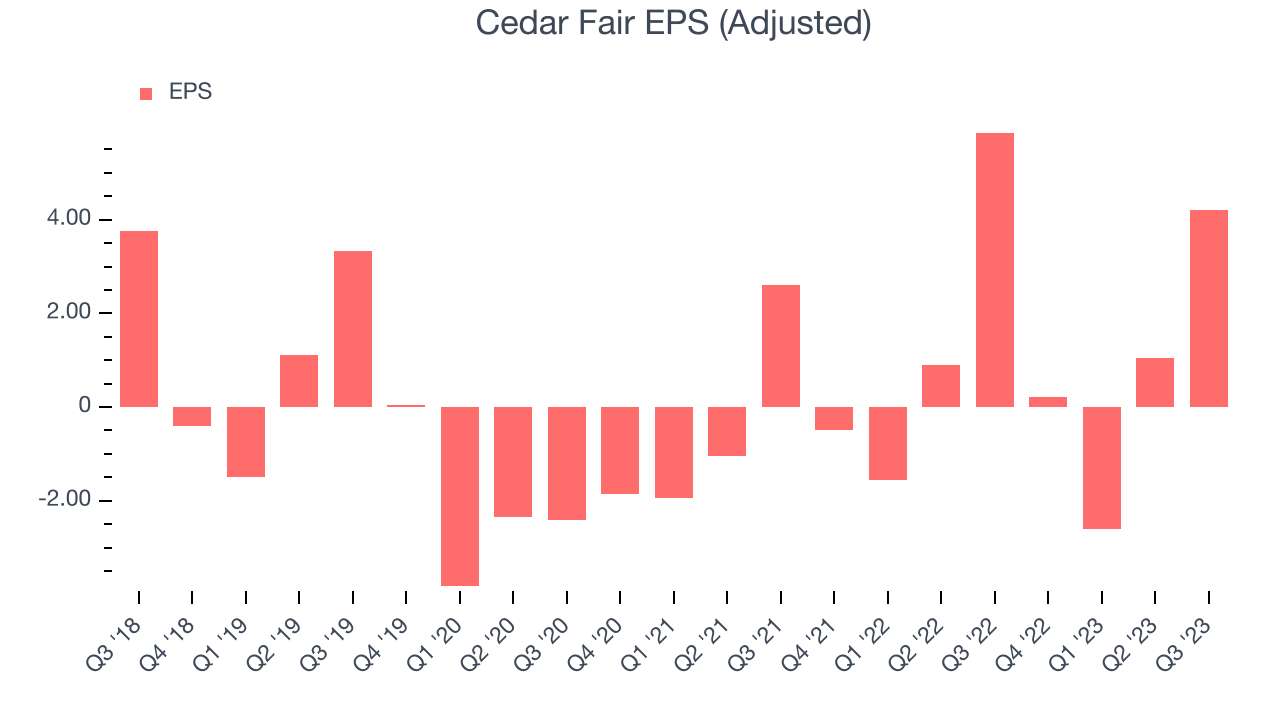
Over the last five years, Cedar Fair's EPS dropped 25.1%, translating into 4.6% annualized declines. Luckily, Cedar Fair has bucked its trend as of late, growing its EPS over the last three years. We'll see if the company can maintain its growth.
In Q3, Cedar Fair reported EPS at $4.21, down from $5.86 in the same quarter a year ago. This print beat analysts' estimates by 12.2%. Over the next 12 months, Wall Street expects Cedar Fair to grow its earnings. Analysts are projecting its LTM EPS of $2.86 to climb by 16.1% to $3.33.
Cash Is King
If you've followed StockStory for a while, you know we emphasize free cash flow. Why, you ask? We believe that in the end, cash is king, and you can't use accounting profits to pay the bills.
Over the last two years, Cedar Fair has shown mediocre cash profitability, putting it in a pinch as it gives the company limited opportunities to reinvest, pay down debt, or return capital to shareholders. Its free cash flow margin has averaged 9.4%, subpar for a consumer discretionary business.
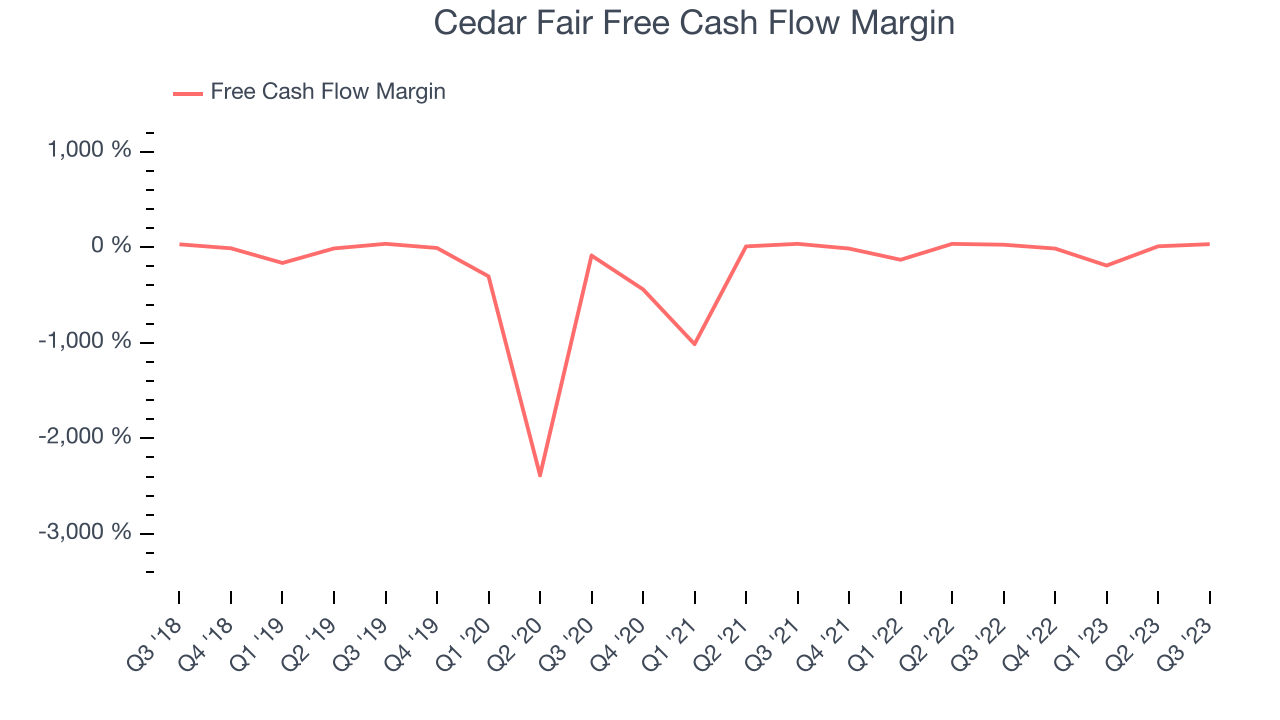
Cedar Fair's free cash flow came in at $271.8 million in Q3, equivalent to a 32.3% margin and up 21.4% year on year. Over the next year, analysts predict Cedar Fair's cash profitability will improve. Their consensus estimates imply its LTM free cash flow margin of 6.2% will increase to 9.8%.
Return on Invested Capital (ROIC)
EPS and free cash flow tell us whether a company was profitable while growing revenue. But was it capital-efficient? Enter ROIC, a metric showing how much operating profit a company generates relative to how much money the business raised (debt and equity).
Although Cedar Fair has shown solid business quality lately, it historically did a subpar job investing in profitable business initiatives. Its five-year average return on invested capital was 8.8%, somewhat low compared to the best consumer discretionary companies that pump out 25%+.
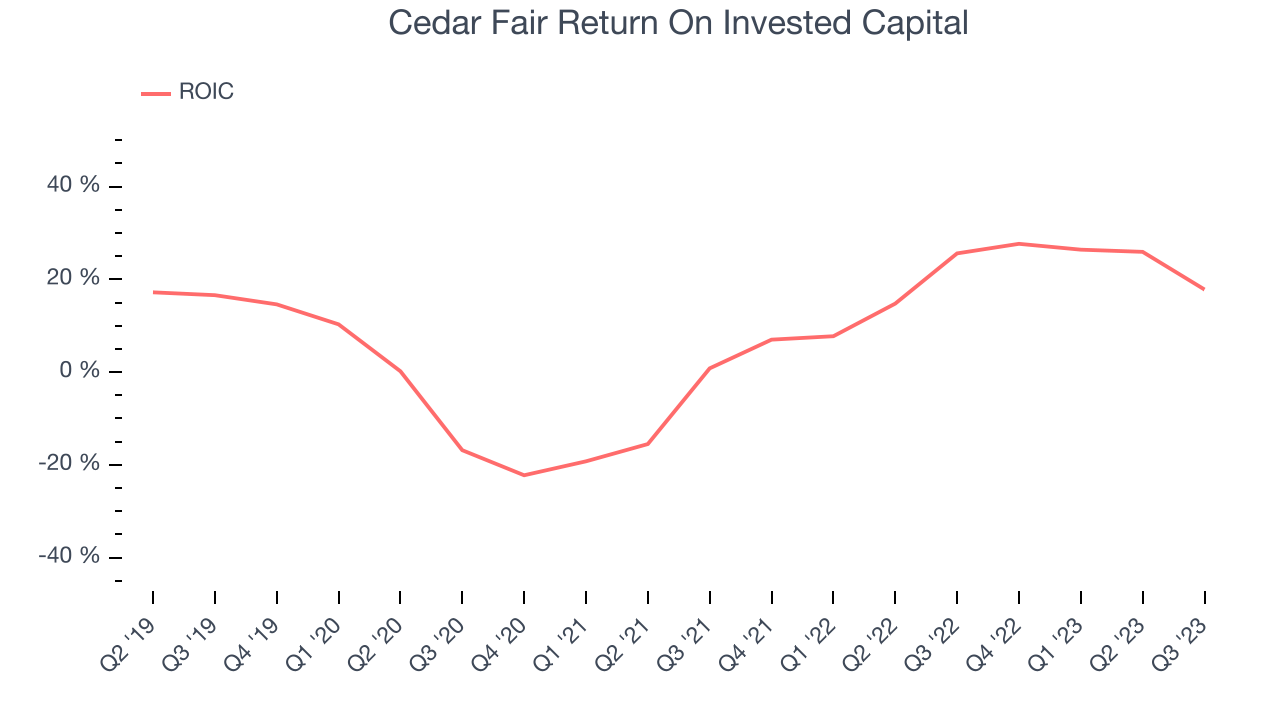
The trend in its ROIC, however, is often what surprises the market and drives the stock price. Over the last few years, Cedar Fair's ROIC has significantly increased. The company's rising ROIC is a good sign and could suggest its competitive advantage or profitable business opportunities are expanding.
Balance Sheet Risk
Debt is a tool that can boost company returns but presents risks if used irresponsibly.
Cedar Fair reported $134.4 million of cash and $2.35 billion of debt on its balance sheet in the most recent quarter. As investors in high-quality companies, we primarily focus on two things: 1) that a company's debt level isn't too high and 2) that its interest payments are not excessively burdening the business.
With $526.6 million of EBITDA over the last 12 months, we view Cedar Fair's 4.2x net-debt-to-EBITDA ratio as safe. We also see its $142.2 million of annual interest expenses as appropriate. The company's profits give it plenty of breathing room, allowing it to continue investing in new initiatives.
Key Takeaways from Cedar Fair's Q3 Results
It was good to see Cedar Fair beat analysts' operating margin expectations this quarter. We were also excited its EPS outperformed Wall Street's estimates. Overall, we think this was a strong quarter that should satisfy shareholders. The stock is flat after reporting and currently trades at $40.99 per share.
Is Now The Time?
Cedar Fair may have had a favorable quarter, but investors should also consider its valuation and business qualities when assessing the investment opportunity.
We think Cedar Fair is a good business. Although its revenue growth has been uninspiring over the last five years with analysts expecting growth to slow from here, its number of visitors have surged over the last two years. And while its declining EPS over the last five years makes it hard to trust, its impressive operating margins show it has a highly efficient business model.
Cedar Fair's price-to-earnings ratio based on the next 12 months is 12.4x. There are definitely a lot of things to like about Cedar Fair, and looking at the consumer discretionary landscape right now, it seems to be trading at a pretty interesting price.
Wall Street analysts covering the company had a one-year price target of $47.70 per share right before these results (compared to the current share price of $40.99), implying they saw upside in buying Cedar Fair in the short term.
To get the best start with StockStory, check out our most recent stock picks, and then sign up for our earnings alerts by adding companies to your watchlist here. We typically have the quarterly earnings results analyzed within seconds of the data being released, and especially for companies reporting pre-market, this often gives investors the chance to react to the results before the market has fully absorbed the information.