
Footwear, apparel, and accessories retailer Genesco (NYSE:GCO) announced better-than-expected results in Q4 FY2024, with revenue up 1.9% year on year to $739 million. It made a non-GAAP profit of $2.59 per share, down from its profit of $3.06 per share in the same quarter last year.
Genesco (GCO) Q4 FY2024 Highlights:
- Revenue: $739 million vs analyst estimates of $704.9 million (4.8% beat)
- EPS (non-GAAP): $2.59 vs analyst expectations of $2.66 (2.5% miss)
- Revenue guidance for the full year 2024 of a 2-3% decrease compared to 2023
- EPS (non-GAAP) guidance for the full year 2024 missed expectations
- Gross Margin (GAAP): 46.3%, in line with the same quarter last year
- Same-Store Sales were down 4% year on year (miss vs. expectations of down 3% year on year)
- Store Locations: 1,341 at quarter end, decreasing by 69 over the last 12 months
- Market Capitalization: $336.3 million
Spanning a broad range of styles, brands, and prices, Genesco (NYSE:GCO) sells footwear, apparel, and accessories through multiple brands and banners.
These include Journeys, Johnston & Murphy, and Lids, among other smaller brands. Journeys is a teen-focused shoe retailer featuring brands like Dr. Martens, Vans, and Adidas. Johnston & Murphy offers its own brand of men's dress shoes and apparel, and Lids is known for its casual hats such as baseball caps and beanies featuring sports teams.
The Genesco core customer is therefore somewhat varied. A teen shopper may head to Journeys and Lids during a trip to the mall for some new sneakers and hats while his/her dad may make his way to Johnsyon & Murphy for some new dress shoes for the office. While there is no unifying aesthetic or style, all Genesco brands tend to be mid-priced. Additionally, Genesco's stores tend to be fairly small, roughly 2,500 square feet, and located in malls and shopping centers in urban and suburban areas. Genesco supplements its physical store footprint with e-commerce presences for each of its brands, all of which were launched in 2009.
Footwear Retailer
Footwear sales–like their apparel counterparts–are driven by seasons, trends, and innovation more so than absolute need and similarly face the bigger-picture secular trend of e-commerce penetration. Footwear plays a part in societal belonging, personal expression, and occasion, and retailers selling shoes recognize this. Therefore, they aim to balance selection, competitive prices, and the latest trends to attract consumers. Unlike their apparel counterparts, footwear retailers most sell popular third-party brands (as opposed to their own exclusive brands), which could mean less exclusivity of product but more nimbleness to pivot to what’s hot.
Retail competitors offering mid-priced footwear and accessories include Foot Locker (NYSE:FL), Designer Brands’s (NYSE:DBI) DSW banner, and TJX (NYSE:TJX).
Sales Growth
Genesco is a small retailer, which sometimes brings disadvantages compared to larger competitors that benefit from economies of scale.
As you can see below, the company's annualized revenue growth rate of 1.4% over the last four years (we compare to 2019 to normalize for COVID-19 impacts) was weak as its store count dropped.
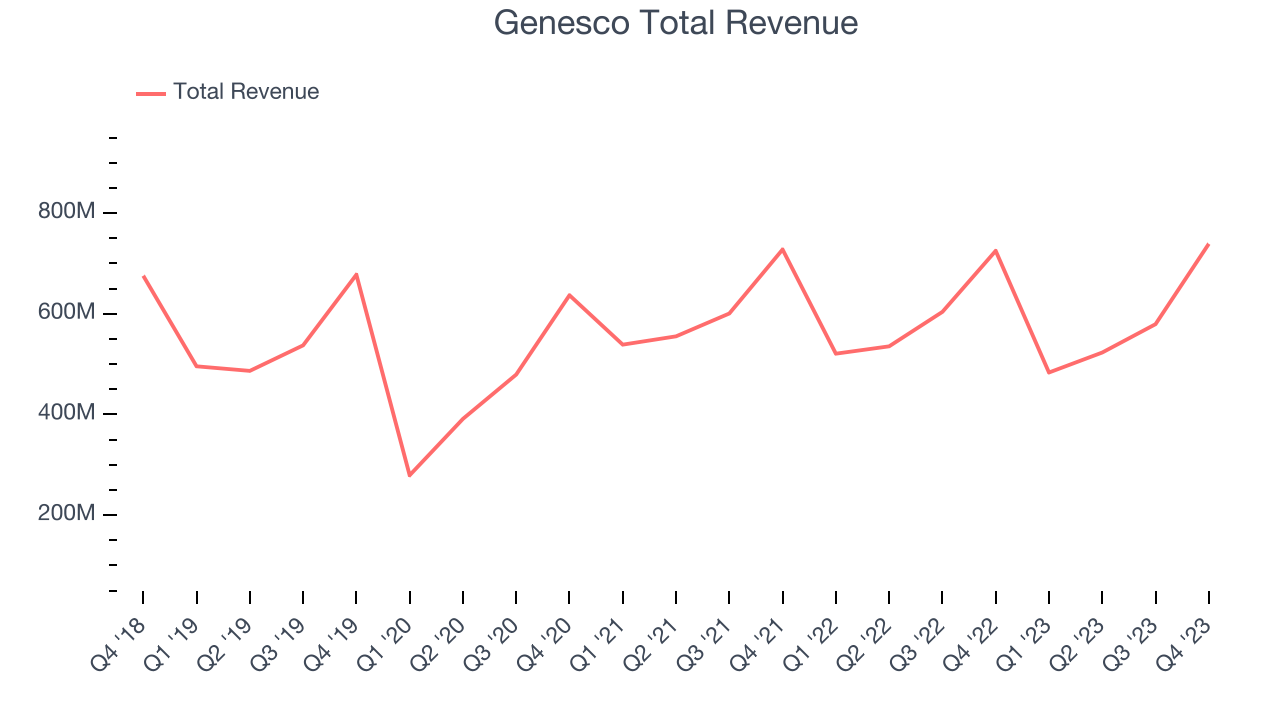
This quarter, Genesco reported decent year-on-year revenue growth of 1.9%, and its $739 million in revenue topped Wall Street's estimates by 4.8%. Looking ahead, Wall Street expects revenue to decline 6.1% over the next 12 months, a deceleration from this quarter.
Number of Stores
When a retailer like Genesco is shuttering stores, it usually means that brick-and-mortar demand is less than supply, and the company is responding by closing underperforming locations and possibly shifting sales online. Genesco's store count shrank by 69 locations, or 4.9%, over the last 12 months to 1,341 total retail locations in the most recently reported quarter.
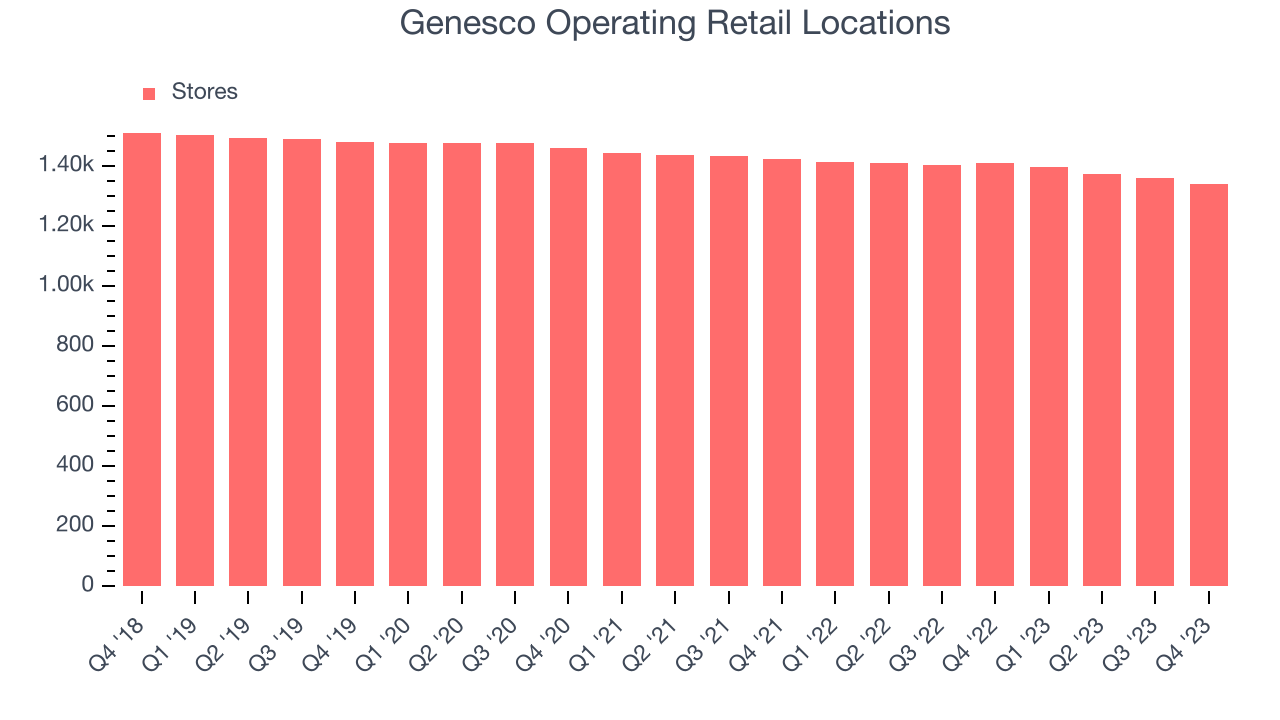
Taking a step back, the company has generally closed its stores over the last two years, averaging a 2.4% annual decline in its physical footprint. A smaller store base means that the company must rely on higher foot traffic and sales per customer at its remaining stores as well as e-commerce sales to fuel revenue growth.
Same-Store Sales
Same-store sales growth is a key performance indicator used to measure organic growth and demand for retailers.
Genesco's demand has been shrinking over the last eight quarters, and on average, its same-store sales have declined by 1.7% year on year. The company has been reducing its store count as fewer locations sometimes lead to higher same-store sales, but that hasn't been the case here.
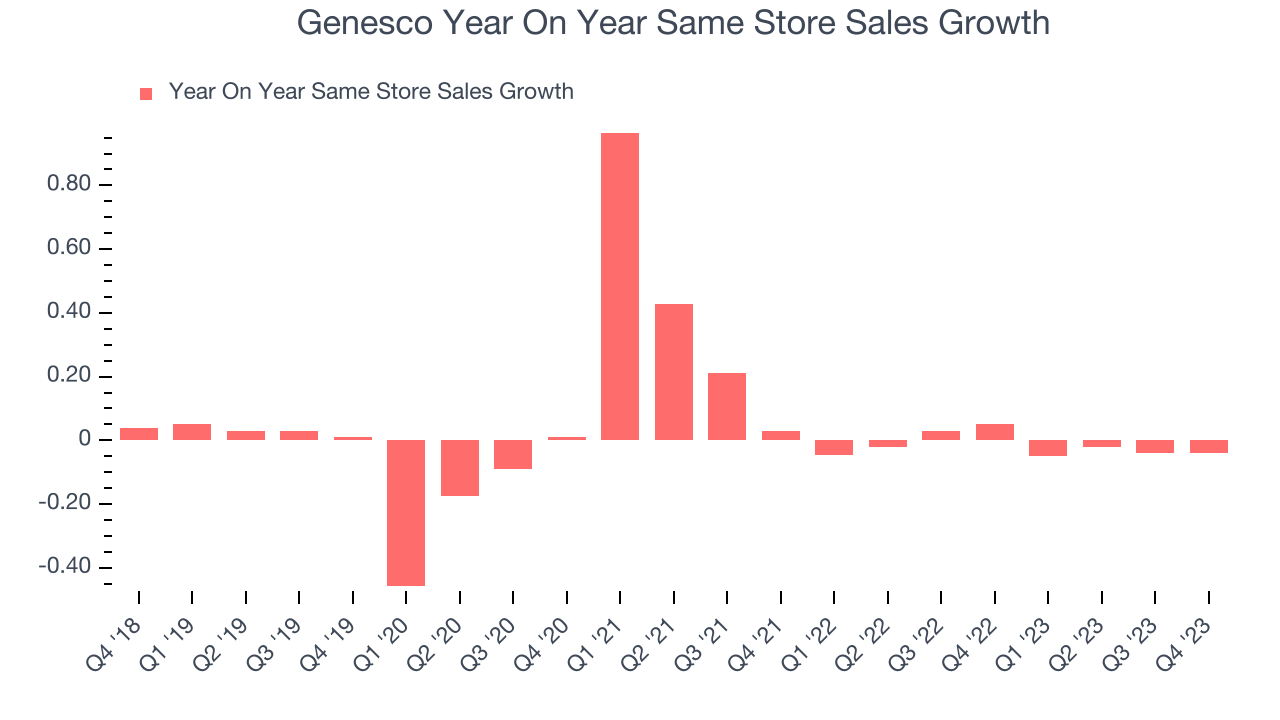
In the latest quarter, Genesco's same-store sales fell 4% year on year. This decline was a reversal from the 5% year-on-year increase it posted 12 months ago. We'll be keeping a close eye on the company to see if this turns into a longer-term trend.
Gross Margin & Pricing Power
Gross profit margins are an important measure of a retailer's pricing power, product differentiation, and negotiating leverage.
Genesco has best-in-class unit economics for a retailer, enabling it to invest in areas such as marketing and talent to stay one step ahead of the competition. As you can see below, it's averaged an exceptional 47.5% gross margin over the last two years. This means the company makes $0.47 for every $1 in revenue before accounting for its operating expenses.
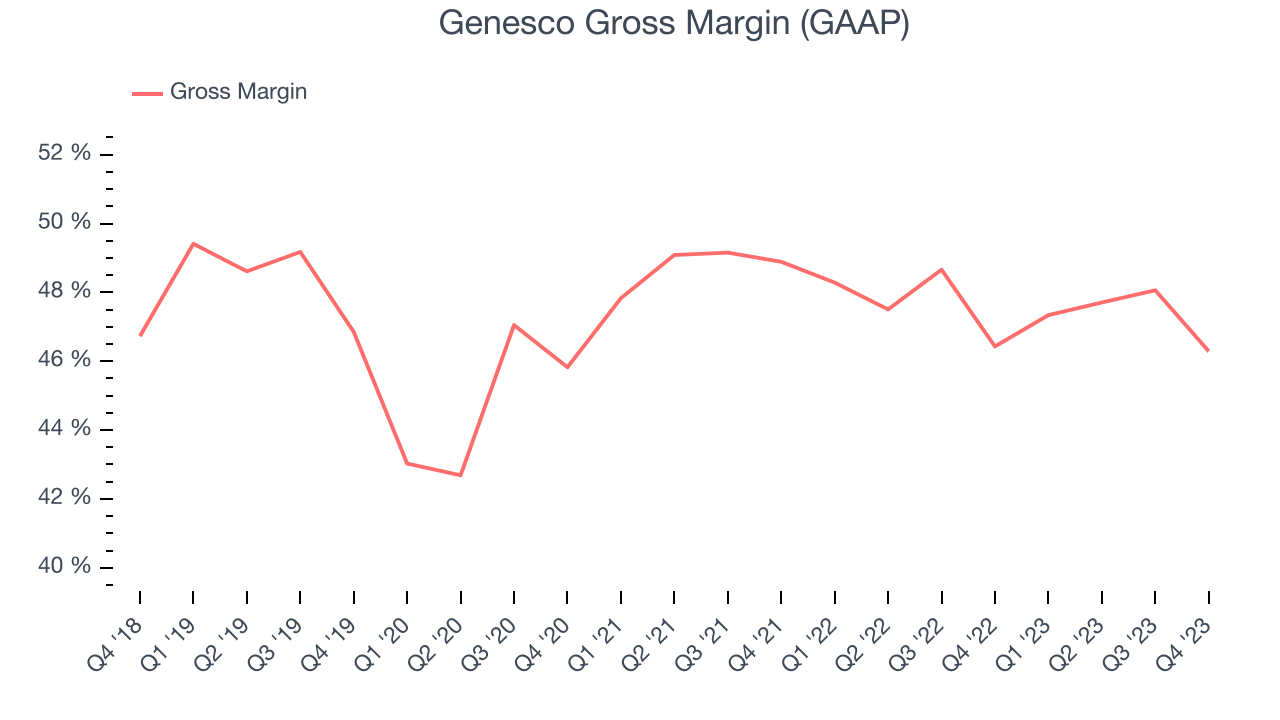
Genesco produced a 46.3% gross profit margin in Q4, flat with the same quarter last year. This steady margin stems from its efforts to keep prices low for consumers and signals that it has stable input costs (such as freight expenses to transport goods).
Operating Margin
Operating margin is a key profitability metric for retailers because it accounts for all expenses keeping the lights on, including wages, rent, advertising, and other administrative costs.
This quarter, Genesco generated an operating profit margin of 5%, down 2 percentage points year on year. We can infer Genesco was less efficient with its expenses or had lower leverage on its fixed costs because its operating margin decreased more than its gross margin.
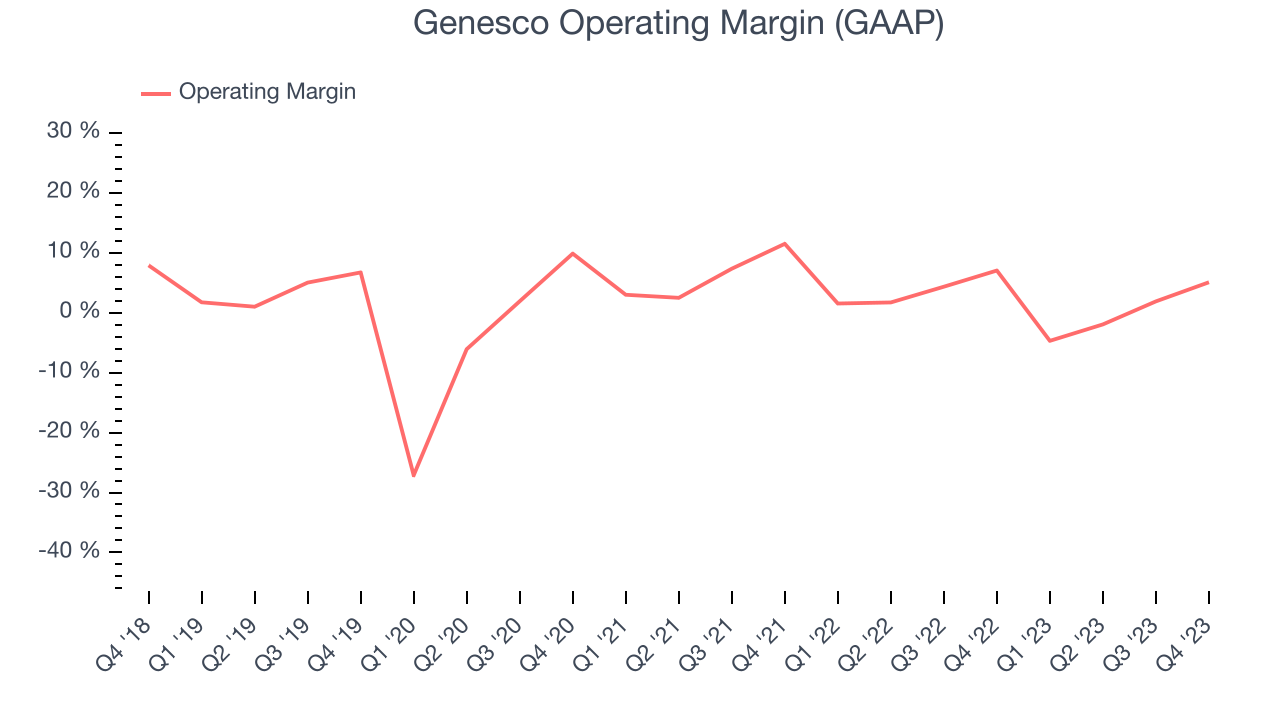
Zooming out, Genesco was profitable over the last two years but held back by its large expense base. Its average operating margin of 2.3% has been paltry for a consumer retail business. On top of that, Genesco's margin has declined, on average, by 3.3 percentage points year on year. This shows the company is heading in the wrong direction, and investors were likely hoping for better results.
EPS
These days, some companies issue new shares like there's no tomorrow. That's why we like to track earnings per share (EPS) because it accounts for shareholder dilution and share buybacks.
In Q4, Genesco reported EPS at $2.59, down from $3.06 in the same quarter a year ago. This print unfortunately missed Wall Street's estimates, but we care more about long-term EPS growth rather than short-term movements.
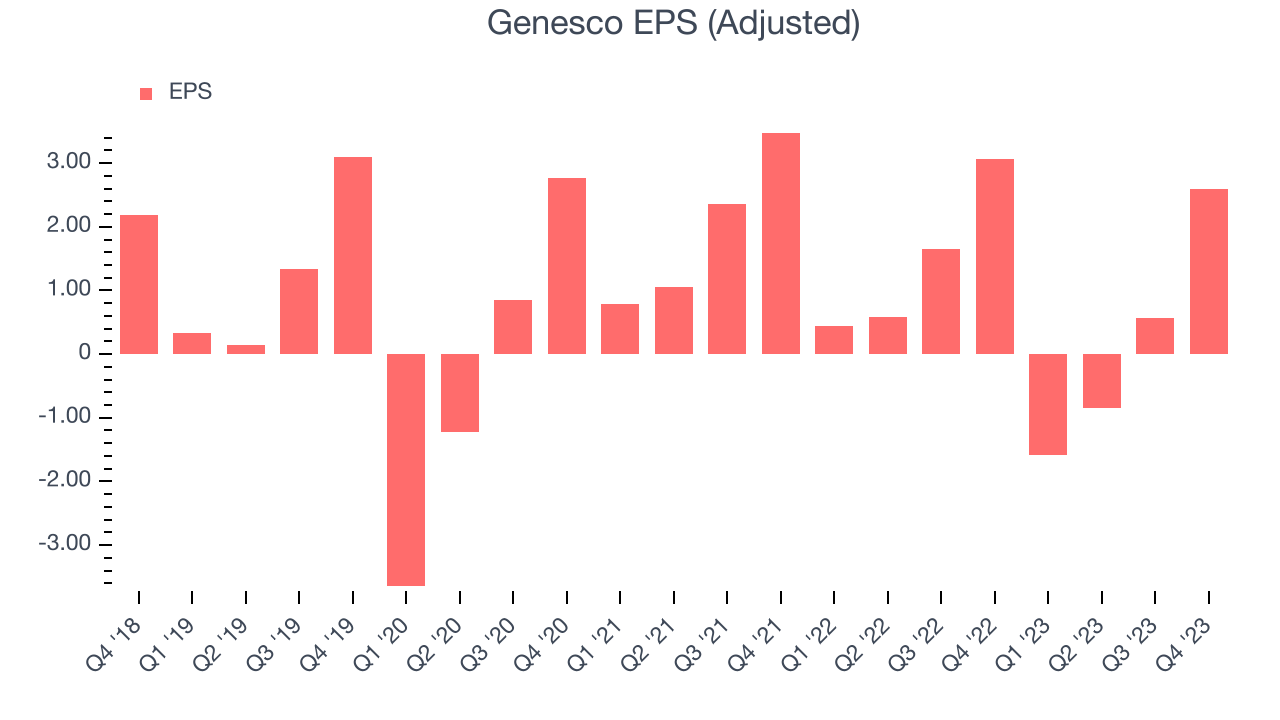
Between FY2020 and FY2024, Genesco's adjusted diluted EPS dropped 85.3%, translating into 38.1% annualized declines. In a mature sector such as consumer retail, we tend to steer our readers away from companies with falling EPS. If there's no earnings growth, it's difficult to build confidence in a business's underlying fundamentals, leaving a low margin of safety around the company's valuation (making the stock susceptible to large downward swings).
Wall Street expects Genesco to continue performing poorly over the next 12 months, with analysts projecting an average 12.6% year-on-year decline in EPS.
Return on Invested Capital (ROIC)
EPS and free cash flow tell us whether a company was profitable while growing revenue. But was it capital-efficient? Enter ROIC, a metric showing how much operating profit a company generates relative to how much money the business raised (debt and equity).
Genesco's five-year average ROIC was 2.6%, somewhat low compared to the best retail companies that consistently pump out 25%+. Its returns suggest it historically did a subpar job investing in profitable business initiatives.
The trend in its ROIC, however, is often what surprises the market and drives the stock price. Over the last two years, Genesco's ROIC averaged 4.4 percentage point increases each year. This is a good sign and we hope the company can continue to improving.
Key Takeaways from Genesco's Q4 Results
We liked that revenue beat analysts' expectations this quarter despite a same store sales miss. We were also happy its gross margin narrowly outperformed Wall Street's estimates. On the other hand, the company expects revenue to decrease 2-3% in 2024 compared to 2023, and its full-year earnings forecast missed analysts' expectations. Zooming out, we think this was still a decent, albeit mixed, quarter, with the guidance likely dragging down shares. Investors were likely expecting more, and the stock is down 2.7% after reporting, trading at $28.5 per share.
Is Now The Time?
Genesco may have had a favorable quarter, but investors should also consider its valuation and business qualities when assessing the investment opportunity.
We cheer for all companies serving consumers, but in the case of Genesco, we'll be cheering from the sidelines. Its revenue growth has been uninspiring over the last four years, and analysts expect growth to deteriorate from here. And while its impressive gross margins are a wonderful starting point for the overall profitability of the business, the downside is its declining EPS over the last four years makes it hard to trust. On top of that, its relatively low ROIC suggests it has struggled to grow profits historically.
Genesco's price-to-earnings ratio based on the next 12 months is 46.5x. While we've no doubt one can find things to like about Genesco, we think there are better opportunities elsewhere in the market. We don't see many reasons to get involved at the moment.
Wall Street analysts covering the company had a one-year price target of $30.50 per share right before these results (compared to the current share price of $28.50).
To get the best start with StockStory, check out our most recent stock picks, and then sign up to our earnings alerts by adding companies to your watchlist here. We typically have the quarterly earnings results analyzed within seconds of the data being released, and especially for companies reporting pre-market, this often gives investors the chance to react to the results before the market has fully absorbed the information.