
Packaged foods company General Mills (NYSE:GIS) reported results ahead of analysts' expectations in Q3 FY2024, with revenue flat year on year at $5.10 billion. It made a non-GAAP profit of $1.17 per share, improving from its profit of $0.97 per share in the same quarter last year.
General Mills (GIS) Q3 FY2024 Highlights:
- Revenue: $5.10 billion vs analyst estimates of $4.97 billion (2.7% beat)
- EPS (non-GAAP): $1.17 vs analyst estimates of $1.05 (11.9% beat)
- 2024 guidance reaffirmed
- Gross Margin (GAAP): 33.5%, up from 32.5% in the same quarter last year
- Free Cash Flow of $751.4 million, down 22.2% from the previous quarter
- Organic Revenue was down 1% year on year (beat vs. expectations of down 2.6% year on year)
- Sales Volumes were down 2% year on year (beat vs. expectations of down 4.3% year on year)
- Market Capitalization: $38.97 billion
Best known for its portfolio of powerhouse breakfast cereal brands, General Mills (NYSE:GIS) is a packaged foods company that has also made a mark in cereals, baking products, and snacks.
The company traces its roots back to 1866 when it started as Minneapolis Milling Company. The early years were marked by innovation, including the development of a more efficient grinding mill. In the 1920s, the company merged with 26 other mills to form General Mills.
Through organic development as well as mergers and acquisitions of companies such as Betty Crocker and Pillsbury, General Mills built a powerful portfolio of packaged foods brands. Today, Cheerios, Chex, Betty Crocker, Yoplait, and Haagen-Dazs are some of the company’s gems and also some of the most recognized brands in American households.
General Mills caters to middle-income households seeking convenience through trusted brands. The heads or caretakers of these households are usually busy and don’t have the time to cook meals or prepare snacks from scratch. The company’s products add convenience to everyday life, and they are often brands that customers have been eating since childhood. General Mills products are sold nearly everywhere. Retailers from the largest supermarkets to the corner deli or bodega all carry that box of Cheerios or the pint of Haagen-Dazs ice cream. Given the company’s scale and traffic-driving brands, General Mills often has prominent placement on retailer shelves.
Packaged Food
Packaged food stocks are considered resilient investments because people always need to eat. These companies therefore can enjoy consistent demand as long as they stay on top of changing consumer preferences. But consumer preferences can be a double-edged sword, as companies that aren't at the front of trends such as health and wellness and natural ingredients can fall behind. Finally, with the advent of the social media, the cost of starting a brand from scratch is much lower, meaning that new entrants can chip away at the market shares of established players.
Competitors in packaged food with broad brand portfolios include Kellogg (NYSE:K), Mondelez (NASDAQ:MDLZ), Kraft Heinz (NASDAQ:KHC), and Nestle (SWX:NESN).Sales Growth
General Mills is one of the most widely recognized consumer staples companies in the world. Its influence over consumers gives it extremely high negotiating leverage with distributors, enabling it to pick and choose where it sells its products (a luxury many don't have).
As you can see below, the company's annualized revenue growth rate of 2.7% over the last three years was weak as consumers bought less of its products. We'll explore what this means in the "Volume Growth" section.
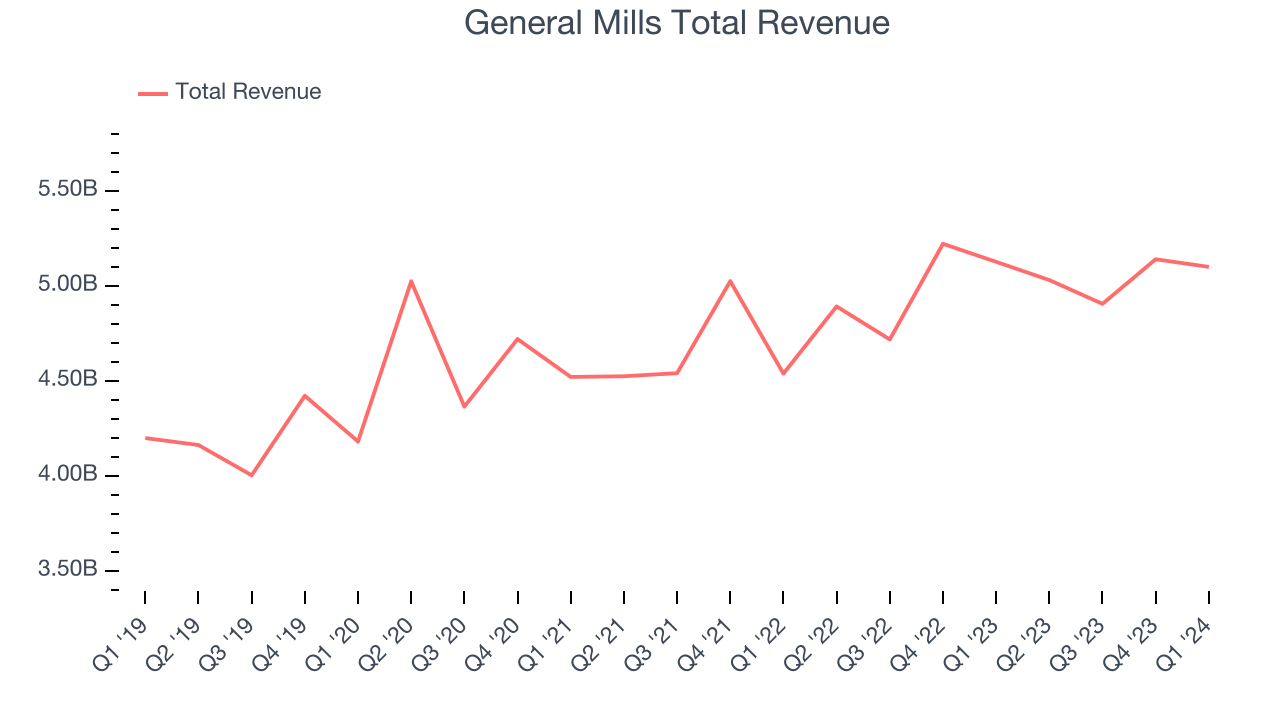
This quarter, General Mills's revenue fell 0.5% year on year to $5.10 billion but beat Wall Street's estimates by 2.7%. Looking ahead, Wall Street expects revenue to remain flat over the next 12 months.
Organic Revenue Growth
When analyzing revenue growth, we care most about organic revenue growth. This metric captures a business's performance excluding the impacts of foreign currency fluctuations and one-time events such as mergers, acquisitions, and divestitures.
The demand for General Mills's products has generally risen over the last two years but lagged behind the broader sector. On average, the company's organic sales have grown by 3.3% year on year.
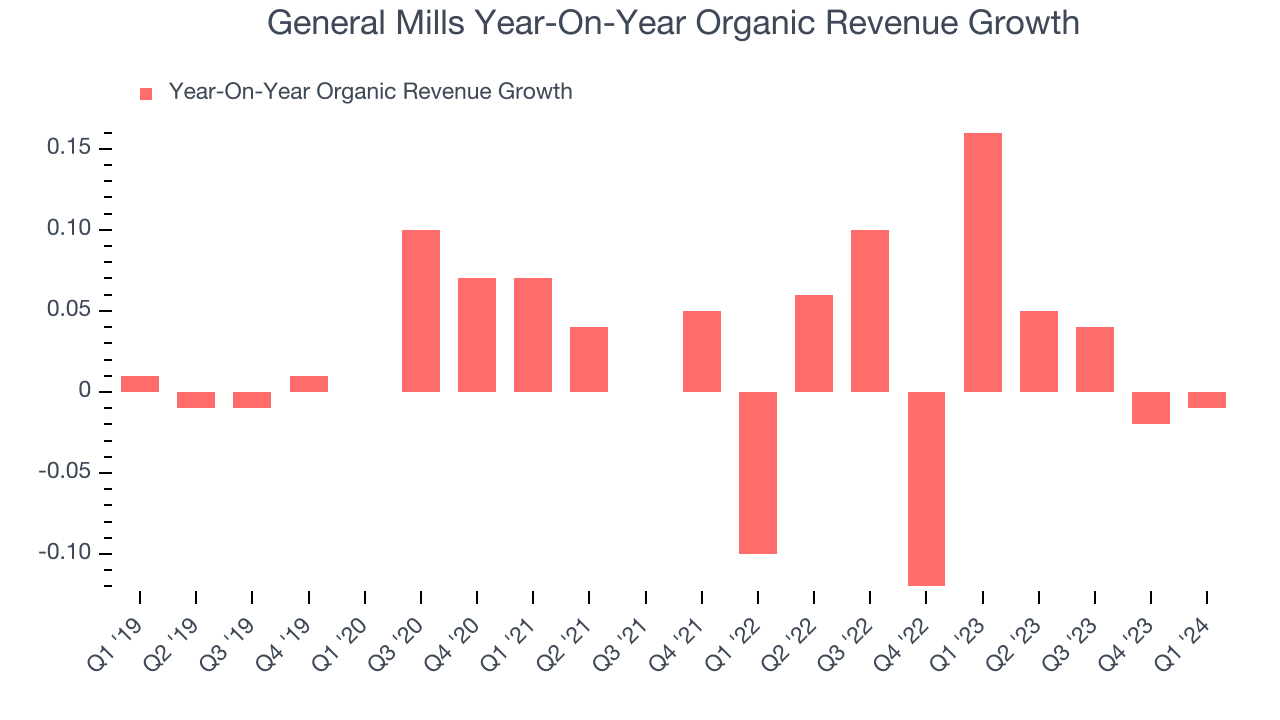
In the latest quarter, General Mills's year on year organic sales were flat. By the company's standards, this growth was a meaningful deceleration from the 16% year-on-year increase it posted 12 months ago. We'll be watching General Mills closely to see if it can reaccelerate growth.
Gross Margin & Pricing Power
We prefer higher gross margins because they make it easier to generate more operating profits.
General Mills's gross profit margin came in at 33.5% this quarter, up 1 percentage points year on year. That means for every $1 in revenue, $0.67 went towards paying for raw materials, production of goods, and distribution expenses.
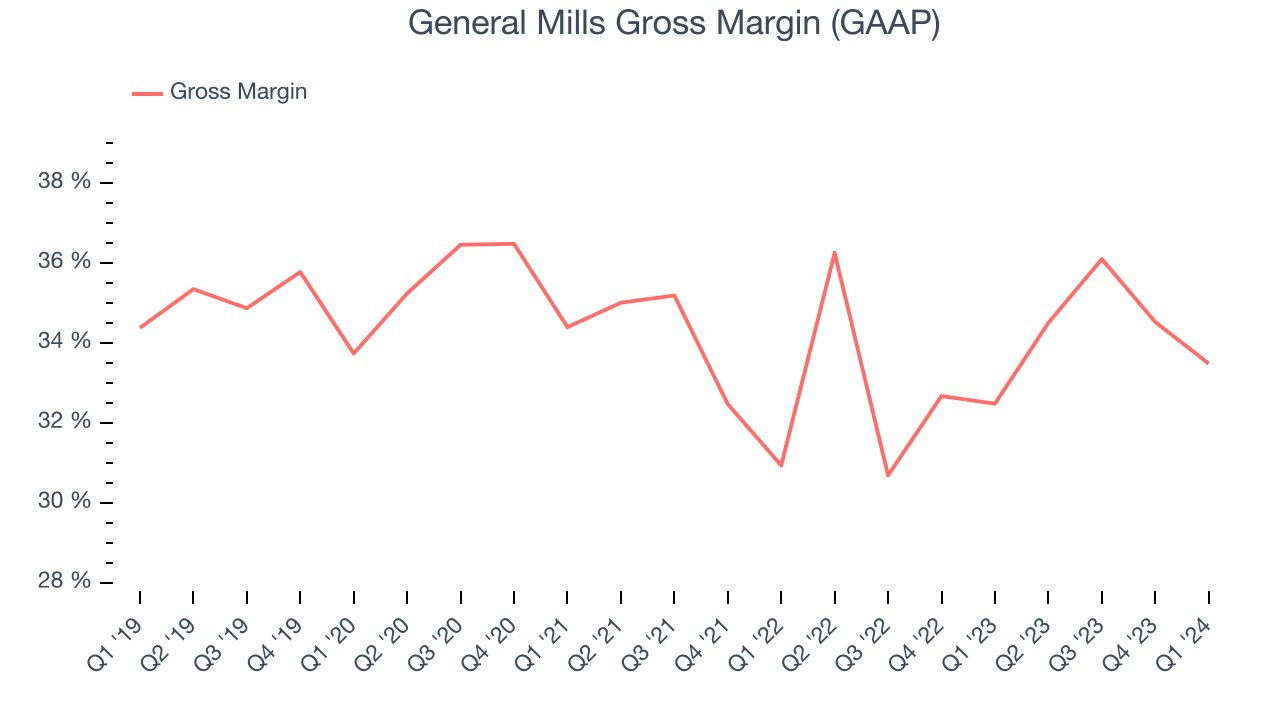
General Mills's unit economics are higher than the typical consumer staples company, giving it the flexibility to invest in areas such as marketing and talent to reach more consumers. As you can see above, it's averaged a decent 33.8% gross margin over the last eight quarters. Its margin has also been trending up over the last 12 months, averaging 5.4% year-on-year increases each quarter. If this trend continues, it could suggest a less competitive environment where the company has better pricing power and more favorable input costs (such as raw materials).
Operating Margin
Operating margin is a key profitability metric for companies because it accounts for all expenses enabling a business to operate smoothly, including marketing and advertising, IT systems, wages, and other administrative costs.
In Q3, General Mills generated an operating profit margin of 17.9%, up 3.6 percentage points year on year. This increase was encouraging, and we can infer General Mills was more efficient with its expenses because its operating margin expanded more than its gross margin.
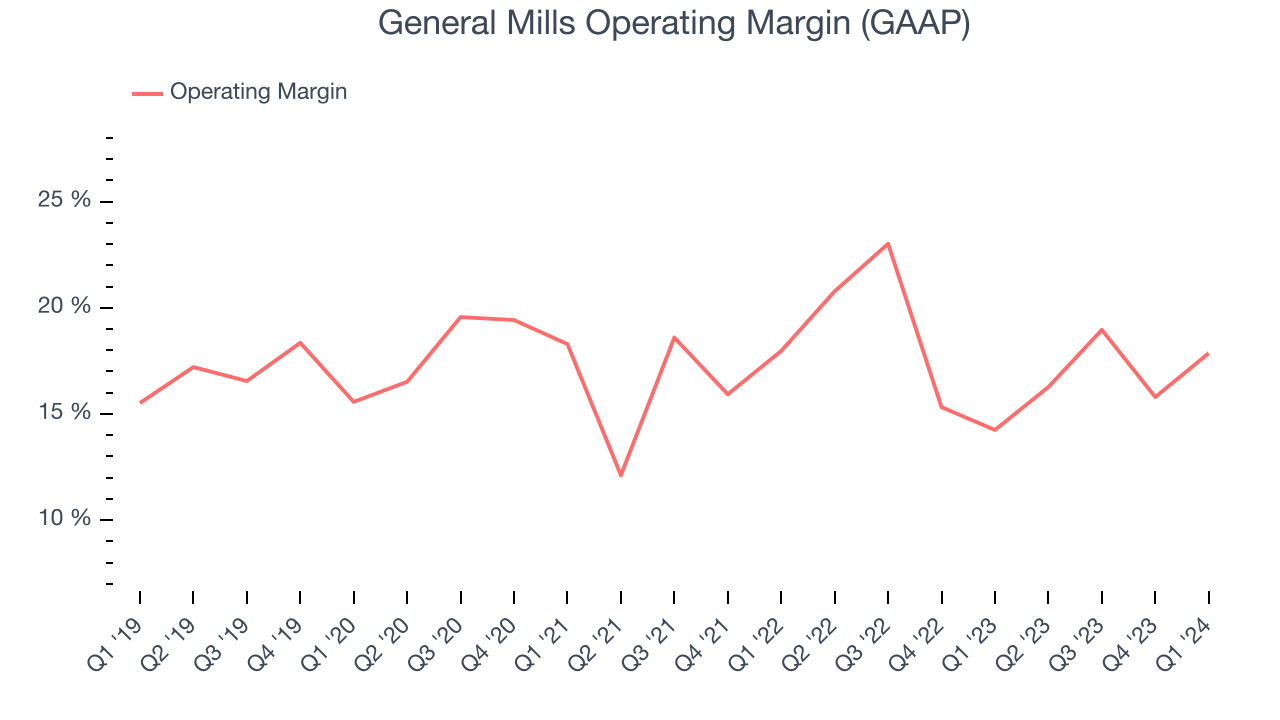 Zooming out, General Mills has been a well-managed company over the last eight quarters. It's demonstrated it can be one of the more profitable businesses in the consumer staples sector, boasting an average operating margin of 17.7%. On top of that, its margin has remained more or less the same, highlighting the consistency of its business.
 EPS
These days, some companies issue new shares like there's no tomorrow. That's why we like to track earnings per share (EPS) because it accounts for shareholder dilution and share buybacks.
In Q3, General Mills reported EPS at $1.17, up from $0.97 in the same quarter a year ago. This print beat Wall Street's estimates by 11.9%.
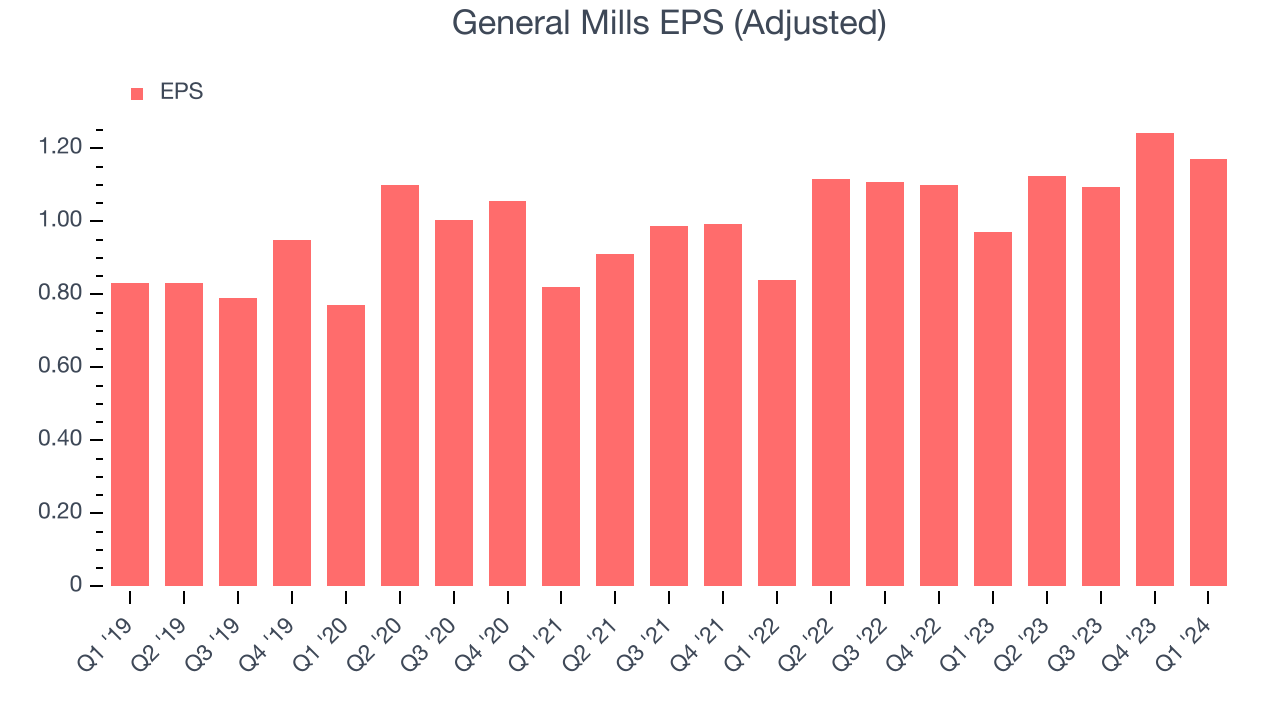
Between FY2021 and FY2024, General Mills's EPS grew 16.4%, translating into a decent 5.2% compounded annual growth rate. This growth is materially higher than its revenue growth over the same period and was driven by excellent expense management (leading to higher profitability) and share repurchases (leading to higher PER share earnings).
Over the next 12 months, however, Wall Street is projecting an average 1.1% year-on-year decline in EPS.
Cash Is King
If you've followed StockStory for a while, you know we emphasize free cash flow. Why, you ask? We believe that in the end, cash is king, and you can't use accounting profits to pay the bills.
General Mills's free cash flow came in at $751.4 million in Q3, up 7.1% year on year. This result represents a 14.7% margin.
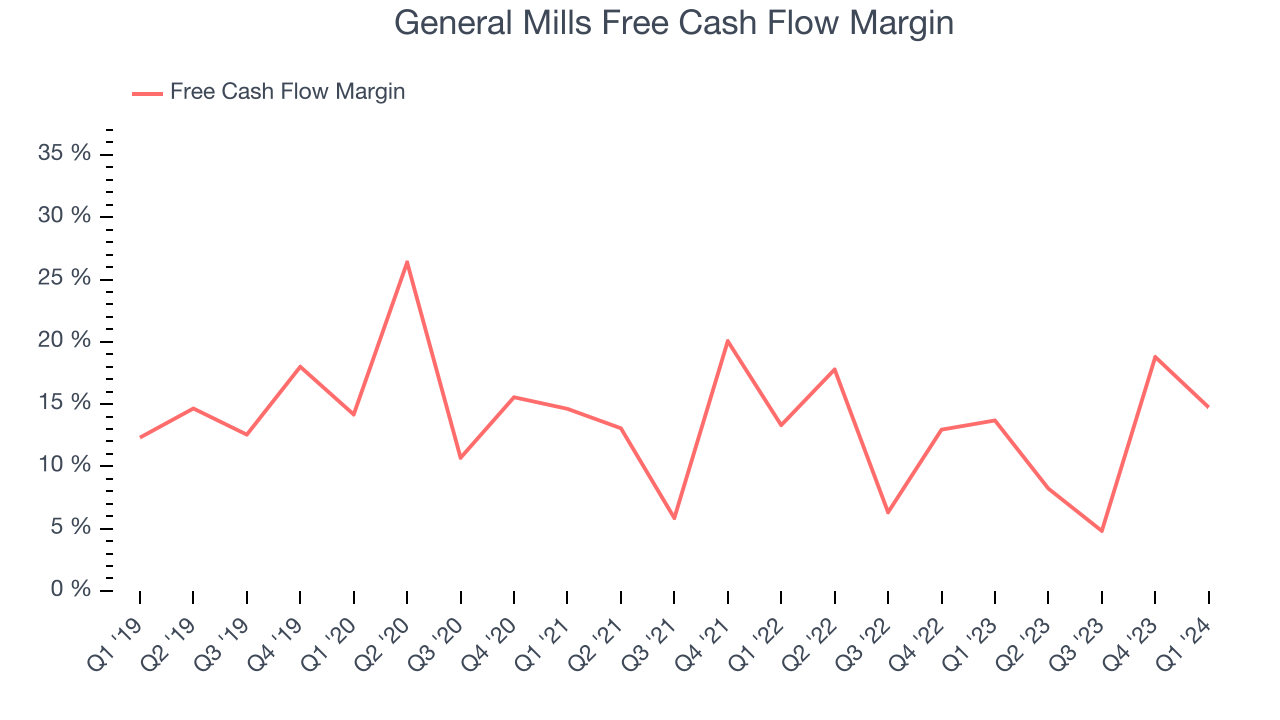
Over the last two years, General Mills has shown strong cash profitability, giving it an edge over its competitors and the option to reinvest or return capital to investors while keeping cash on hand for emergencies. The company's free cash flow margin has averaged 12.2%, quite impressive for a consumer staples business. However, its margin has averaged year-on-year declines of 1 percentage points over the last 12 months. If this trend continues, it could signal that the business is becoming slightly more capital-intensive.
Return on Invested Capital (ROIC)
EPS and free cash flow tell us whether a company was profitable while growing revenue. But was it capital-efficient? Enter ROIC, a metric showing how much operating profit a company generates relative to how much money the business raised (debt and equity).
Although General Mills hasn't been the highest-quality company lately because of its poor top-line performance, it historically did a solid job investing in profitable business initiatives. Its five-year average ROIC was 14.1%, higher than most consumer staples companies.
The trend in its ROIC, however, is often what surprises the market and drives the stock price. Uneventfully, General Mills's ROIC stayed the same over the last two years. This is fine because its returns are solid, but if the company wants to become an investable business, it will need to increase its ROIC even more.
Key Takeaways from General Mills's Q3 Results
We were impressed by how significantly General Mills blew past analysts' organic revenue growth expectations this quarter. We were also excited its revenue outperformed Wall Street's estimates. That the company maintained its full year outlook for organic net sales and EPS means it is staying on track. Overall, this quarter's results seemed fairly positive and shareholders should feel optimistic. The stock is up 2.9% after reporting and currently trades at $70.64 per share.
Is Now The Time?
General Mills may have had a favorable quarter, but investors should also consider its valuation and business qualities when assessing the investment opportunity.
We cheer for all companies serving consumers, but in the case of General Mills, we'll be cheering from the sidelines. Its revenue growth has been uninspiring over the last three years, and analysts expect growth to deteriorate from here. And while its scale gives it immense negotiating leverage with retailers, the downside is its projected EPS for the next year is lacking. On top of that, its shrinking sales volumes suggest it'll need to change its strategy to succeed.
General Mills's price-to-earnings ratio based on the next 12 months is 15.0x. While the price is reasonable and there are some things to like about General Mills, we think there are better opportunities elsewhere in the market right now.
Wall Street analysts covering the company had a one-year price target of $69.06 per share right before these results (compared to the current share price of $70.64).
To get the best start with StockStory, check out our most recent stock picks, and then sign up to our earnings alerts by adding companies to your watchlist here. We typically have the quarterly earnings results analyzed within seconds of the data being released, and especially for companies reporting pre-market, this often gives investors the chance to react to the results before the market has fully absorbed the information.