
Building materials distributor GMS (NYSE:GMS) reported results in line with analysts' expectations in Q1 CY2024, with revenue up 8.4% year on year to $1.41 billion. It made a non-GAAP profit of $1.93 per share, down from its profit of $2.11 per share in the same quarter last year.
Is now the time to buy GMS? Find out by accessing our full research report, it's free.
GMS (GMS) Q1 CY2024 Highlights:
- Revenue: $1.41 billion vs analyst estimates of $1.40 billion (small beat)
- EPS (non-GAAP): $1.93 vs analyst expectations of $2.06 (6.1% miss)
- Gross Margin (GAAP): 31.9%, down from 32.6% in the same quarter last year
- Free Cash Flow of $186.7 million, up 98.4% from the previous quarter
- Organic Revenue rose 4% year on year (0.6% in the same quarter last year)
- Market Capitalization: $3.58 billion
“We were pleased to deliver solid results for our fourth quarter and full year fiscal 2024, including record levels of net sales for the year,” said John C. Turner, Jr, President and Chief Executive Officer of GMS.
Founded in 1971, GMS (NYSE:GMS) distributes specialty building materials including wallboard, ceilings, and insulation products, to the construction industry.
Building Material Distributors
Supply chain and inventory management are themes that grew in focus after COVID wreaked havoc on the global movement of raw materials and components. Building materials distributors that boast reliable selection and quickly deliver products to customers can benefit from this theme. While e-commerce hasn’t disrupted industrial distribution as much as consumer retail, it is forcing investment in digital capabilities to communicate with and serve customers everywhere. Additionally, building materials distributors are at the whim of economic cycles that impact the capital spending and construction projects that can juice demand.
Sales Growth
Examining a company's long-term performance can provide clues about its business quality. Any business can put up a good quarter or two, but the best consistently grow over the long haul. Thankfully, GMS's 12% annualized revenue growth over the last five years was excellent. This is encouraging because it shows GMS's offerings resonate with customers, a helpful starting point for our assessment of quality. 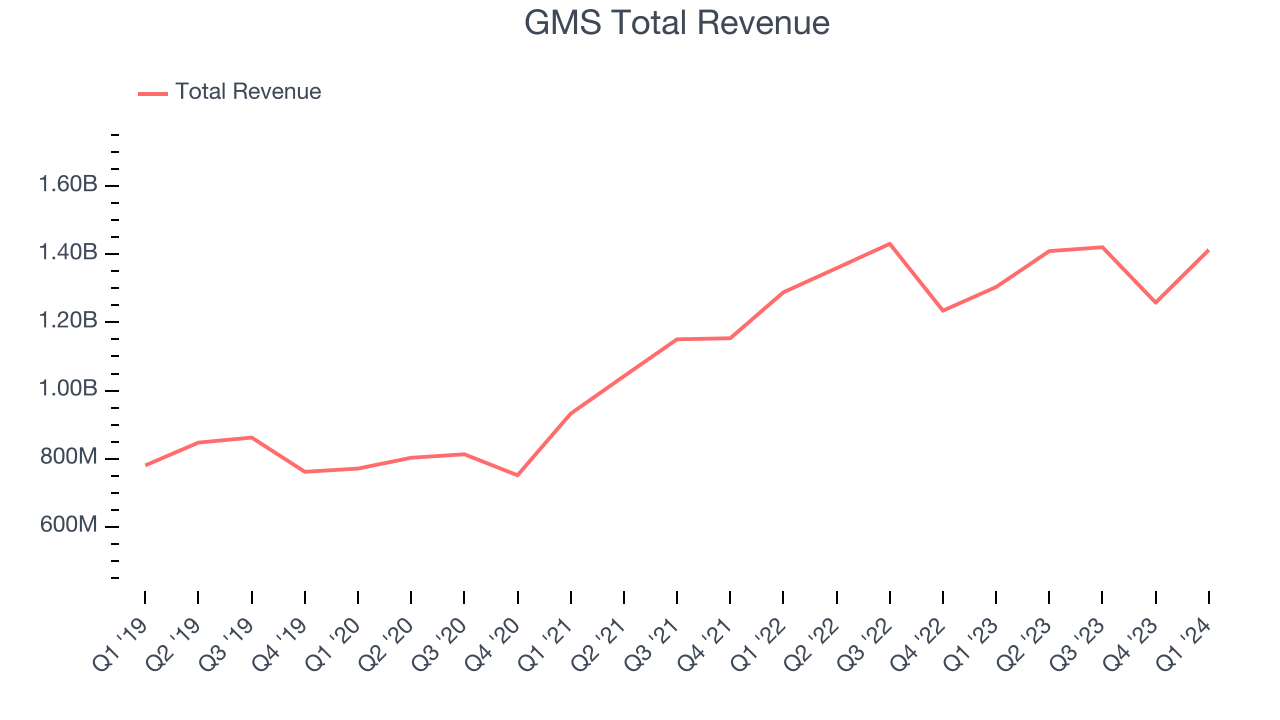
Long-term growth is the most important, but within industrials, a half-decade historical view may miss new industry trends or demand cycles. GMS's annualized revenue growth of 9% over the last two years is below its five-year trend, but we still think the results were respectable.
We can dig further into the company's sales dynamics by analyzing its organic revenue, which strips out currency fluctuations and one-time events like acquisitions because they don't accurately reflect the company's demand. Over the last two years, GMS's organic revenue averaged 6.9% year-on-year growth. Because this number is lower than its normal revenue growth, we can see that some mixture of acquisitions and foreign exchange rates boosted its top-line performance. 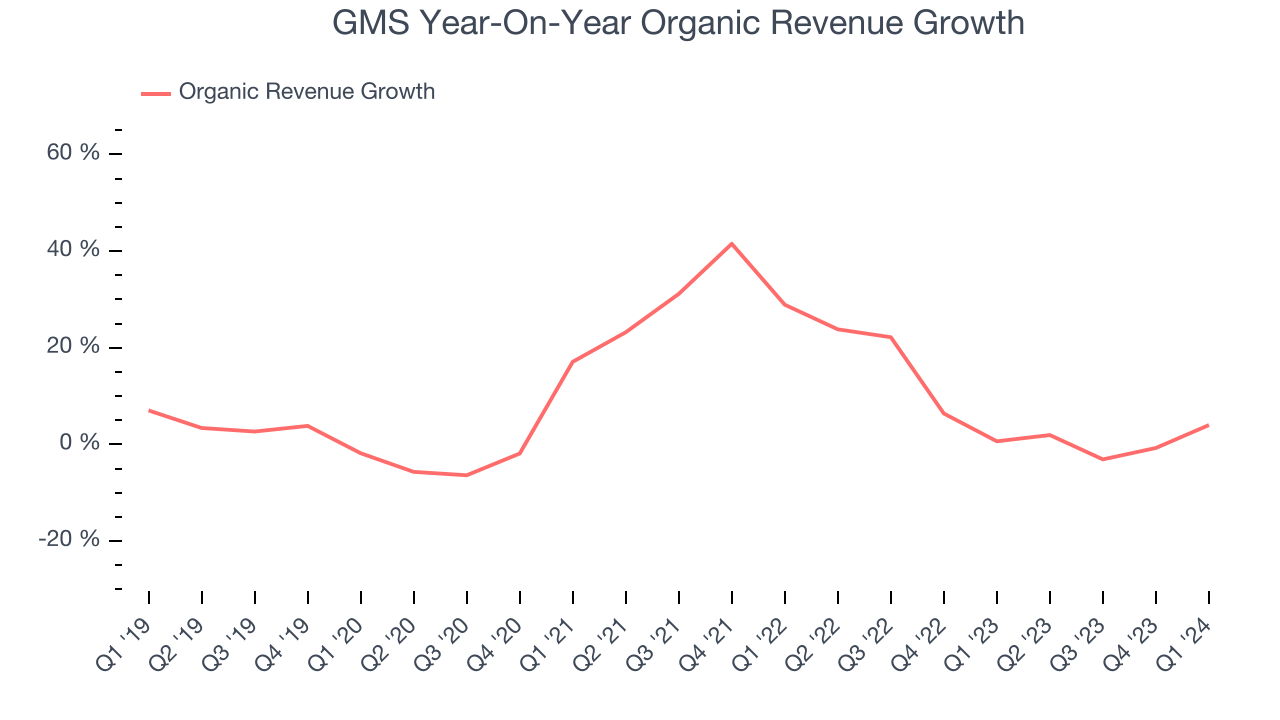
This quarter, GMS grew its revenue by 8.4% year on year, and its $1.41 billion of revenue was in line with Wall Street's estimates. Looking ahead, Wall Street expects sales to grow 7.6% over the next 12 months.
When a company has more cash than it knows what to do with, buying back its own shares can make a lot of sense–as long as the price is right. Luckily, we’ve found one, a low-priced stock that is gushing free cash flow AND buying back shares. Click here to claim your Special Free Report on a fallen angel growth story that is already recovering from a setback.
Cash Is King
Although earnings are undoubtedly valuable for assessing company performance, we believe cash is king because you can't use accounting profits to pay the bills.
GMS has shown mediocre cash profitability over the last five years, putting it in a pinch as it gives the company limited opportunities to reinvest, pay down debt, or return capital to shareholders. Its free cash flow margin averaged 5.9%, subpar for an industrials business.
Taking a step back, we can see that GMS's margin dropped by 1.7 percentage points during that time. Its unexciting margin and trend put the company in a tough spot, and shareholders are likely hoping it can reverse course.
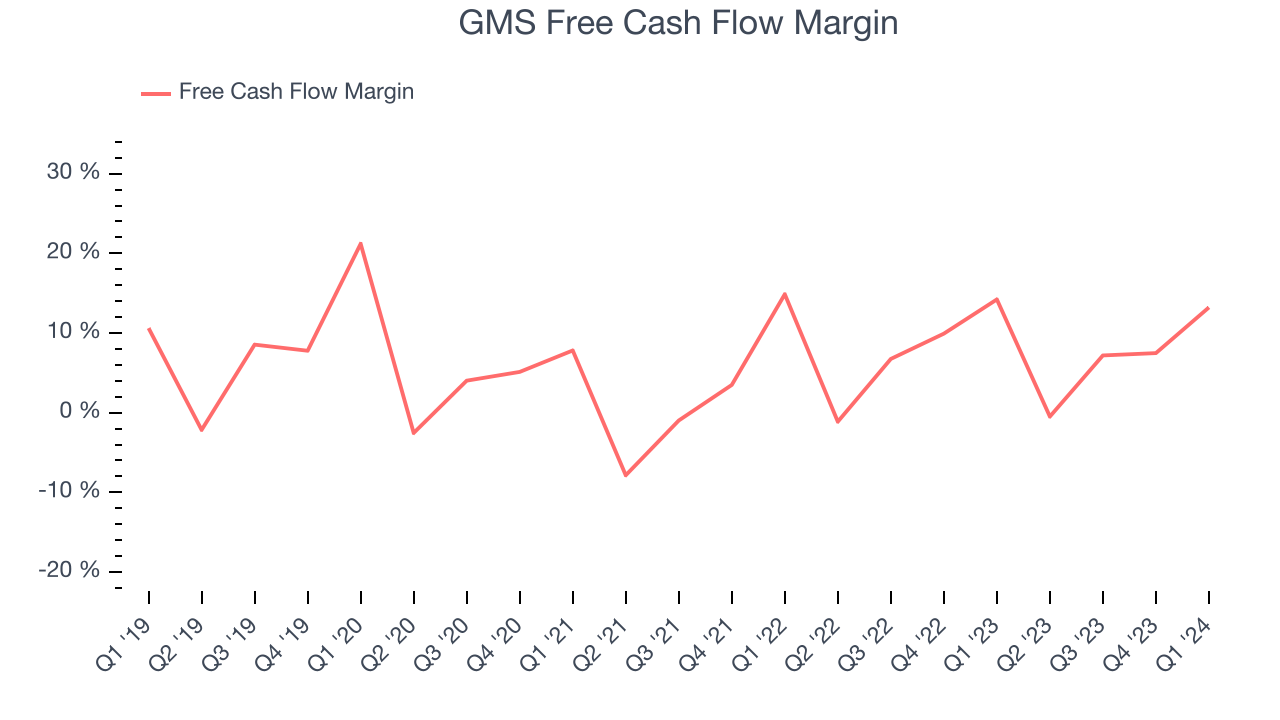
GMS's free cash flow clocked in at $186.7 million in Q1, equivalent to a 13.2% margin. The company's margin regressed as it was 1 percentage points lower than in the same quarter last year.
Key Takeaways from GMS's Q1 Results
It was good to see GMS beat analysts' revenue expectations this quarter. On the other hand, its operating margin missed and its EPS fell short of Wall Street's estimates. Overall, this was a bad quarter for GMS. The company is down 3.6% on the results and currently trades at $86.66 per share.
GMS may have had a tough quarter, but does that actually create an opportunity to invest right now? When making that decision, it's important to consider its valuation, business qualities, as well as what has happened in the latest quarter. We cover that in our actionable full research report which you can read here, it's free.