
Clothing and accessories retailer The Gap (NYSE:GPS) reported Q4 FY2023 results topping analysts' expectations, with revenue up 1.3% year on year to $4.30 billion. It made a non-GAAP profit of $0.37 per share, improving from its loss of $0.75 per share in the same quarter last year.
Gap (GPS) Q4 FY2023 Highlights:
- Revenue: $4.30 billion vs analyst estimates of $4.23 billion (1.7% beat)
- EPS (non-GAAP): $0.37 vs analyst estimates of $0.25 ($0.12 beat)
- Full year 2024 guidance calling for flat sales year on year and low to mid-teens percentage growth in operating income
- Gross Margin (GAAP): 38.9%, down from 63.5% in the same quarter last year
- Store Locations: 3,560 at quarter end, increasing by 208 over the last 12 months
- Market Capitalization: $7.07 billion
Operating under The Gap, Old Navy, Banana Republic, and Athleta brands, The Gap (NYSE:GPS) is an apparel and accessories retailer that sells its own brand of casual clothing to men, women, and children.
The core customer is therefore broad, and the aesthetic is a mix of timeless and trendy Americana. For example, The Gap will has always been a good place to find a classic pair of khakis for work. It can also be a destination for a jacket that is a bit more trendy and fashion forward. Prices tend to be towards the affordable end of the spectrum, with frequent sales further enticing customers.
Old Navy features the lowest prices and is the most casual in style. Banana Republic is the most upscale and this is reflected in its prices. The Gap brand sits in the middle with regards to price and style. Athleta, acquired in 2008, offers women’s athleisure clothing such as yoga pants and sports bras.
The Gap’s stores, regardless of brand, are roughly 5,000 square feet and located in malls or shopping centers. They are organized in a similar manner to other clothing retailers, with sections for men, women, and children as well as centralized displays for promoted or seasonal items. The Gap has an ecommerce presence for each of its brands that gives customers various shopping options.
Apparel Retailer
Apparel sales are not driven so much by personal needs but by seasons, trends, and innovation, and over the last few decades, the category has shifted meaningfully online. Retailers that once only had brick-and-mortar stores are responding with omnichannel presences. The online shopping experience continues to improve and retail foot traffic in places like shopping malls continues to stall, so the evolution of clothing sellers marches on.
Retailers offering casual yet trendy apparel for men, women, and children include H&M (OM:HMB), Inditex (BME:ITX) which owns Zara, Abercrombie & Fitch (NYSE:ANF), and American Eagle Outfitters (NYSE:AEO).Sales Growth
Gap is larger than most consumer retail companies and benefits from economies of scale, giving it an edge over its competitors.
As you can see below, the company's revenue has declined over the last four years, dropping 2.4% annually as it failed to grow its store footprint meaningfully and observed lower sales at existing, established stores.
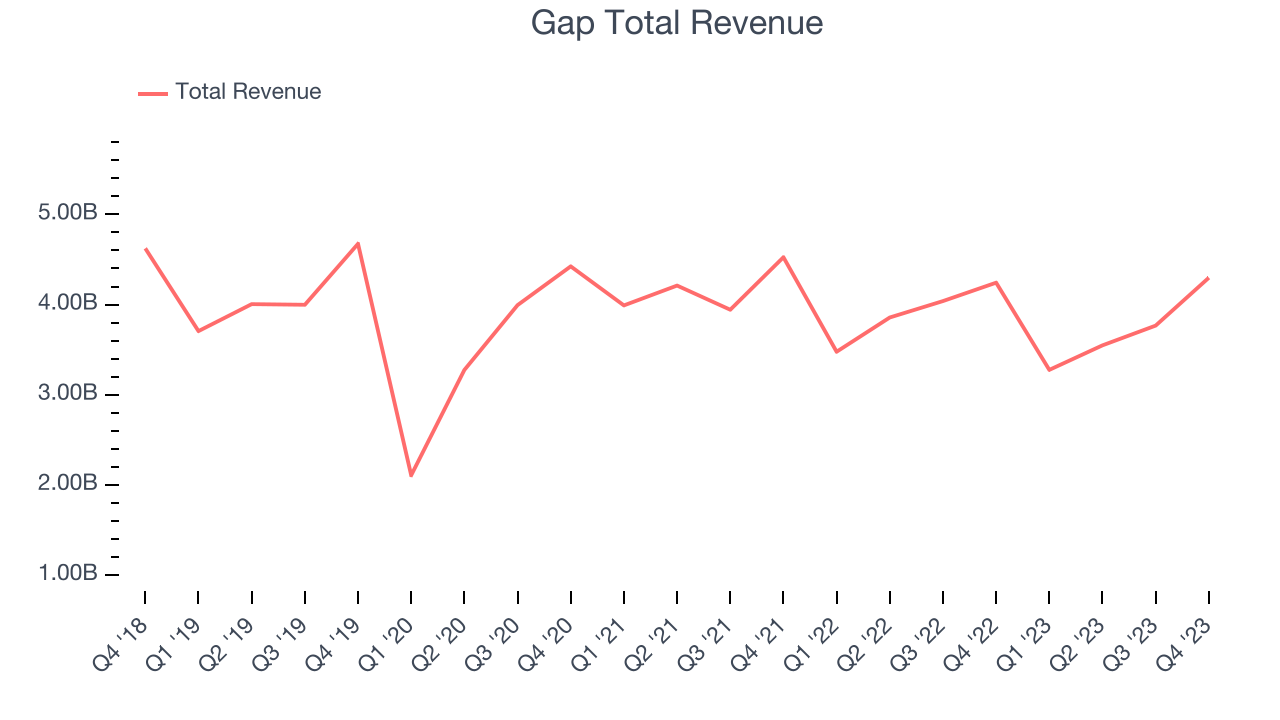
This quarter, Gap reported decent year-on-year revenue growth of 1.3%, and its $4.30 billion in revenue topped Wall Street's estimates by 1.7%. Looking ahead, Wall Street expects revenue to remain flat over the next 12 months, a deceleration from this quarter.
Number of Stores
A retailer's store count often determines on how much revenue it can generate.
When a retailer like Gap keeps its store footprint steady, it usually means that demand is stable and it's focused on improving operational efficiency to increase profitability. Since last year, Gap's store count increased by 208 locations, or 6.2%, to 3,560 total retail locations in the most recently reported quarter.
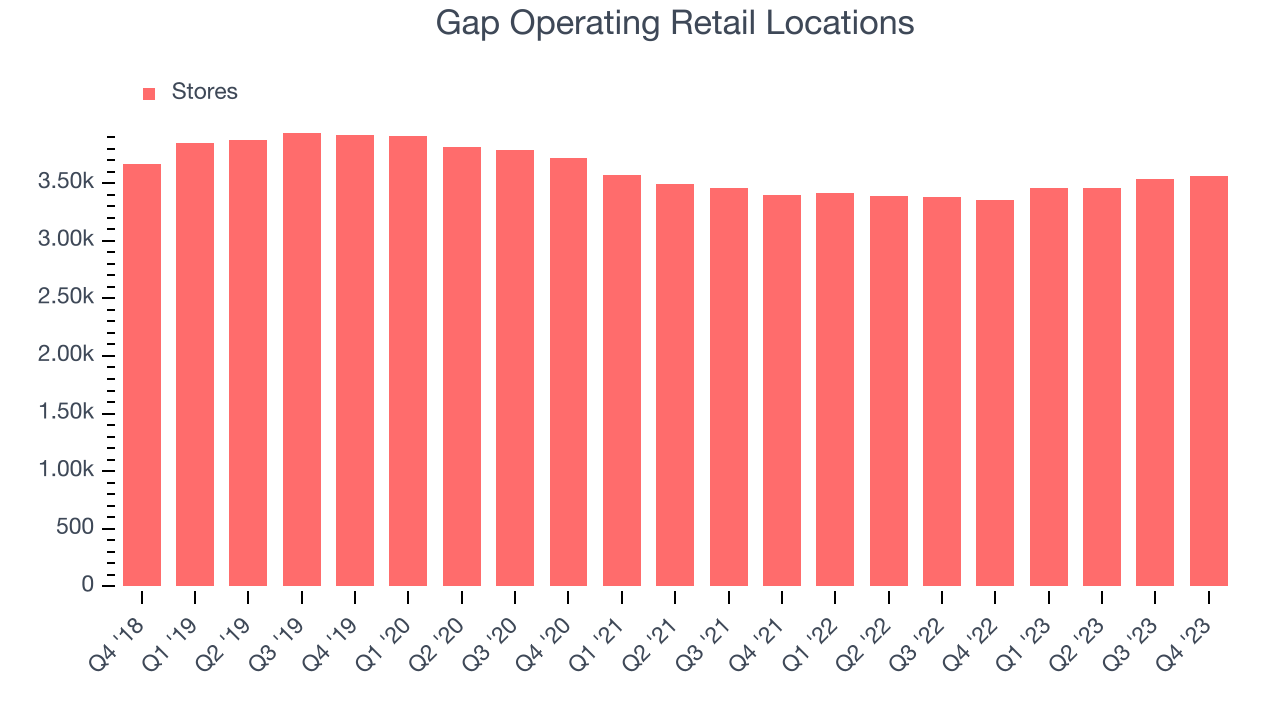
Taking a step back, the company has kept its physical footprint more or less flat over the last two years while other consumer retail businesses have opted for growth. A flat store base means that revenue growth must come from increased e-commerce sales or higher foot traffic and sales per customer at existing stores.
Same-Store Sales
Same-store sales growth is a key performance indicator used to measure organic growth and demand for retailers.
Gap's demand has been shrinking over the last eight quarters, and on average, its same-store sales have declined by 4.9% year on year. This performance is quite concerning and the company should reconsider its strategy before investing its precious capital into new store buildouts.
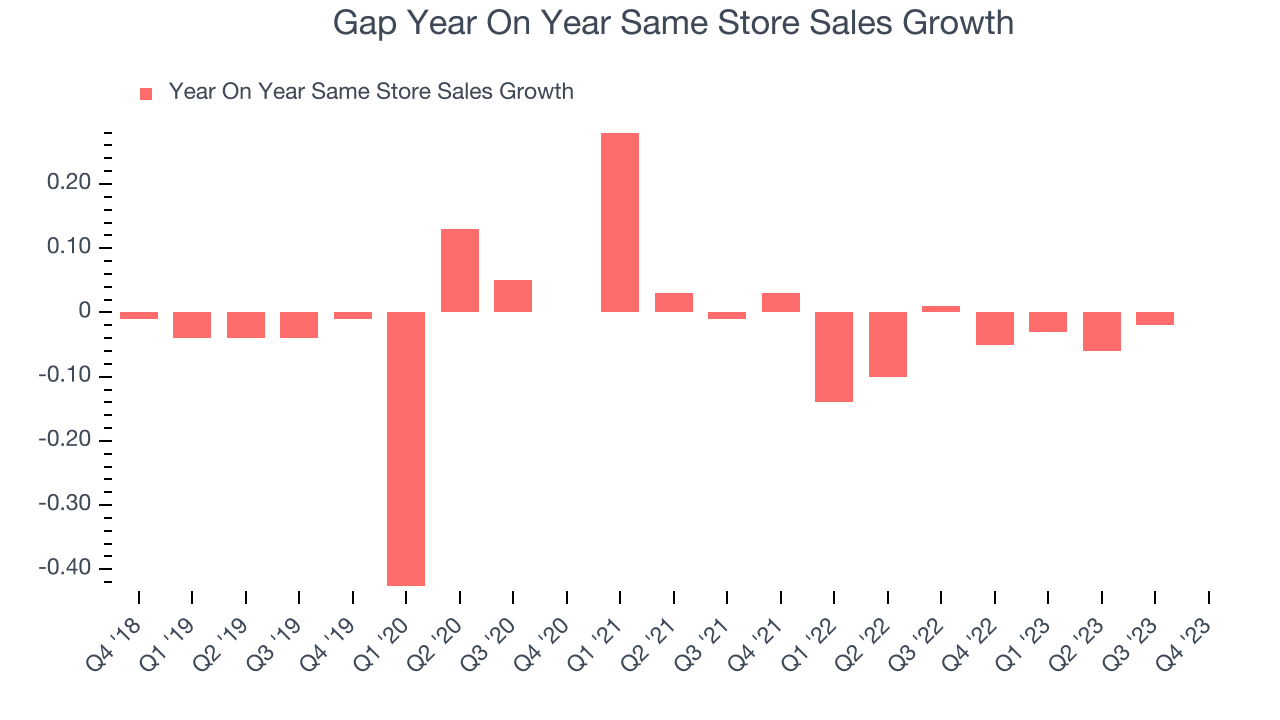
In the latest quarter, Gap's year on year same-store sales were flat. This performance was a well-appreciated turnaround from the 5% year-on-year decline it posted 12 months ago, showing the business is doing better.
Gross Margin & Pricing Power
Gap has good unit economics for a retailer, giving it the opportunity to invest in areas such as marketing and talent to stay competitive. As you can see below, it's averaged a healthy 40.7% gross margin over the last two years. This means the company makes $0.41 for every $1 in revenue before accounting for its operating expenses.
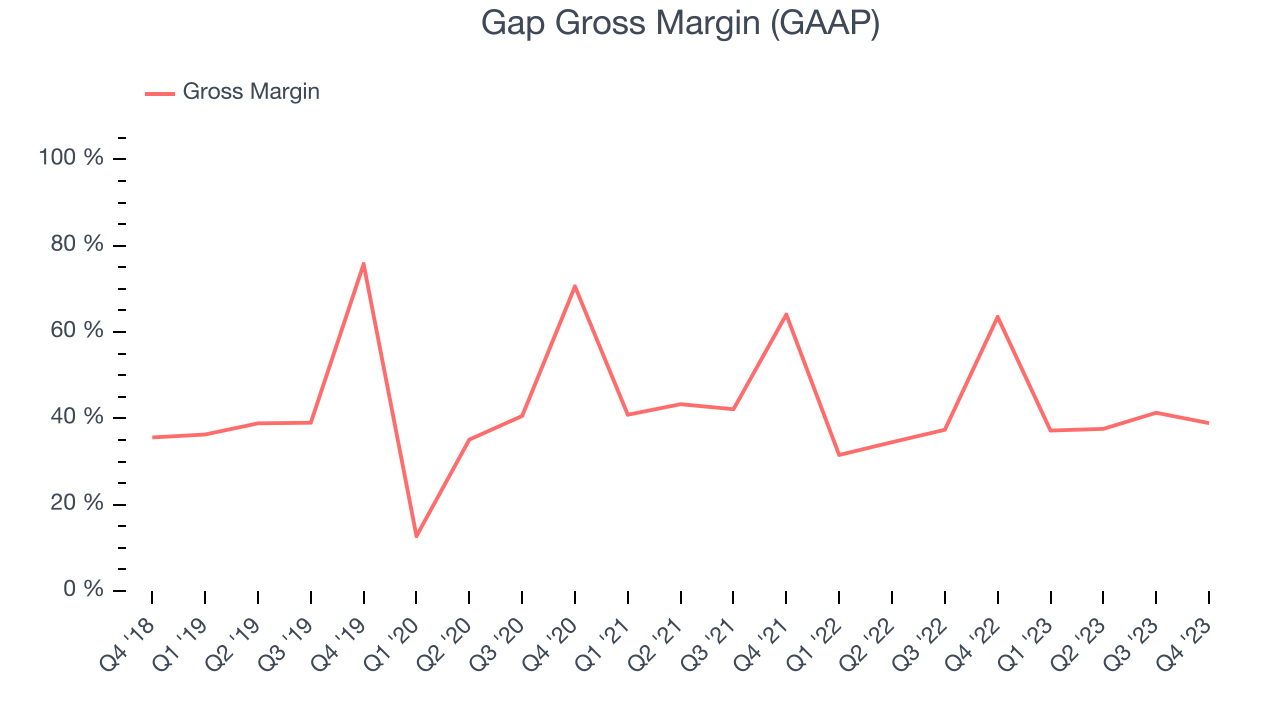
Gap's gross profit margin came in at 38.9% this quarter, marking a 24.6 percentage point decrease from 63.5% in the same quarter last year. Although the company could've performed better, we care more about its long-term trends rather than just one quarter. Additionally, a retailer's gross margin can often change due to factors outside its control, such as product discounting and dynamic input costs (think distribution and freight expenses to move goods). We'll keep a close eye on this.
Operating Margin
Operating margin is an important measure of profitability for retailers as it accounts for all expenses keeping the lights on, including wages, rent, advertising, and other administrative costs.
This quarter, Gap generated an operating profit margin of 5%, up 5.7 percentage points year on year. This increase was encouraging, and since the company's gross margin actually decreased, we can assume the rise was driven by a magnificent improvement in cost controls or operating leverage on fixed costs.
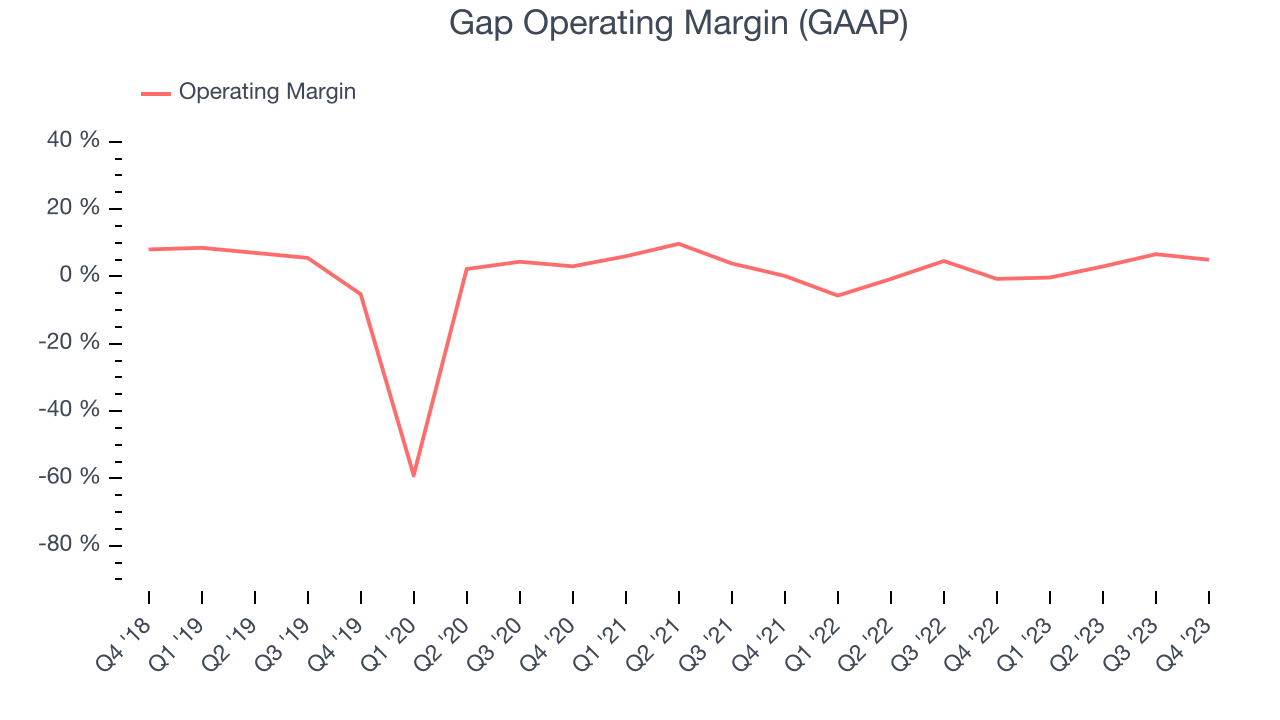
Zooming out, Gap over the last eight quarters but held back by its large expense base. Its average operating margin of 1.6% has been among the worst in consumer retail. However, Gap's margin has improved, on average, by 4.2 percentage points year on year, an encouraging sign for shareholders. The tide could be turning.
EPS
Earnings growth is a critical metric to track, but for long-term shareholders, earnings per share (EPS) is more telling because it accounts for dilution and share repurchases.
In Q4, Gap reported EPS at $0.37, up from negative $0.75 in the same quarter a year ago. This print beat Wall Street's estimates by 48.9%.
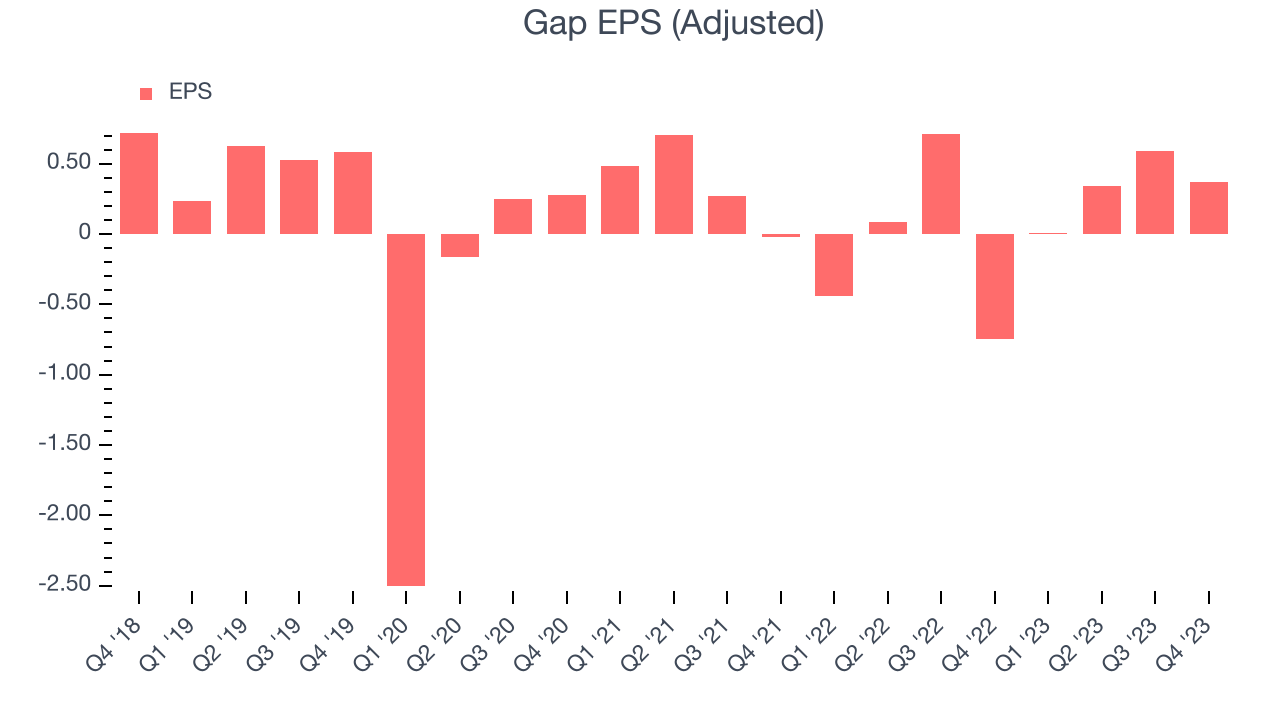
Between FY2019 and FY2023, Gap's adjusted diluted EPS dropped 33.7%, translating into 9.8% annualized declines. In a mature sector such as consumer retail, we tend to steer our readers away from companies with falling EPS. If there's no earnings growth, it's difficult to build confidence in a business's underlying fundamentals, leaving a low margin of safety around the company's valuation (making the stock susceptible to large downward swings).
Wall Street expects Gap to continue performing poorly over the next 12 months, with analysts projecting an average 8.4% year-on-year decline in EPS.
Return on Invested Capital (ROIC)
EPS and free cash flow tell us whether a company was profitable while growing revenue. But was it capital-efficient? A company’s ROIC explains this by showing how much operating profit a company makes compared to how much money the business raised (debt and equity).
Gap's five-year average ROIC was 3%, somewhat low compared to the best retail companies that consistently pump out 25%+. Its returns suggest it historically did a subpar job investing in profitable business initiatives.
The trend in its ROIC, however, is often what surprises the market and drives the stock price. Over the last two years, Gap's ROIC averaged 3.3 percentage point increases each year. This is a good sign and we hope the company can continue to improving.
Key Takeaways from Gap's Q4 Results
We were impressed by how significantly Gap blew past analysts' EPS expectations this quarter. We were also excited its gross margin outperformed Wall Street's estimates. Guidance for the upcoming year was relatively in line with expectations, likely sparking some relief from investors. Zooming out, we think this was a solid quarter. The stock is up 9.2% after reporting and currently trades at $21.1 per share.
Is Now The Time?
Gap may have had a good quarter, but investors should also consider its valuation and business qualities when assessing the investment opportunity.
We cheer for all companies serving consumers, but in the case of Gap, we'll be cheering from the sidelines. Its revenue has declined over the last four years, but at least growth is expected to increase in the short term. And while its gross margins indicate a healthy starting point for the overall profitability of the business, the downside is its relatively low ROIC suggests it has struggled to grow profits historically. On top of that, its shrinking same-store sales suggests it'll need to change its strategy to succeed.
Gap's price-to-earnings ratio based on the next 12 months is 16.1x. While the price is reasonable and there are some things to like about Gap, we think there are better opportunities elsewhere in the market right now.
Wall Street analysts covering the company had a one-year price target of $19.28 per share right before these results (compared to the current share price of $21.10).
To get the best start with StockStory, check out our most recent stock picks, and then sign up to our earnings alerts by adding companies to your watchlist here. We typically have the quarterly earnings results analyzed within seconds of the data being released, and especially for companies reporting pre-market, this often gives investors the chance to react to the results before the market has fully absorbed the information.