
Home improvement retail giant Home Depot (NYSE:HD) fell short of analysts' expectations in Q1 CY2024, with revenue down 2.3% year on year to $36.42 billion. It made a GAAP profit of $3.63 per share, down from its profit of $3.82 per share in the same quarter last year.
Home Depot (HD) Q1 CY2024 Highlights:
- Revenue: $36.42 billion vs analyst estimates of $36.65 billion (small miss)
- EPS: $3.63 vs analyst expectations of $3.59 (in line)
- Full year guidance calling for 1% revenue and EPS growth (in line for revenue, slightly below for EPS)
- Gross Margin (GAAP): 34.1%, up from 33.7% in the same quarter last year
- Free Cash Flow of $4.65 billion, similar to the same quarter last year
- Same-Store Sales were down 2.3% year on year (slight miss vs. expectations of down 2.0% year on year)
- Store Locations: 2,337 at quarter end, increasing by 13 over the last 12 months
- Market Capitalization: $337.9 billion
Founded and headquartered in Atlanta, Georgia, Home Depot (NYSE:HD) is a home improvement retailer that sells everything from tools to building materials to appliances.
The core customer is both the do-it-yourself (DIY) homeowner and the professional contractor. The broad range of high-quality products at competitive prices appeals to both types of customers. For the DIY shopper, Home Depot employs sales associates trained in specific areas such as tools, paint, and home appliances. Homeowners can also rent power tools or attend in-store workshops. For the professional contractor, Home Depot has loyalty programs and volume discounts. There is also a Pro Desk in most stores, where contractors can place large or custom orders and consult with specialists trained to specifically assist professionals.
The typical Home Depot store is between 100,000 and 200,000 square feet. Most stores are laid out in a similar way, with the entrance leading to the “action alley” where seasonal products (snow shovels during winter, potted flowers during spring) or promotions are placed. From there, the store is organized into departments such as lumber, plumbing, electrical, paint, and appliances. In addition to the main departments, Home Depot stores also feature service desks, which are staffed by store associates who assist with questions, purchases, returns, and exchanges.
Home Improvement Retailer
Home improvement retailers serve the maintenance and repair needs of do-it-yourself homeowners as well as professional contractors. Home is where the heart is, so any homeowner will want to keep that home in good shape by maintaining the yard, fixing leaks, or improving lighting fixtures, for example. Home improvement stores win with depth and breadth of product, in-store consultations for customers who need help, and services that cater to professionals. It is hard for non-focused retailers and e-commerce competitors to match these. However, the research, convenience, and prices of online platforms means they can’t be fully written off, either.
Home improvement retail competitors include Lowe’s (NYSE:LOW) and private company Ace Hardware. Amazon.com (NASDAQ:AMZN) and Wayfair (NYSE:W) also offer some home improvement products.Sales Growth
Home Depot is a behemoth in the consumer retail sector and benefits from economies of scale, an important advantage giving the business an edge in distribution and more negotiating power with suppliers.
As you can see below, the company's annualized revenue growth rate of 6.7% over the last five years was weak as its store footprint remained relatively unchanged.
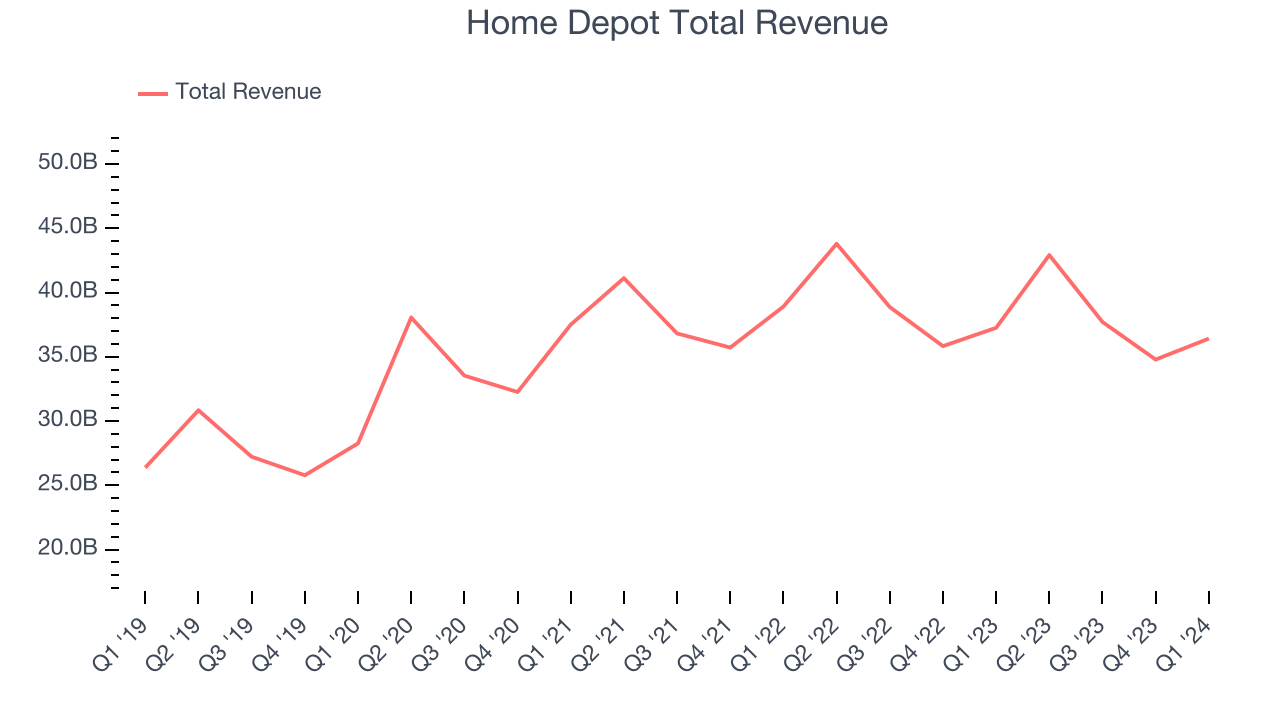
This quarter, Home Depot missed Wall Street's estimates and reported a rather uninspiring 2.3% year-on-year revenue decline, generating $36.42 billion in revenue. Looking ahead, Wall Street expects sales to grow 2.6% over the next 12 months, an acceleration from this quarter.
Same-Store Sales
Home Depot's demand has been shrinking over the last eight quarters, and on average, its same-store sales have declined by 0.7% year on year. This performance is quite concerning and the company should reconsider its strategy before investing its precious capital into new store buildouts.
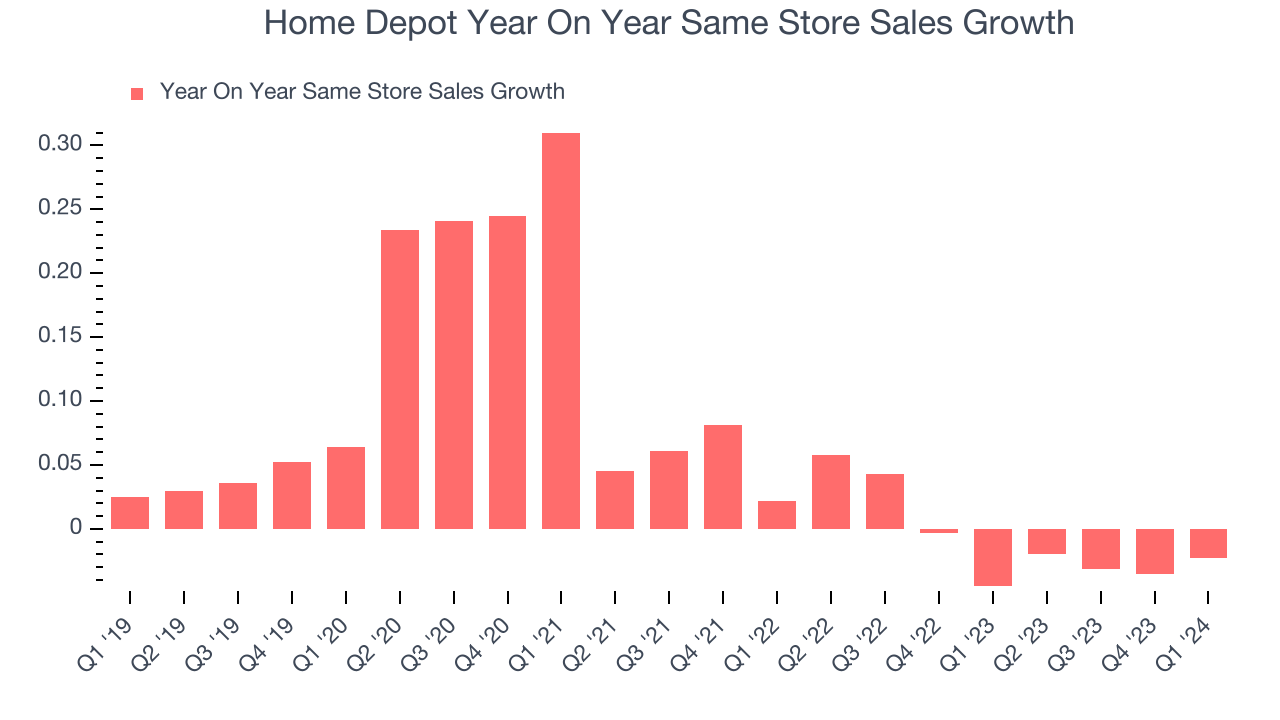
In the latest quarter, Home Depot's same-store sales fell 2.3% year on year. This decrease was a further deceleration from the 4.5% year-on-year decline it posted 12 months ago. We hope the business can get back on track.
Number of Stores
The number of stores a retailer operates is a major factor of how much it can sell and its growth is a critical driver of how quickly its sales can grow.
When a retailer like Home Depot keeps its store footprint steady, it usually means that demand is stable and it's focused on improving operational efficiency to increase profitability. At the end of this quarter, Home Depot operated 2,337 total retail locations, in line with its store count 12 months ago.
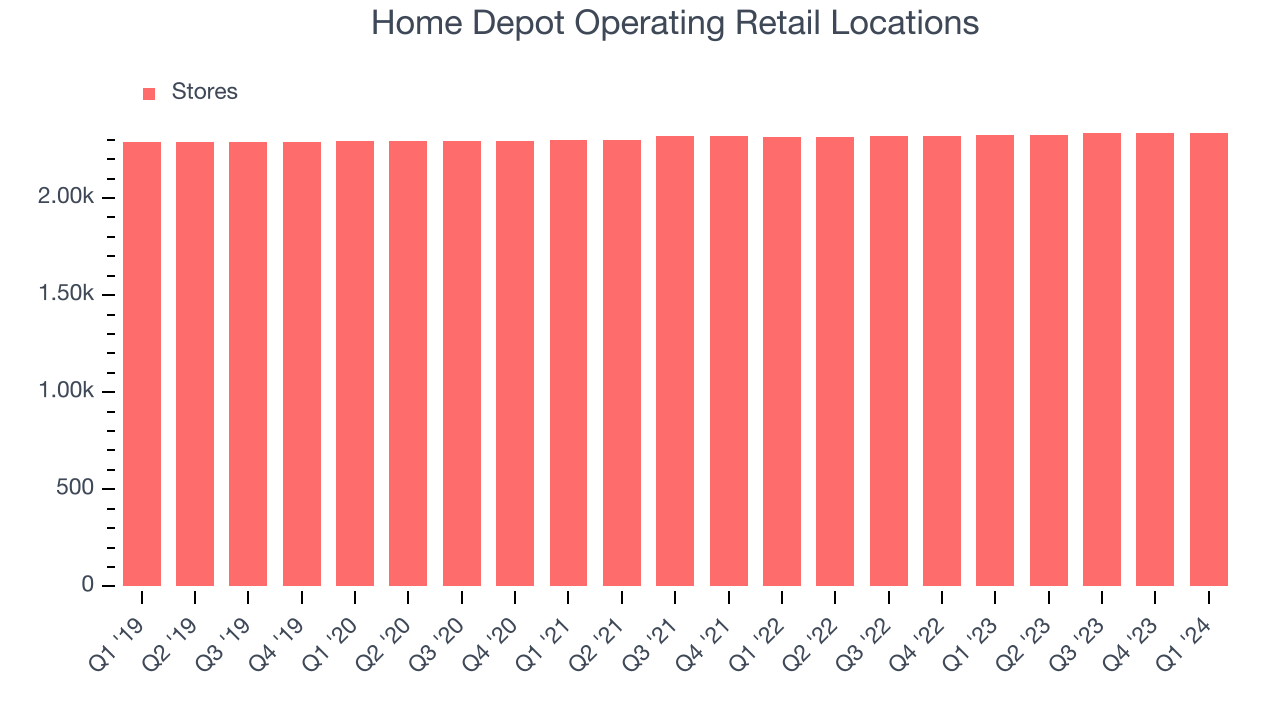
Taking a step back, the company has kept its physical footprint more or less flat over the last two years while other consumer retail businesses have opted for growth. A flat store base means that revenue growth must come from increased e-commerce sales or higher foot traffic and sales per customer at existing stores.
Gross Margin & Pricing Power
Gross profit margins tell us how much money a retailer gets to keep after paying for the goods it sells.
Home Depot has subpar unit economics for a retailer, making it difficult to invest in areas such as marketing and talent to grow its brand. As you can see below, it's averaged a paltry 33.5% gross margin over the last two years. This means the company makes $0.33 for every $1 in revenue before accounting for its operating expenses.
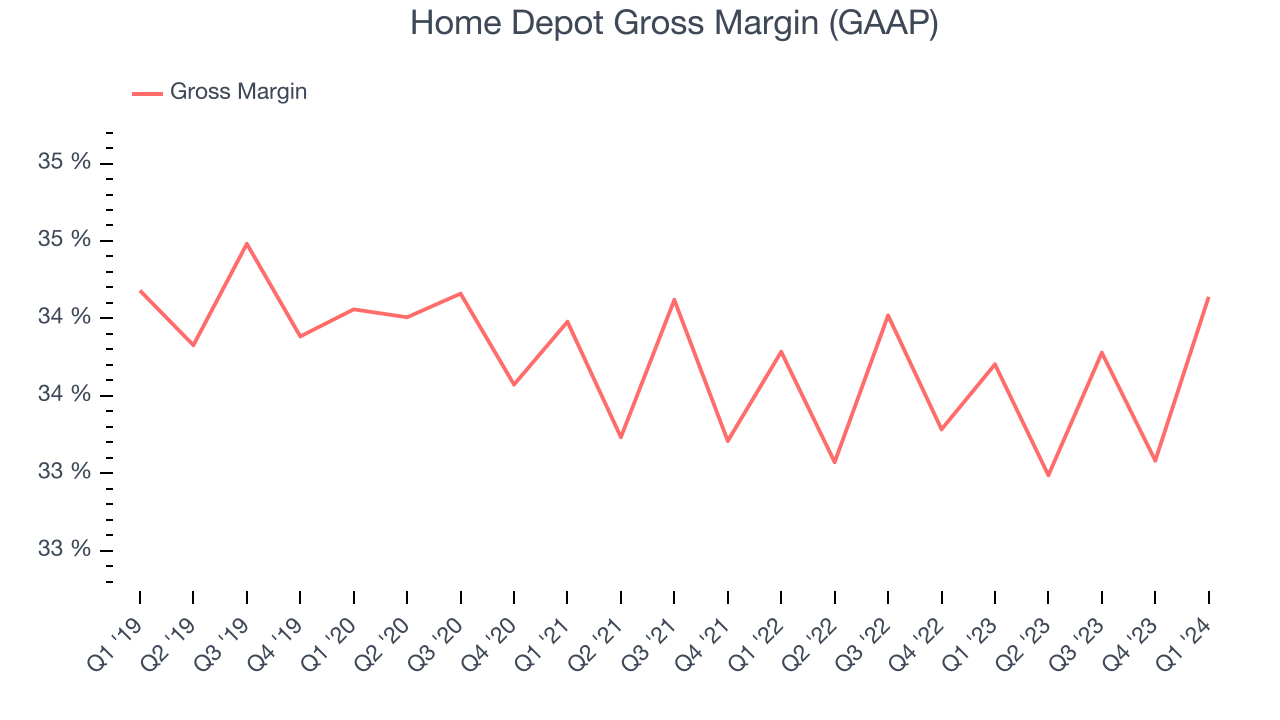
Home Depot's gross profit margin came in at 34.1% this quarter, flat with the same quarter last year. This steady margin stems from its efforts to keep prices low for consumers and signals that it has stable input costs (such as freight expenses to transport goods).
Operating Margin
Operating margin is an important measure of profitability for retailers as it accounts for all expenses keeping the lights on, including wages, rent, advertising, and other administrative costs.
This quarter, Home Depot generated an operating profit margin of 13.9%, in line with the same quarter last year. This indicates the company's costs have been relatively stable.
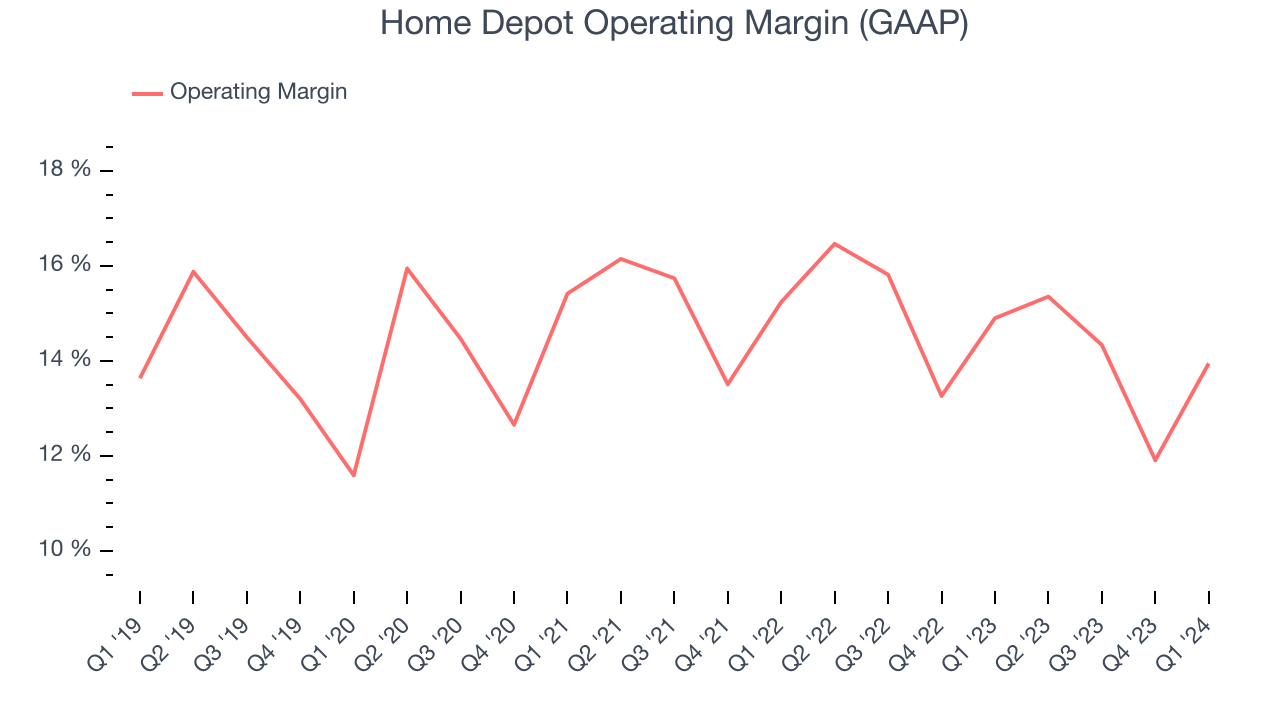 Zooming out, Home Depot has exercised operational efficiency over the last eight quarters. The company has demonstrated it can be wildly profitable for a consumer retail business, boasting an average operating margin of 14.6%. However, Home Depot's margin has slightly declined by 1.2 percentage points year on year (on average). This shows the company has faced some small speed bumps along the way. The company's operating profitability was particularly impressive because of its low gross margin. This margin is mostly a factor of what Home Depot sells and takes fundamental shifts to move meaningfully. Companies have more control over their operating margins, and it signals strength if they're high when gross margins are low (like for Home Depot).
EPS
Earnings growth is a critical metric to track, but for long-term shareholders, earnings per share (EPS) is more telling because it accounts for dilution and share repurchases.
In Q1, Home Depot reported EPS at $3.63, down from $3.82 in the same quarter a year ago. This print was close to Wall Street's estimates, meaning the result was likely already priced into the stock because investors were aware of expectations and traded accordingly.
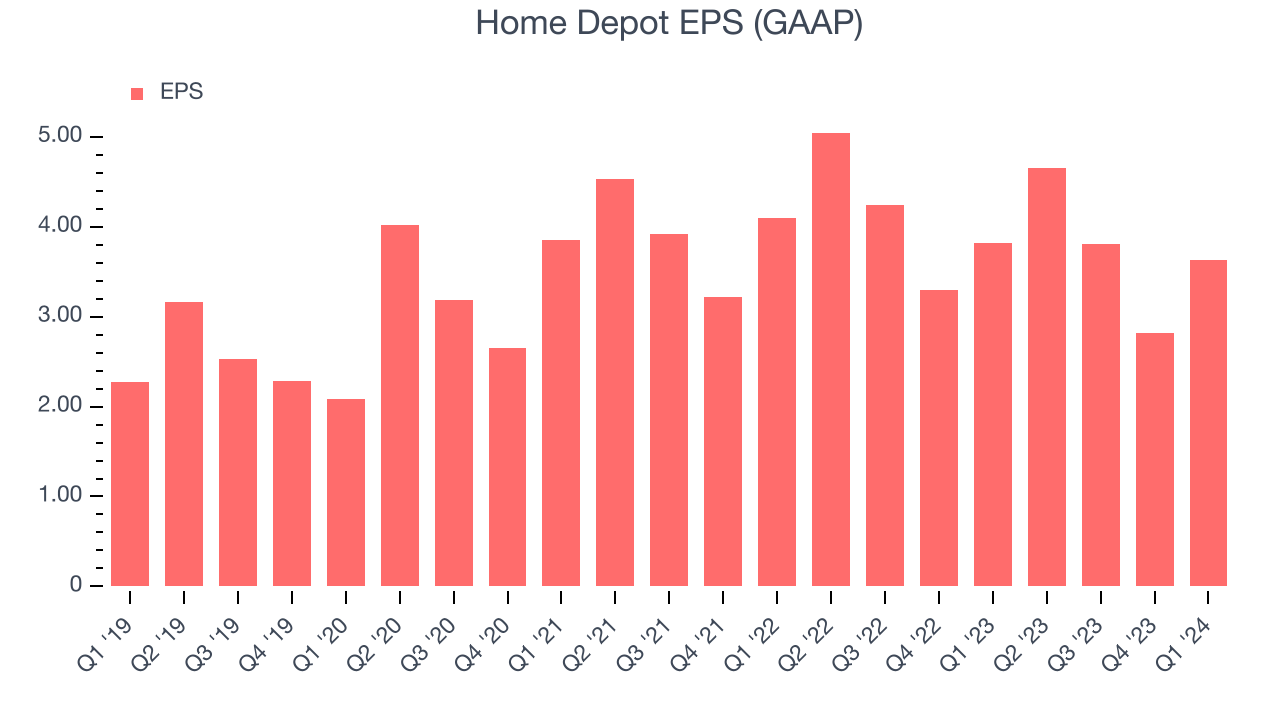
On the bright side, Wall Street expects the company to continue growing earnings over the next 12 months, with analysts projecting an average 4.8% year-on-year increase in EPS.
Cash Is King
If you've followed StockStory for a while, you know that we emphasize free cash flow. Why, you ask? We believe in the end, cash is king, and you can't use accounting profits to pay the bills.
Home Depot's free cash flow came in at $4.65 billion in Q1, in line with the same quarter last year. This result represents a 12.8% free cash flow margin.
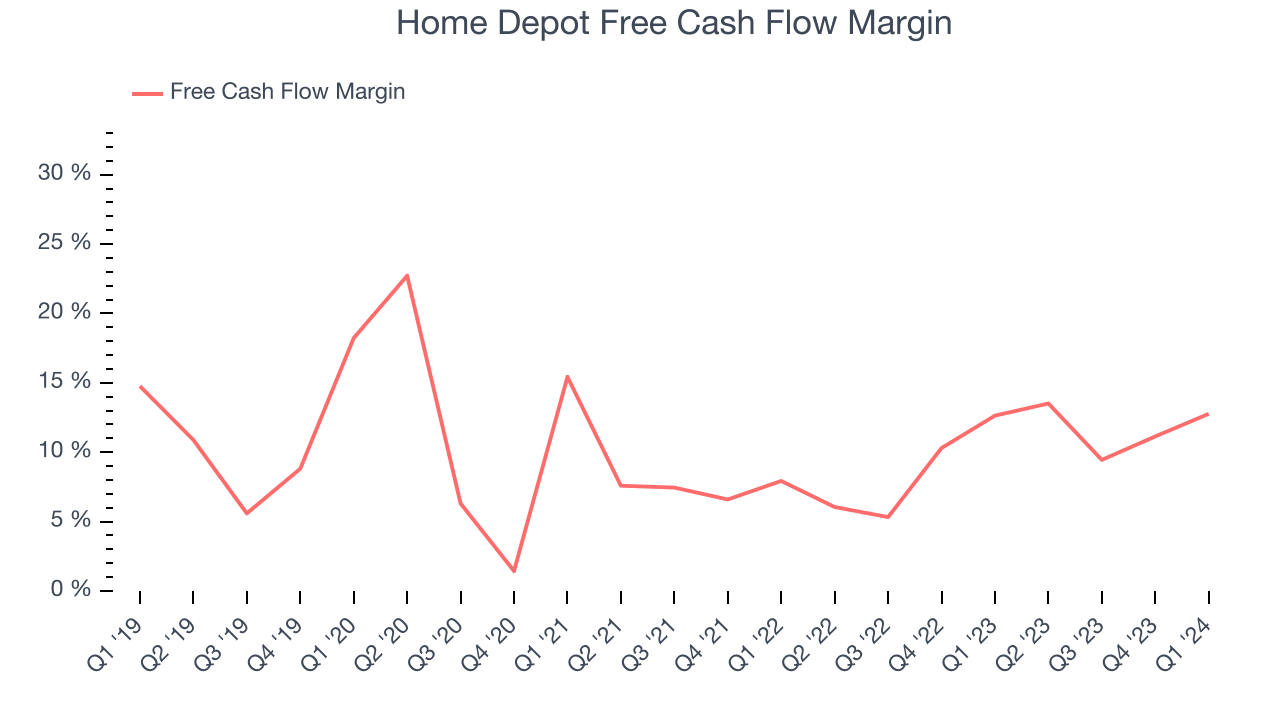
Over the last eight quarters, Home Depot has shown terrific cash profitability, enabling it to reinvest, return capital to investors, and stay ahead of the competition while maintaining a robust cash balance. The company's free cash flow margin has been among the best in consumer retail, averaging 10.1%. Furthermore, its margin has averaged year-on-year increases of 3.4 percentage points. This likely pleases the company's investors.
Return on Invested Capital (ROIC)
EPS and free cash flow tell us whether a company was profitable while growing revenue. But was it capital-efficient? A company’s ROIC explains this by showing how much operating profit a company makes compared to how much money the business raised (debt and equity).
Home Depot's five-year average ROIC was 42.5%, placing it among the best retail companies. Just as you’d like your investment dollars to generate returns, Home Depot's invested capital has produced excellent profits.
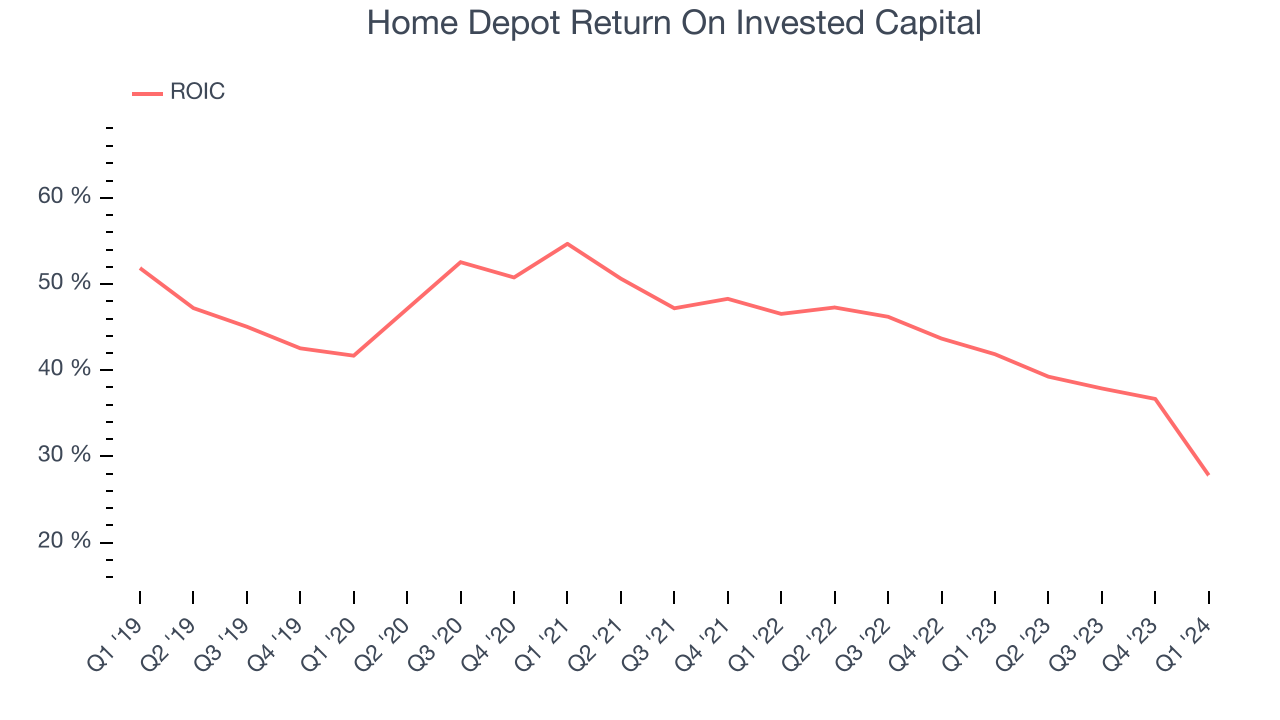
The trend in its ROIC, however, is often what surprises the market and drives the stock price. Unfortunately, Home Depot's ROIC averaged 13.3 percentage point decreases over the last few years. We like what management has done historically but are concerned its ROIC is declining, perhaps a symptom of waning business opportunities to invest profitably.
Balance Sheet Risk
As long-term investors, the risk we care most about is the permanent loss of capital. This can happen when a company goes bankrupt or raises money from a disadvantaged position and is separate from short-term stock price volatility, which we are much less bothered by.
Home Depot reported $4.26 billion of cash and $51.01 billion of debt on its balance sheet in the most recent quarter. As investors in high-quality companies, we primarily focus on two things: 1) that a company's debt level isn't too high and 2) that its interest payments are not excessively burdening the business.
With $23.93 billion of EBITDA over the last 12 months, we view Home Depot's 2.0x net-debt-to-EBITDA ratio as safe. We also see its $896 million of annual interest expenses as appropriate. The company's profits give it plenty of breathing room, allowing it to continue investing in new initiatives.
Key Takeaways from Home Depot's Q1 Results
Home Depot's revenue missed analysts' expectations, although the difference was quite small. EPS was in line. Looking ahead, the company guided to 1% year on year growth for both full year revenue and EPS. The former was in line while the latter was slightly below expectations. Overall, this was an unexciting quarter for Home Depot, with the company calling out a "delayed start to spring and continued softness in certain larger discretionary projects". The stock is flat after reporting and currently trades at $338 per share.
Is Now The Time?
When considering an investment in Home Depot, investors should take into account its valuation and business qualities as well as what's happened in the latest quarter.
We have other favorites, but we understand the arguments that Home Depot isn't a bad business. Although its revenue growth has been a little slower over the last five years with analysts expecting growth to slow from here, its powerful free cash flow generation enables it to stay ahead of the competition through consistent reinvestment of profits. Investors should still be cautious, however, as its shrinking same-store sales suggests it'll need to change its strategy to succeed.
Home Depot's price-to-earnings ratio based on the next 12 months is 21.8x. We don't really see a big opportunity in the stock at the moment, but in the end, beauty is in the eye of the beholder. If you like Home Depot, it seems to be trading at a reasonable price.
Wall Street analysts covering the company had a one-year price target of $382.82 per share right before these results (compared to the current share price of $338).
To get the best start with StockStory, check out our most recent stock picks, and then sign up to our earnings alerts by adding companies to your watchlist here. We typically have the quarterly earnings results analyzed within seconds of the data being released, and especially for companies reporting pre-market, this often gives investors the chance to react to the results before the market has fully absorbed the information.