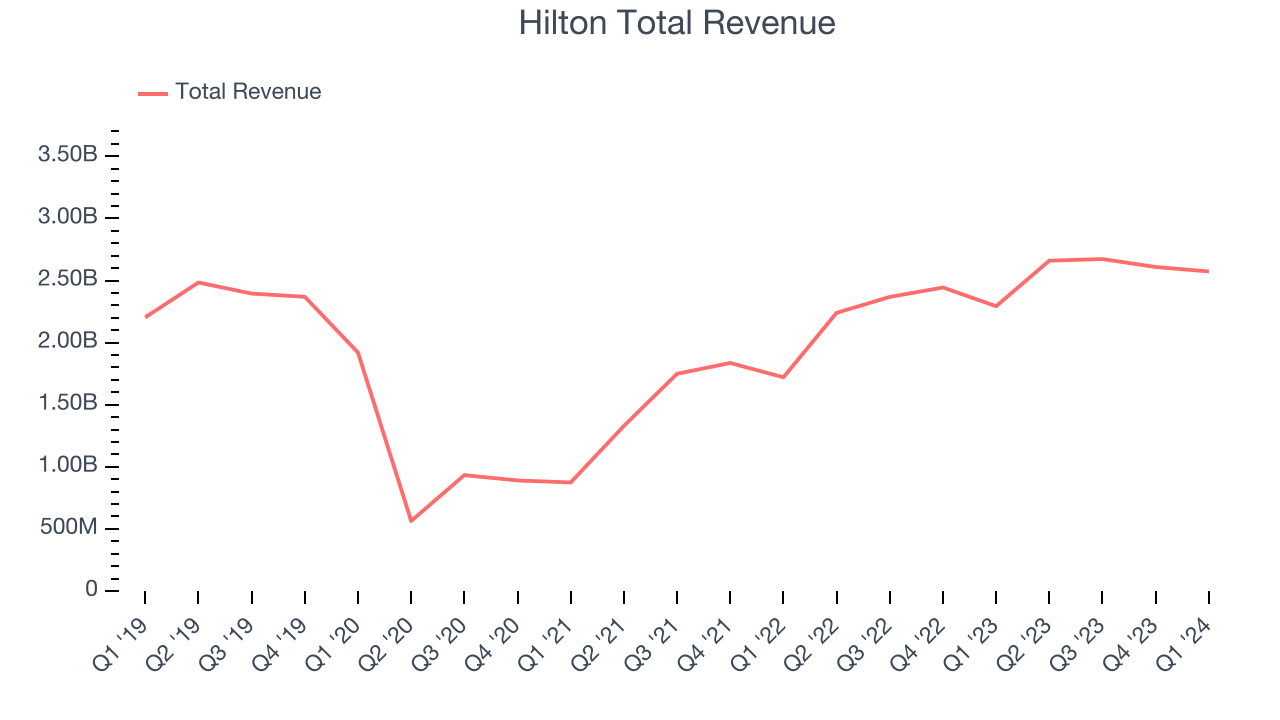
Hotel company Hilton (NYSE:HLT) reported Q1 CY2024 results exceeding Wall Street analysts' expectations, with revenue up 12.2% year on year to $2.57 billion. It made a non-GAAP profit of $1.53 per share, improving from its profit of $1.24 per share in the same quarter last year.
Hilton (HLT) Q1 CY2024 Highlights:
- Revenue: $2.57 billion vs analyst estimates of $2.53 billion (1.7% beat)
- EPS (non-GAAP): $1.53 vs analyst estimates of $1.42 (8% beat)
- EPS (non-GAAP) Guidance for Q2 CY2024 is $1.83 at the midpoint, below analyst estimates of $1.88
- Gross Margin (GAAP): 90.4%, up from 89.1% in the same quarter last year
- Free Cash Flow of $330 million, down 22% from the previous quarter
- Market Capitalization: $51.18 billion
Founded in 1919, Hilton Worldwide (NYSE:HLT) is a global hospitality company with a portfolio of hotel brands.
As one of the largest hotel companies in the world, Hilton owns, manages, and franchises a portfolio of 18 brands, comprising more than 6,500 properties in 119 countries and territories.
Hilton's diverse portfolio caters to many market segments, from luxury and full-service hotels to extended-stay suites and no-frills hotels. The company’s notable brands include its flagship Hilton, Waldorf Astoria, and DoubleTree hotels. Medium-tier offerings include Embassy Suites while Hilton Garden Inn and Hampton are for more casual stays. Its extended-stay brands include Homewood Suites by Hilton and Home2 Suites by Hilton.
Given its scale, financial resources, and insights about the global traveler, Hilton has adopted technology to enhance the customer journey, from the booking process to the end of a hotel stay. This includes online check-in, room selection, and integration with loyalty programs.
Hilton’s business model is primarily focused on a franchise system, which allows for wide-reaching growth and presence while maintaining high standards across its properties. This model has been pivotal in Hilton’s global expansion and brand recognition.
Hotels, Resorts and Cruise Lines
Hotels, resorts, and cruise line companies often sell experiences rather than tangible products, and in the last decade-plus, consumers have slowly shifted from buying "things" (wasteful) to buying "experiences" (memorable). In addition, the internet has introduced new ways of approaching leisure and lodging such as booking homes and longer-term accommodations. Traditional hotel, resorts, and cruise line companies must innovate to stay relevant in a market rife with innovation.
Hilton’s primary competitors include Marriott International (NASDAQ:MAR), InterContinental Hotels Group (NYSE:IHG), Hyatt Hotels (NYSE:H), Wyndham Hotels & Resorts (NYSE:WH), and Accor (EPA:AC).Sales Growth
Reviewing a company's long-term performance can reveal insights into its business quality. Any business can have short-term success, but a top-tier one sustains growth for years. Hilton's annualized revenue growth rate of 3.1% over the last five years was weak for a consumer discretionary business.  Within consumer discretionary, a long-term historical view may miss a company riding a successful new property or emerging trend. That's why we also follow short-term performance. Hilton's annualized revenue growth of 25.9% over the last two years is above its five-year trend, suggesting some bright spots.
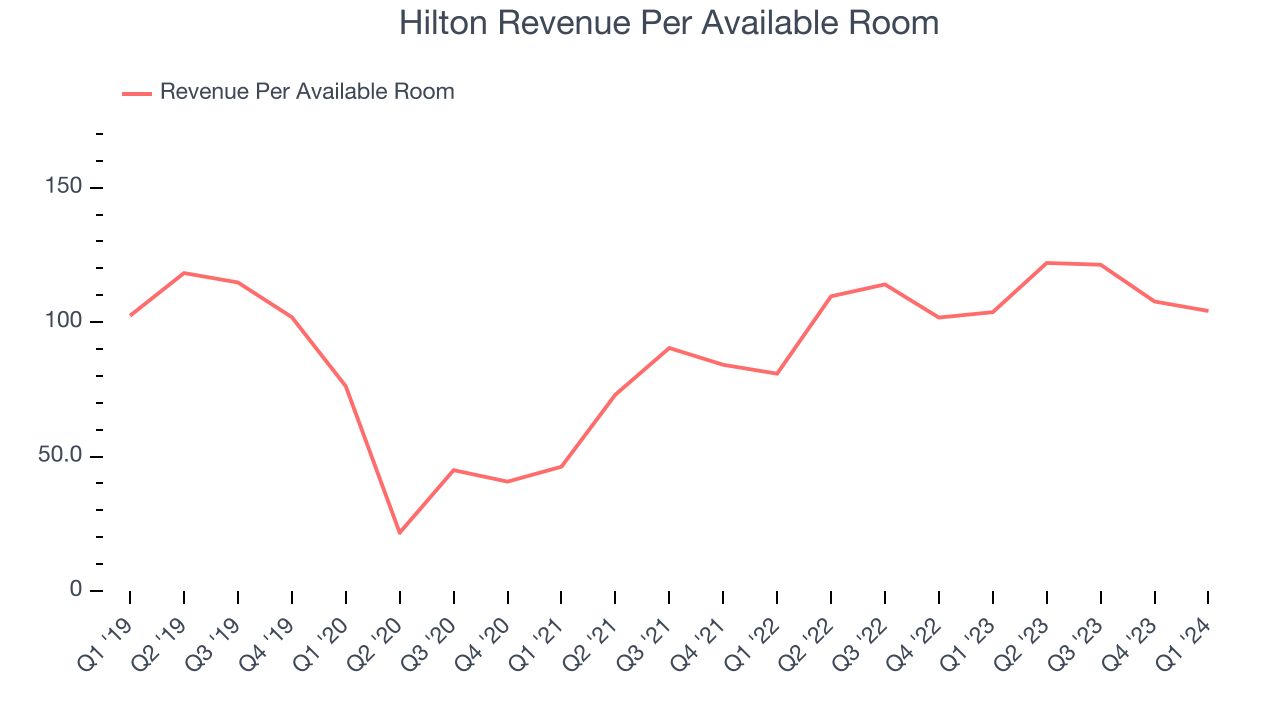
We can dig even further into the company's revenue dynamics by analyzing its revenue per available room, which clocked in at $104.16 this quarter and is a key metric accounting for average daily rates and occupancy levels. Over the last two years, Hilton's revenue per room averaged 18.7% year-on-year growth. Because this number is lower than its revenue growth, we can see its sales from other areas like restaurants, bars, and amenities outperformed its room bookings. 
This quarter, Hilton reported robust year-on-year revenue growth of 12.2%, and its $2.57 billion of revenue exceeded Wall Street's estimates by 1.7%. Looking ahead, Wall Street expects sales to grow 9.9% over the next 12 months, a deceleration from this quarter.
Operating Margin
Operating margin is an important measure of profitability. It’s the portion of revenue left after accounting for all core expenses–everything from the cost of goods sold to advertising and wages. Operating margin is also useful for comparing profitability across companies with different levels of debt and tax rates because it excludes interest and taxes.
Hilton has been a well-oiled machine over the last two years. It's demonstrated elite profitability for a consumer discretionary business, boasting an average operating margin of 22.6%.This quarter, Hilton generated an operating profit margin of 20.7%, down 1 percentage points year on year.
Over the next 12 months, Wall Street expects Hilton to become more profitable. Analysts are expecting the company’s LTM operating margin of 21.5% to rise to 25.6%.EPS
We track long-term historical earnings per share (EPS) growth for the same reason as long-term revenue growth. Compared to revenue, however, EPS highlights whether a company's growth was profitable.
Over the last five years, Hilton's EPS grew 113%, translating into a solid 16.3% compounded annual growth rate. This performance is materially higher than its 3.1% annualized revenue growth over the same period. Let's dig into why.
While we mentioned earlier that Hilton's operating margin declined this quarter, a five-year view shows its margin has expanded 6.6 percentage points while its share count has shrunk 13.6%. Improving profitability and share buybacks are positive signs as they juice EPS growth relative to revenue growth.In Q1, Hilton reported EPS at $1.53, up from $1.24 in the same quarter last year. This print beat analysts' estimates by 8%. Over the next 12 months, Wall Street expects Hilton to grow its earnings. Analysts are projecting its LTM EPS of $6.51 to climb by 12.6% to $7.33.
Cash Is King
If you've followed StockStory for a while, you know we emphasize free cash flow. Why, you ask? We believe that in the end, cash is king, and you can't use accounting profits to pay the bills.
Over the last two years, Hilton has shown strong cash profitability, giving it an edge over its competitors and the option to reinvest or return capital to investors while keeping cash on hand for emergencies. The company's free cash flow margin has averaged 18%, quite impressive for a consumer discretionary business.
Hilton's free cash flow came in at $330 million in Q1, equivalent to a 12.8% margin and up 15.4% year on year.
Return on Invested Capital (ROIC)
EPS and free cash flow tell us whether a company was profitable while growing revenue. But was it capital-efficient? A company’s ROIC explains this by showing how much operating profit a company makes compared to how much money the business raised (debt and equity).
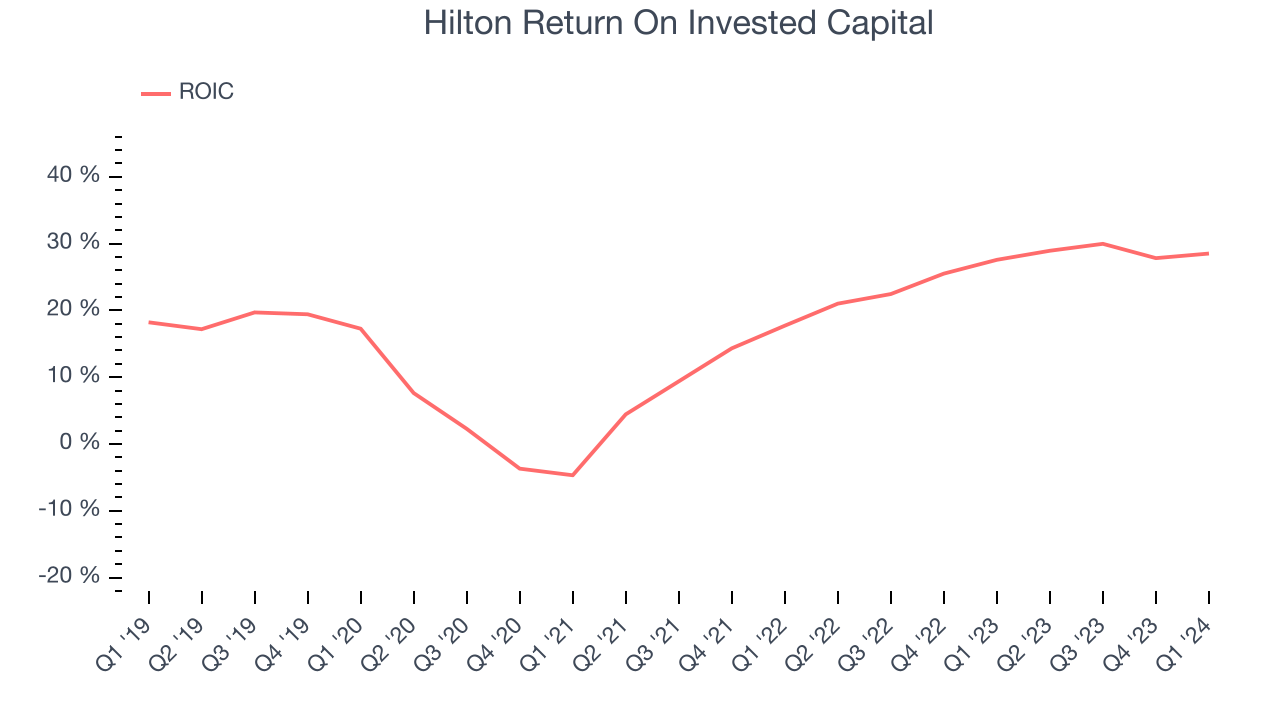
Hilton's five-year average return on invested capital was 17.3%, higher than most consumer discretionary companies. Just as you’d like your investment dollars to generate returns, Hilton's invested capital has produced solid profits.

The trend in its ROIC, however, is often what surprises the market and drives the stock price. Over the last few years, Hilton's ROIC has significantly increased. The company has historically shown the ability to generate good returns, and its rising ROIC is a great sign. It could suggest its competitive advantage or profitable business opportunities are expanding.
Balance Sheet Risk
As long-term investors, the risk we care most about is the permanent loss of capital. This can happen when a company goes bankrupt or raises money from a disadvantaged position and is separate from short-term stock price volatility, which we are much less bothered by.
Hilton reported $1.42 billion of cash and $10.17 billion of debt on its balance sheet in the most recent quarter. As investors in high-quality companies, we primarily focus on two things: 1) that a company's debt level isn't too high and 2) that its interest payments are not excessively burdening the business.
With $3.20 billion of EBITDA over the last 12 months, we view Hilton's 2.7x net-debt-to-EBITDA ratio as safe. We also see its $479 million of annual interest expenses as appropriate. The company's profits give it plenty of breathing room, allowing it to continue investing in new initiatives.
Key Takeaways from Hilton's Q1 Results
It was good to see Hilton beat analysts' revenue and EPS expectations this quarter. Additionally, adjusted EBITDA guidance for the full year 2024 was raised and came in above expectations. On the other hand, its operating margin missed and its full-year earnings guidance fell short of Wall Street's estimates. While not perfect, this was still a solid quarter for Hilton. The stock is up 1.7% after reporting and currently trades at $200.5 per share.
Is Now The Time?
When considering an investment in Hilton, investors should take into account its valuation and business qualities as well as what's happened in the latest quarter.
We think Hilton is a solid business. Although its revenue growth has been weak over the last five years, its growth over the next 12 months is expected to be higher. On top of that, its impressive operating margins show it has a highly efficient business model, and its strong free cash flow generation allows it to invest in growth initiatives while maintaining an ample cash cushion.
Hilton's price-to-earnings ratio based on the next 12 months is 27.9x. There are definitely things to like about Hilton and there's no doubt it's a bit of a market darling, at least for some investors. But when considering the company against the backdrop of the consumer discretionary landscape, it seems there's a lot of optimism already priced in. We wonder if there are better opportunities elsewhere right now.
Wall Street analysts covering the company had a one-year price target of $213.04 per share right before these results (compared to the current share price of $204.50).
To get the best start with StockStory, check out our most recent stock picks, and then sign up for our earnings alerts by adding companies to your watchlist here. We typically have the quarterly earnings results analyzed within seconds of the data being released, and especially for companies reporting pre-market, this often gives investors the chance to react to the results before the market has fully absorbed the information.
