
Boat and marine products retailer MarineMax (NYSE:HZO) fell short of analysts' expectations in Q1 CY2024, with revenue up 2.2% year on year to $582.9 million. It made a non-GAAP profit of $0.18 per share, down from its profit of $1.23 per share in the same quarter last year.
MarineMax (HZO) Q1 CY2024 Highlights:
- Revenue: $582.9 million vs analyst estimates of $590.2 million (1.2% miss)
- EPS (non-GAAP): $0.18 vs analyst estimates of $0.67 (-$0.49 miss)
- Gross Margin (GAAP): 32.7%, down from 35.2% in the same quarter last year
- Same-Store Sales were up 2% year on year
- Store Locations: 83 at quarter end, increasing by 5 over the last 12 months
- Market Capitalization: $606.1 million
Appropriately headquartered in Clearwater, Florida, MarineMax (NYSE:HZO) sells boats, yachts, and other marine products.
The company’s product offering includes boats from many prestigious manufacturers such as Sea Ray, Boston Whaler, Azimut, and Galeon. In addition, MarineMax provides services such as financing, insurance, maintenance, and repair to make it a one-stop shop for recreational boating.
The core customer is an affluent individual or family who's interested in marine activities and has the proximity or access to water to use the company’s products. These customers are looking for high-quality products that offer some combination of luxury and performance. They also often demand personalized support and assistance through the life of their boats or yachts.
The average MarineMax store is around 30,000 square feet and typically located in prime waterfront locations such as marinas and harbors. The layout of stores is open and spacious, with ample room for display. MarineMax launched its e-commerce platform in 2018, and the platform allows customers to browse–including virtual tours and video consultations–and purchase products online. Customers can also access financing and insurance services through the website.
Boat & Marine Retailer
Retailers that sell boats and marine products sell products, sure, but they also sell an image and lifestyle to an often wealthier customer. Unlike a car–which many use daily to get to/from work and to run personal and family errands–a boat or yacht is certainly a discretionary, luxury, nice-to-have purchase. While there is online competition, especially for research and discovery, the boat and yacht market is still very brick-and-mortar based given the magnitude of the purchase and the logistical costs associated with moving these products over long distances.
Competitors offering recreational marine products include OneWater Marine (NASDAQ:ONEW), Yamaha Motor Co. (TSE:7272), and Brunswick Corp (NYSE:BC).Sales Growth
MarineMax is a small retailer, which sometimes brings disadvantages compared to larger competitors that benefit from economies of scale.
As you can see below, the company's annualized revenue growth rate of 14.8% over the last five years was solid despite not opening many new stores, implying that growth was driven by increased sales at existing, established stores.
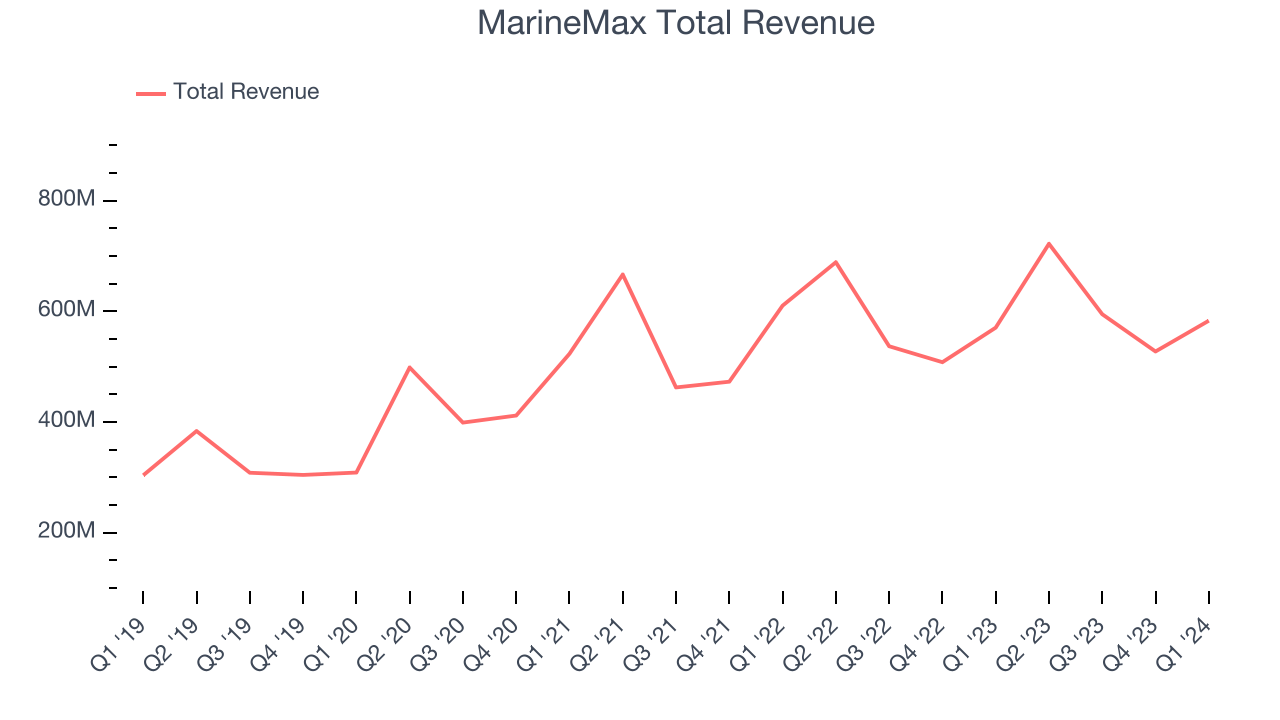
This quarter, MarineMax's revenue grew 2.2% year on year to $582.9 million, falling short of Wall Street's estimates. Looking ahead, Wall Street expects sales to grow 3.3% over the next 12 months, an acceleration from this quarter.
Same-Store Sales
Same-store sales growth is a key performance indicator used to measure organic growth and demand for retailers.
MarineMax's demand within its existing stores has barely increased over the last eight quarters. On average, the company's same-store sales growth has been flat.
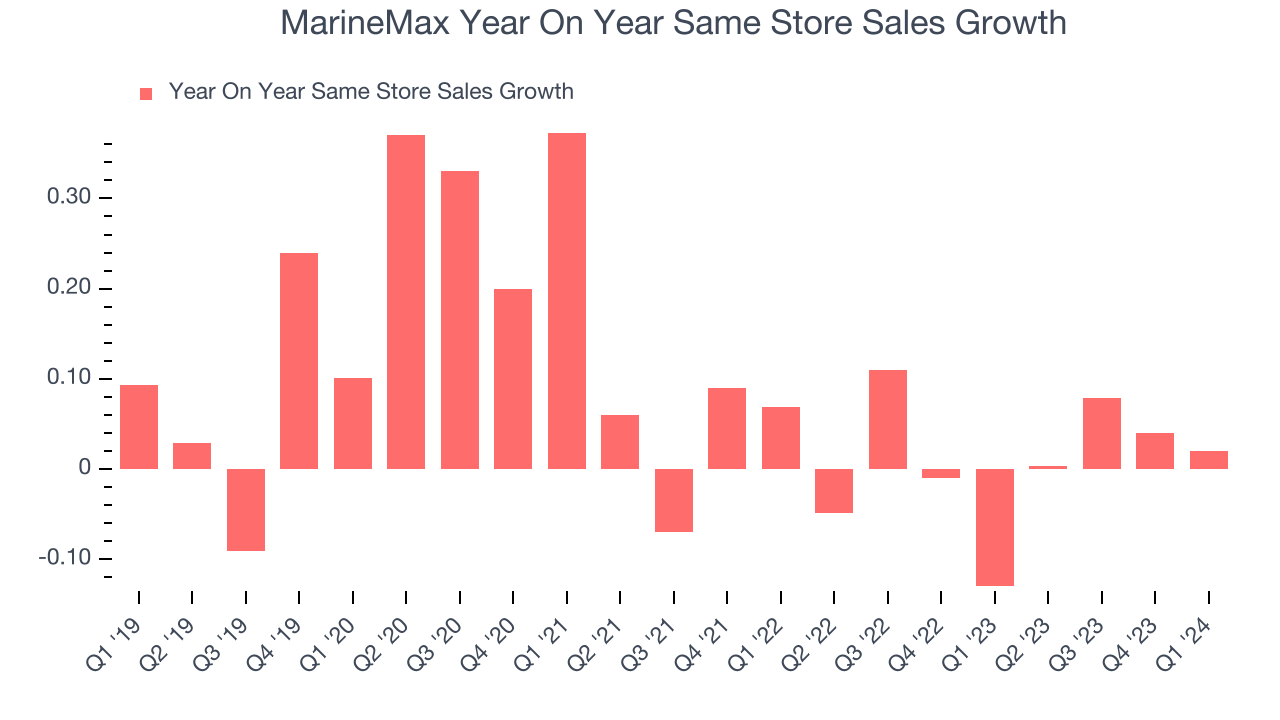
In the latest quarter, MarineMax's same-store sales rose 2% year on year. This growth was a well-appreciated turnaround from the 13% year-on-year decline it posted 12 months ago, showing the business is regaining momentum.
Number of Stores
When a retailer like MarineMax keeps its store footprint steady, it usually means that demand is stable and it's focused on improving operational efficiency to increase profitability. MarineMax's store count increased by 5 locations, or 6.4%, over the last 12 months to 83 total retail locations in the most recently reported quarter.
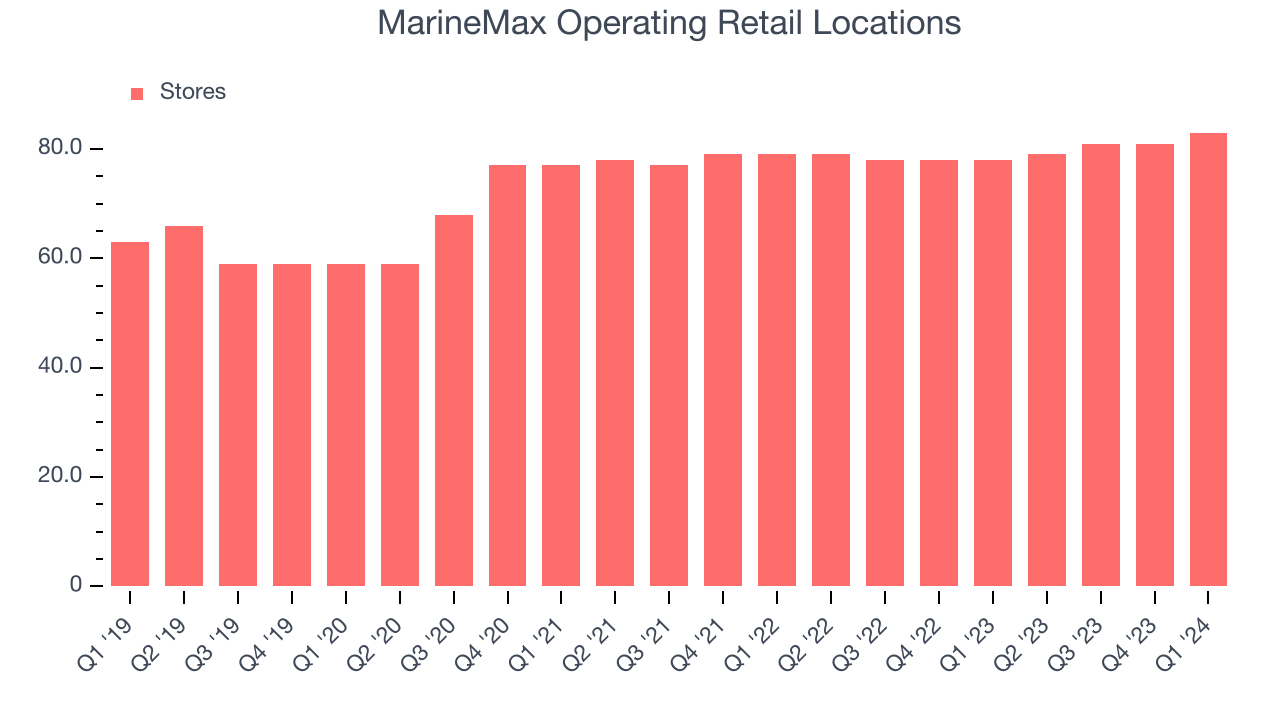
Taking a step back, the company has only opened a few new stores over the last eight quarters, averaging 1.8% annual growth in new locations. Although it's expanded its presence, this sluggish store growth lags other retailers. A flat store base means that revenue growth must come from increased e-commerce sales or higher foot traffic and sales per customer at existing stores.
Gross Margin & Pricing Power
MarineMax has subpar unit economics for a retailer, making it difficult to invest in areas such as marketing and talent to grow its brand. As you can see below, it's averaged a paltry 34.6% gross margin over the last two years. This means the company makes $0.35 for every $1 in revenue before accounting for its operating expenses.
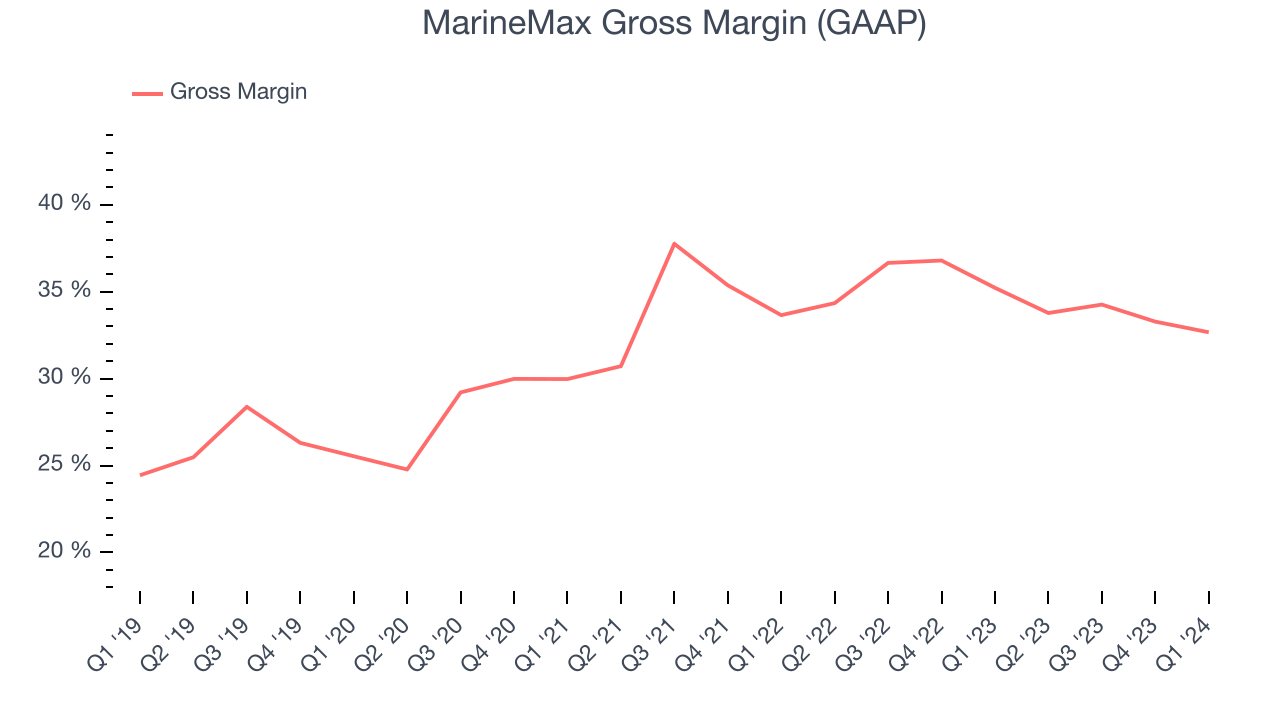
MarineMax produced a 32.7% gross profit margin in Q1, marking a 2.6 percentage point decrease from 35.2% in the same quarter last year. One quarter of margin contraction shouldn't worry investors as a retailer's gross margin can often change due to factors such as product discounting and dynamic input costs (think distribution and freight expenses to move goods).
Operating Margin
Operating margin is a key profitability metric for retailers because it accounts for all expenses keeping the lights on, including wages, rent, advertising, and other administrative costs.
In Q1, MarineMax generated an operating profit margin of 3.7%, down 6 percentage points year on year. We can infer MarineMax was less efficient with its expenses or had lower leverage on its fixed costs because its operating margin decreased more than its gross margin.
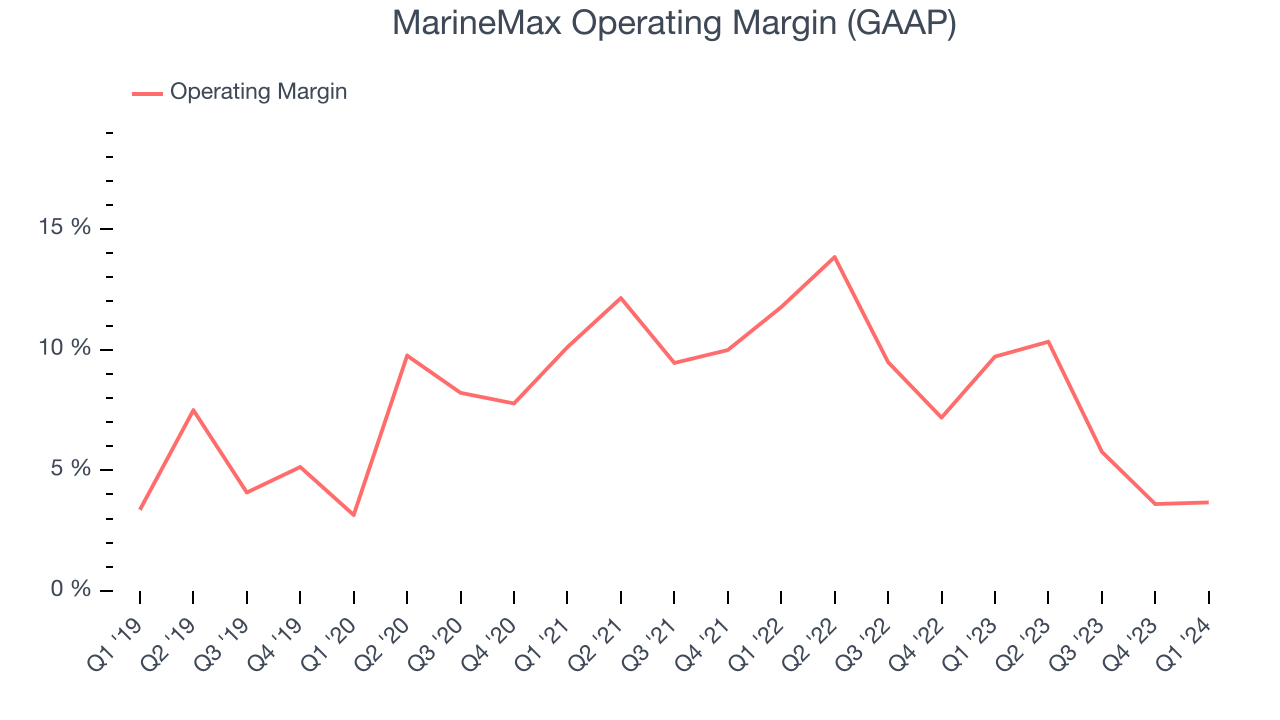 Zooming out, MarineMax has done a decent job managing its expenses over the last eight quarters. It's produced an average operating margin of 8.2%, higher than the broader consumer retail sector. However, MarineMax's margin has declined by 4.2 percentage points year on year (on average). Although this isn't the end of the world, some investors were likely hoping for better results.
 EPS
These days, some companies issue new shares like there's no tomorrow. That's why we like to track earnings per share (EPS) because it accounts for shareholder dilution and share buybacks.
In Q1, MarineMax reported EPS at $0.18, down from $1.23 in the same quarter a year ago. This print unfortunately missed Wall Street's estimates, but we care more about long-term EPS growth rather than short-term movements.
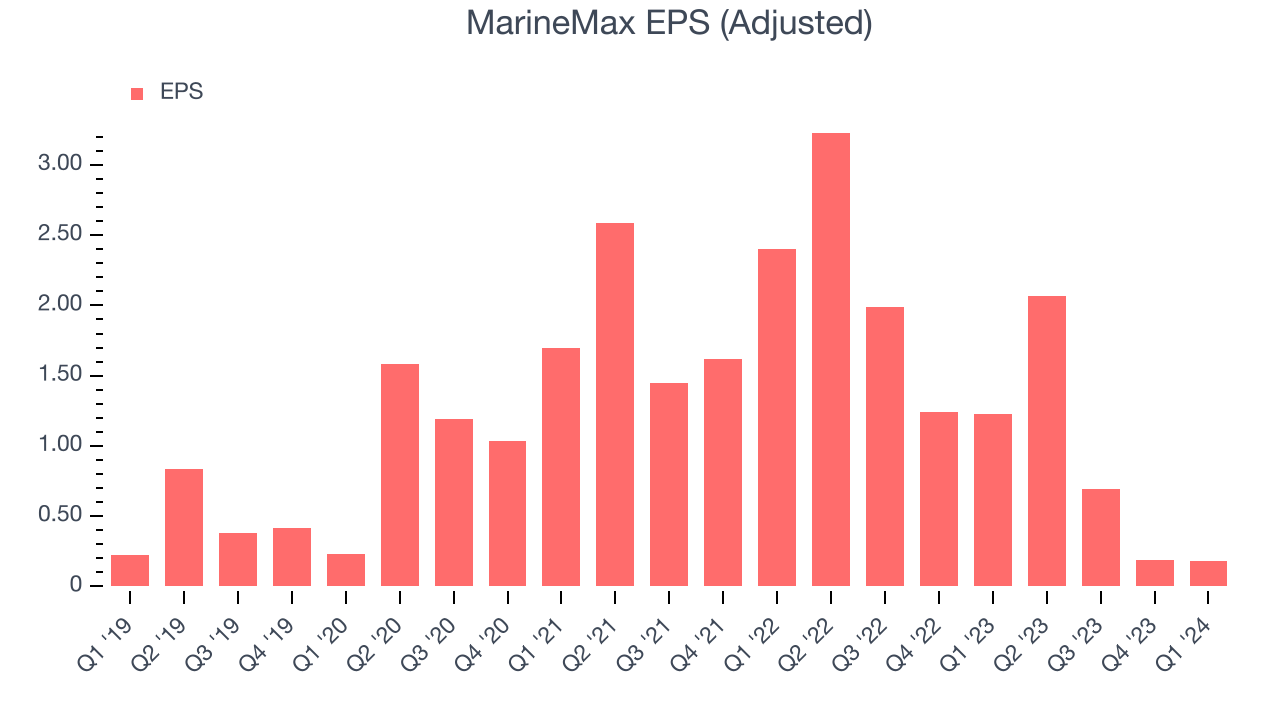
Wall Street expects the company to continue growing earnings over the next 12 months, with analysts projecting an average 20.8% year-on-year increase in EPS.
Return on Invested Capital (ROIC)
EPS and free cash flow tell us whether a company was profitable while growing revenue. But was it capital-efficient? Enter ROIC, a metric showing how much operating profit a company generates relative to how much money the business raised (debt and equity).
MarineMax's five-year average ROIC was 16.3%, slightly better than the broader sector. Just as you’d like your investment dollars to generate returns, MarineMax's invested capital has produced decent profits.
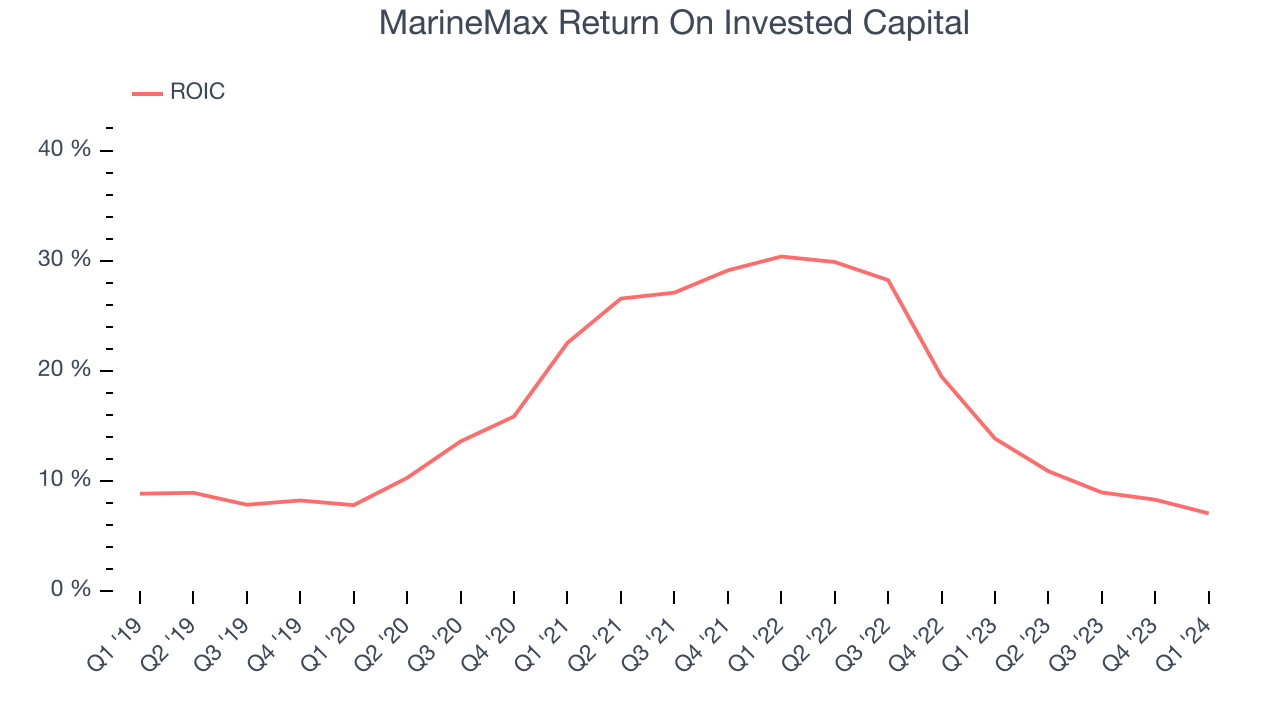
The trend in its ROIC, however, is often what surprises the market and drives the stock price. Unfortunately, MarineMax's ROIC averaged 4.7 percentage point decreases over the last few years. We like what management has done historically but are concerned its ROIC is declining, perhaps a symptom of waning business opportunities to invest profitably.
Balance Sheet Risk
As long-term investors, the risk we care most about is the permanent loss of capital. This can happen when a company goes bankrupt or raises money from a disadvantaged position and is separate from short-term stock price volatility, which we are much less bothered by.
MarineMax's $1.28 billion of debt exceeds the $216.7 million of cash on its balance sheet. Furthermore, its 6x net-debt-to-EBITDA ratio (based on its EBITDA of $182.3 million over the last 12 months) shows the company is overleveraged.
At this level of debt, incremental borrowing becomes increasingly expensive and credit agencies could downgrade the company’s rating if profitability falls. MarineMax could also be backed into a corner if the market turns unexpectedly – a situation we seek to avoid as investors in high-quality companies.
We hope MarineMax can improve its balance sheet and remain cautious until it increases its profitability or reduces its debt.
Key Takeaways from MarineMax's Q1 Results
We struggled to find many strong positives in these results. Its revenue and EPS missed analysts as its same-store sales fell short of analysts' expectations (2% vs estimates of 4%). Management was forced to use more aggressive promotional activity to stimulate demand as it cited a challenging market environment; there was an industrywide decline in boat registrations this quarter.
As a result of the macroeconomic softness, MarineMax significantly lowered its full-year earnings forecast (EPS and EBITDA), missing Wall Street's estimates.
During the quarter, the company completed its acquisition of William Tenders USA, a luxury yacht tender.
Overall, this was a bad quarter for MarineMax. The stock is down 8.9% after reporting and currently trades at $27.18 per share.
Is Now The Time?
MarineMax may have had a tough quarter, but investors should also consider its valuation and business qualities when assessing the investment opportunity.
We cheer for all companies serving consumers, but in the case of MarineMax, we'll be cheering from the sidelines. Although its revenue growth has been good over the last five years, its cash burn raises the question of whether it can sustainably maintain growth. And while its projected EPS for the next year implies the company's fundamentals will improve, the downside is its poor same-store sales performance has been a headwind.
MarineMax's price-to-earnings ratio based on the next 12 months is 7.2x. While there are some things to like about MarineMax and its valuation is reasonable, we think there are better opportunities elsewhere in the market right now.
Wall Street analysts covering the company had a one-year price target of $36.86 per share right before these results (compared to the current share price of $27.18).
To get the best start with StockStory, check out our most recent stock picks, and then sign up to our earnings alerts by adding companies to your watchlist here. We typically have the quarterly earnings results analyzed within seconds of the data being released, and especially for companies reporting pre-market, this often gives investors the chance to react to the results before the market has fully absorbed the information.