
Luxury department store chain Nordstrom (NYSE:JWN) beat analysts' expectations in Q4 FY2023, with revenue up 2.3% year on year to $4.42 billion. It made a non-GAAP profit of $0.96 per share, improving from its profit of $0.74 per share in the same quarter last year.
Nordstrom (JWN) Q4 FY2023 Highlights:
- Revenue: $4.42 billion vs analyst estimates of $4.38 billion (0.9% beat)
- EPS (non-GAAP): $0.96 vs analyst expectations of $0.89 (7.7% beat)
- Guidance for full year EPS (non-GAAP): $1.85 vs analyst expectations of $1.97 (6.1% miss)
- Free Cash Flow of $285 million, down 48.9% from the same quarter last year
- Gross Margin (GAAP): 36.3%, up from 35% in the same quarter last year
- Store Locations: 359 at quarter end, increasing by 1 over the last 12 months
- Market Capitalization: $3.34 billion
Known for its exceptional customer service that features a ‘no questions asked’ return policy, Nordstrom (NYSE:JWN) is a high-end department store chain.
As the name suggests, a department store offers a wide variety of merchandise organized into different departments or sections. Before department stores, consumers would have to visit three different stores to buy a cocktail dress, mascara, and a duvet cover for their bed.
The core Nordstrom customer is a high-income shopper interested in designer brands and luxury goods. This customer can find brands like Gucci, Prada, and Alexander McQueen in a typical Nordstrom store or online. As mentioned, Nordstrom has an e-commerce presence which launched in 1998. An early adopter of omnichannel retailing in the luxury world, Nordstrom online sales represent a meaningful portion of sales today.
Compared to a typical department store such as Macy’s, Nordstrom is unique in a few ways. Firstly, the product selection is more curated, with less product on the sales floor due to the focus on quality over quantity. Secondly, there are fewer promotions to maintain its air of luxury. Finally, the company operates the Nordstrom Rack banner, an off-price concept. Nordstrom Rack purchases excess inventory from Nordstrom and others, then sells them at large discounts off the original price, appealing to a more budget-conscious customer.
Department Store
Department stores emerged in the 19th century to provide customers with a wide variety of merchandise under one roof, offering a convenient and luxurious shopping experience. They played an important role in the history of American retail and urbanization, and prior to department stores, retailers tended to sell narrow specialty and niche items. But what was once new is now old, and department stores are somewhat considered a relic of the past. They are being attacked from multiple angles–stagnant foot traffic at malls where they’ve served as anchors; more nimble off-price and fast-fashion retailers; and e-commerce-first competitors not burdened by large physical footprints.
Department store competitors include Macy’s (NYSE:M) and Dillard’s (NYSE:DDS). Those offering higher-end or designer merchandise include Farfetch (NYSE:FTCH) and Rent the Runway (NASDAQ:RENT).Sales Growth
Nordstrom is larger than most consumer retail companies and benefits from economies of scale, giving it an edge over its competitors.
As you can see below, the company's revenue has declined over the last four years, dropping 1.4% annually as its store count shrunk.
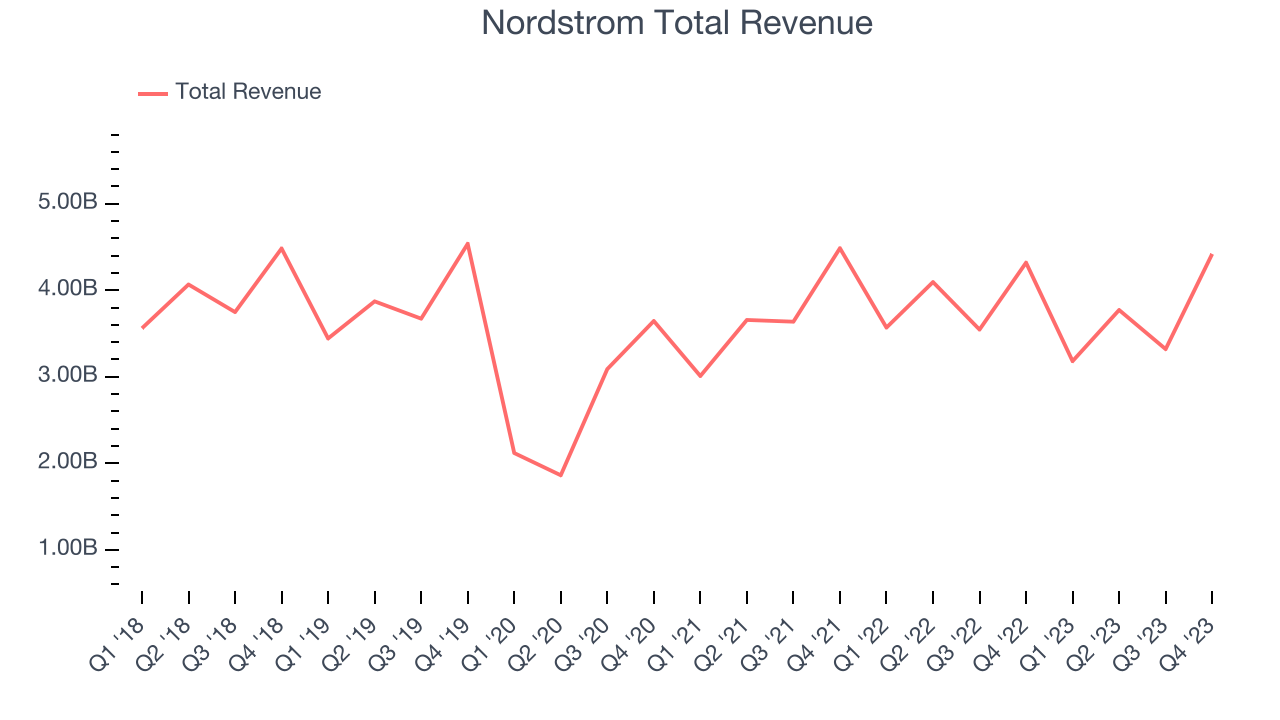
This quarter, Nordstrom grew its revenue by 2.3% year on year, and its $4.42 billion in revenue was in line with Wall Street's estimates. Looking ahead, Wall Street expects revenue to remain flat over the next 12 months, a deceleration from this quarter.
Number of Stores
When a retailer like Nordstrom keeps its store footprint steady, it usually means that demand is stable and it's focused on improving operational efficiency to increase profitability. At the end of this quarter, Nordstrom operated 359 total retail locations, in line with its store count 12 months ago.
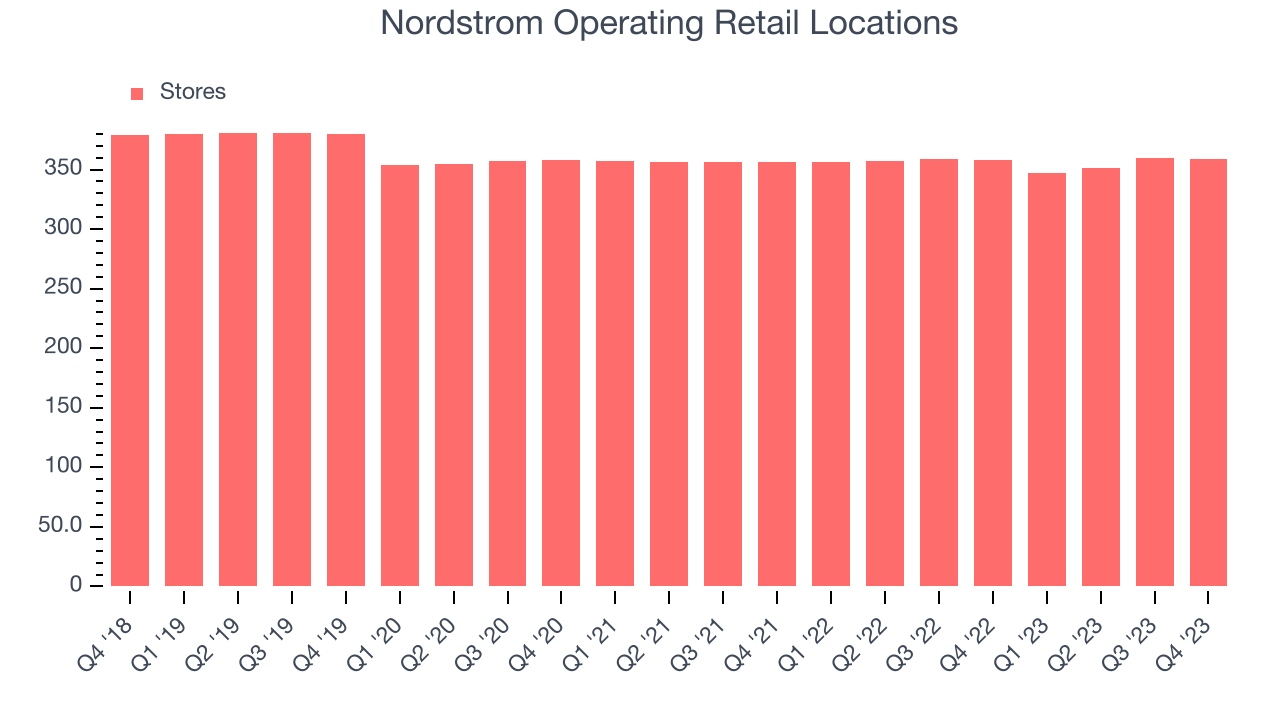
Taking a step back, the company has kept its physical footprint more or less flat over the last two years while other consumer retail businesses have opted for growth. A flat store base means that revenue growth must come from increased e-commerce sales or higher foot traffic and sales per customer at existing stores.
Gross Margin & Pricing Power
Nordstrom's unit economics are higher than the typical retailer, giving it the flexibility to invest in areas such as marketing and talent to reach more consumers. As you can see below, it's averaged a decent 36.1% gross margin over the last eight quarters. This means the company makes $0.36 for every $1 in revenue before accounting for its operating expenses. 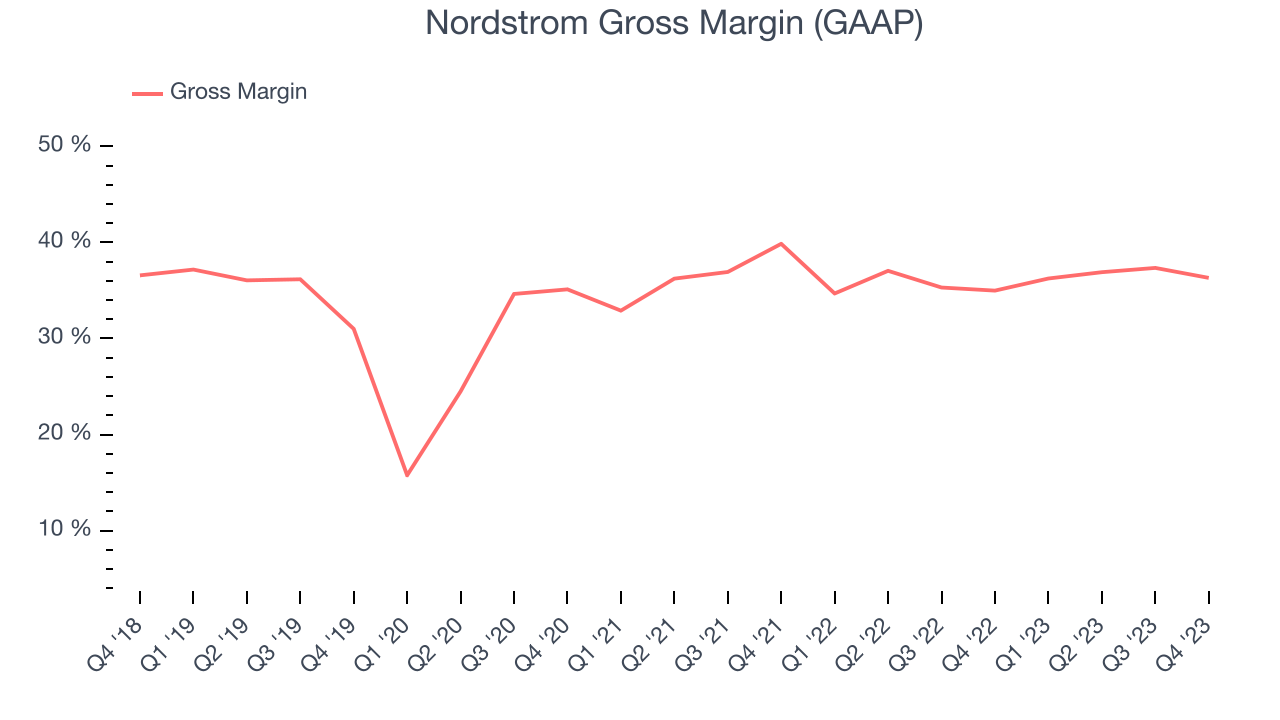
Nordstrom's gross profit margin came in at 36.3% this quarter, marking a 1.3 percentage point increase from 35% in the same quarter last year. This margin expansion is a good sign in the near term. If this trend continues, it could signal a less competitive environment where the company has better pricing power, less pressure to discount products, and more stable input costs (such as distribution expenses to move goods).
Operating Margin
Operating margin is an important measure of profitability for retailers as it accounts for all expenses keeping the lights on, including wages, rent, advertising, and other administrative costs.
This quarter, Nordstrom generated an operating profit margin of 4.9%, in line with the same quarter last year. This indicates the company's costs have been relatively stable.
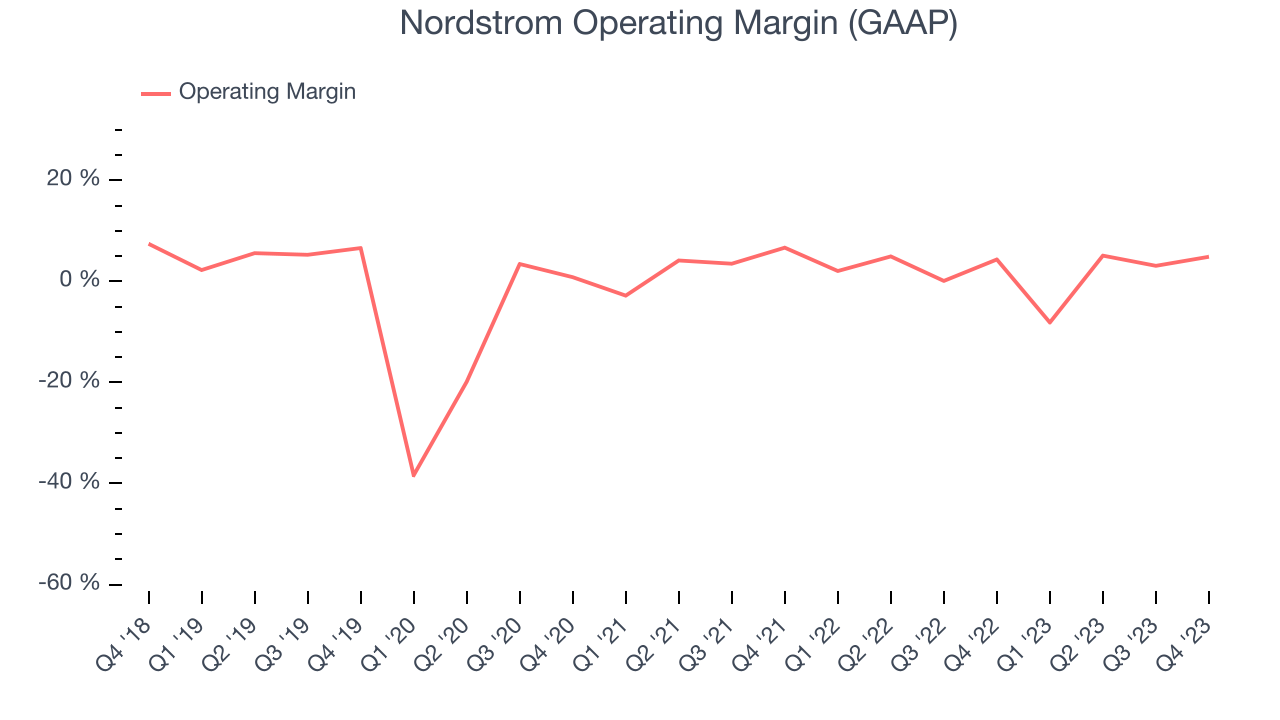 Zooming out, Nordstrom was profitable over the last two years but held back by its large expense base. Its average operating margin of 2.4% has been paltry for a consumer retail business. On top of that, Nordstrom's margin has slightly declined, on average, by 1.3 percentage points year on year. This shows Nordstrom has faced some speed bumps.
EPS
These days, some companies issue new shares like there's no tomorrow. That's why we like to track earnings per share (EPS) because it accounts for shareholder dilution and share buybacks.
In Q4, Nordstrom reported EPS at $0.96, up from $0.74 in the same quarter a year ago. This print exceeded Wall Street's estimates, but we care more about long-term EPS growth rather than short-term movements.
Between FY2019 and FY2023, Nordstrom's adjusted diluted EPS dropped 74.9%, translating into 29.2% annualized declines. In a mature sector such as consumer retail, we tend to steer our readers away from companies with falling EPS. If there's no earnings growth, it's difficult to build confidence in a business's underlying fundamentals, leaving a low margin of safety around the company's valuation (making the stock susceptible to large downward swings).
On the bright side, Wall Street expects the company's earnings to grow over the next 12 months, with analysts projecting an average 166% year-on-year increase in EPS.
Cash Is King
Although earnings are undoubtedly valuable for assessing company performance, we believe cash is king because you can't use accounting profits to pay the bills.
Nordstrom's free cash flow came in at $285 million in Q4, down 48.9% year on year. This result represents a 6.4% margin.
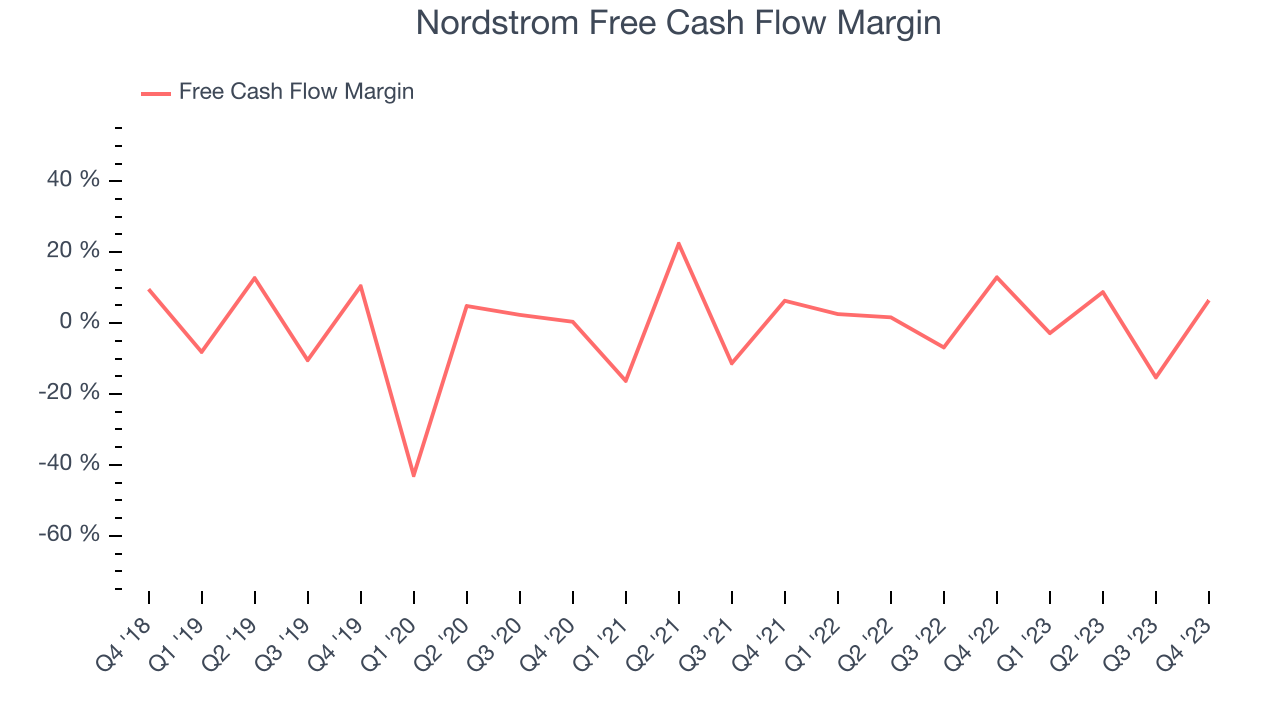
Over the last eight quarters, Nordstrom has shown mediocre cash profitability, putting it in a pinch as it gives the company limited opportunities to reinvest, pay down debt, or return capital to shareholders. Its free cash flow margin has averaged 1.6%, subpar for a consumer retail business. Furthermore, its margin has averaged year-on-year declines of 2.9 percentage points.
Return on Invested Capital (ROIC)
EPS and free cash flow tell us whether a company was profitable while growing revenue. But was it capital-efficient? Enter ROIC, a metric showing how much operating profit a company generates relative to how much money the business raised (debt and equity).
Nordstrom's five-year average ROIC was 5.2%, somewhat low compared to the best retail companies that consistently pump out 25%+. Its returns suggest it historically did a subpar job investing in profitable business initiatives.
The trend in its ROIC, however, is often what surprises the market and drives the stock price. Over the last two years, Nordstrom's ROIC averaged 6.9 percentage point increases each year. This is a good sign and we hope the company can continue to improving.
Key Takeaways from Nordstrom's Q4 Results
We were glad its revenue, gross margin, and adjusted EPS outperformed Wall Street's estimates. On the other hand, its full-year earnings forecast missed analysts' expectations. The weak outlook is likely the culprit driving down the stock price. Overall, the results could have been better. The company is down 10% on the results and currently trades at $18.8 per share.
Is Now The Time?
Nordstrom may have had a tough quarter, but investors should also consider its valuation and business qualities when assessing the investment opportunity.
We cheer for all companies serving consumers, but in the case of Nordstrom, we'll be cheering from the sidelines. Its revenue has declined over the last four years, but at least growth is expected to increase in the short term. And while its projected EPS for the next year implies the company's fundamentals will improve, the downside is its declining EPS over the last four years makes it hard to trust. On top of that, its relatively low ROIC suggests it has struggled to grow profits historically.
Nordstrom's price-to-earnings ratio based on the next 12 months is 10.6x. While the price is reasonable and there are some things to like about Nordstrom, we think there are better opportunities elsewhere in the market right now.
Wall Street analysts covering the company had a one-year price target of $17.94 per share right before these results (compared to the current share price of $18.80).
To get the best start with StockStory, check out our most recent stock picks, and then sign up to our earnings alerts by adding companies to your watchlist here. We typically have the quarterly earnings results analyzed within seconds of the data being released, and especially for companies reporting pre-market, this often gives investors the chance to react to the results before the market has fully absorbed the information.