
Packaged foods company Kellanova (NYSE:K) reported Q1 CY2024 results beating Wall Street analysts' expectations, with revenue down 4.2% year on year to $3.2 billion. It made a non-GAAP profit of $1.01 per share, improving from its profit of $0.78 per share in the same quarter last year.
Kellanova (K) Q1 CY2024 Highlights:
- Revenue: $3.2 billion vs analyst estimates of $3.16 billion (1.3% beat)
- EPS (non-GAAP): $1.01 vs analyst estimates of $0.85 (18.2% beat)
- Reaffirmed previously-provided full year guidance
- Gross Margin (GAAP): 32.2%, up from 14.9% in the same quarter last year
- Free Cash Flow of $209 million, up 182% from the previous quarter
- Organic Revenue was up 5.4% year on year (beat vs. expectations of up 2.2% year on year)
- Sales Volumes were down 3.1% year on year (beat vs. expectations of down 4.4% year on year)
- Market Capitalization: $19.47 billion
With Corn Flakes as its first and most iconic product, Kellanova (NYSE:K) is a packaged foods company that is dominant in the cereal and snack categories.
The company traces its roots back to the late 1800s when the Kellogg brothers inadvertently created Corn Flakes while experimenting with foods for patients with chronic illnesses. Specifically, they accidentally left a pot of wheatberries boiling, which made them soft and flaky. The brothers decided to bake the flaky dough, resulting in a crunchy cereal.
Through organic development as well as mergers and acquisitions of companies such as Keebler (cookies and crackers) and Pringles (potato chips), Kellanova built a powerful portfolio of packaged foods brands. Today, the portfolio features iconic brands such as Rice Krispies, Nutri-Grain, Kashi, Pop Tart, Cheez-It, and Morningstar Farms, among many others.
Kellanova caters to middle-income households seeking convenience through trusted brands. The heads or caretakers of these households are usually busy and don’t have the time to cook meals or prepare snacks from scratch. The company’s products add convenience to everyday life, and the company’s brands are often ones that customers have been eating since childhood, which adds an element of comfort. Kellanova products are sold nearly everywhere. Retailers from the largest supermarkets to the corner deli or bodega all carry that box of Corn Flakes or the box of Pop-Tarts. Given the company’s scale and traffic-driving brands, Kellanova often enjoys prominent placement on retailer shelves.
Shelf-Stable Food
As America industrialized and moved away from an agricultural economy, people faced more demands on their time. Packaged foods emerged as a solution offering convenience to the evolving American family, whether it be canned goods or snacks. Today, Americans seek brands that are high in quality, reliable, and reasonably priced. Furthermore, there's a growing emphasis on health-conscious and sustainable food options. Packaged food stocks are considered resilient investments. People always need to eat, so these companies can enjoy consistent demand as long as they stay on top of changing consumer preferences. The industry spans from multinational corporations to smaller specialized firms and is subject to food safety and labeling regulations.
Competitors in packaged food with broad brand portfolios include General Mills (NYSE:GIS), Mondelez (NASDAQ:MDLZ), Kraft Heinz (NASDAQ:KHC), and Nestle (SWX:NESN).Sales Growth
Kellanova is one of the larger consumer staples companies and benefits from a well-known brand, giving it customer mindshare and influence over purchasing decisions.
As you can see below, the company's revenue has declined over the last three years, dropping 2.4% annually as consumers bought less of its products.
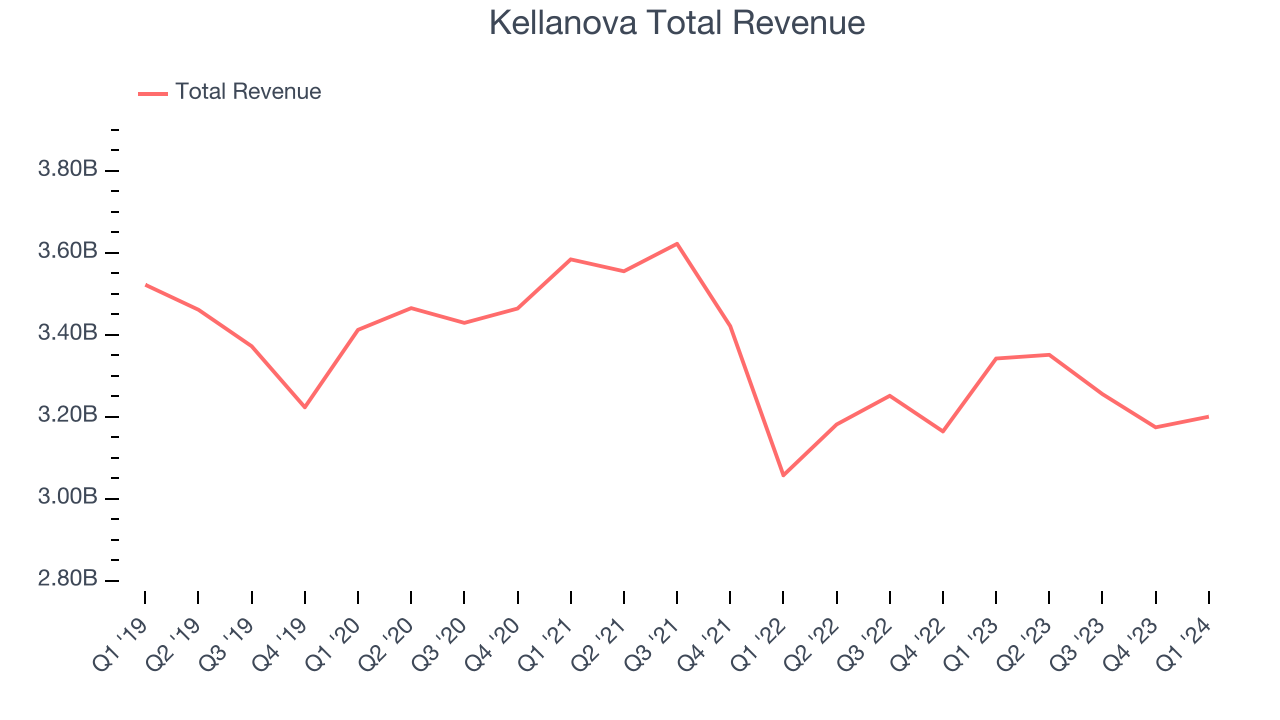
This quarter, Kellanova's revenue fell 4.2% year on year to $3.2 billion but beat Wall Street's estimates by 1.3%. Looking ahead, Wall Street expects revenue to decline 1% over the next 12 months.
Volume Growth
Revenue growth can be broken down into changes in price and volume (the number of units sold). While both are important, volume is the lifeblood of a successful staples business as there’s a ceiling to what consumers will pay for everyday goods; they can always trade down to non-branded products if the branded versions are too expensive.
To analyze whether Kellanova generated its growth from changes in price or volume, we can compare its volume growth to its organic revenue growth, which excludes non-fundamental impacts on company financials like mergers and currency fluctuations.
Over the last two years, Kellanova's average quarterly sales volumes have shrunk by 3.1%. This decrease isn't ideal as the quantity demanded for consumer staples products is typically stable. Luckily, Kellanova was able to offset fewer customers purchasing its products by charging higher prices, enabling it to generate 9.9% average organic revenue growth. We hope the company can grow its volumes soon, however, as consistent price increases (on top of inflation) aren't sustainable over the long term unless the business is really really special.
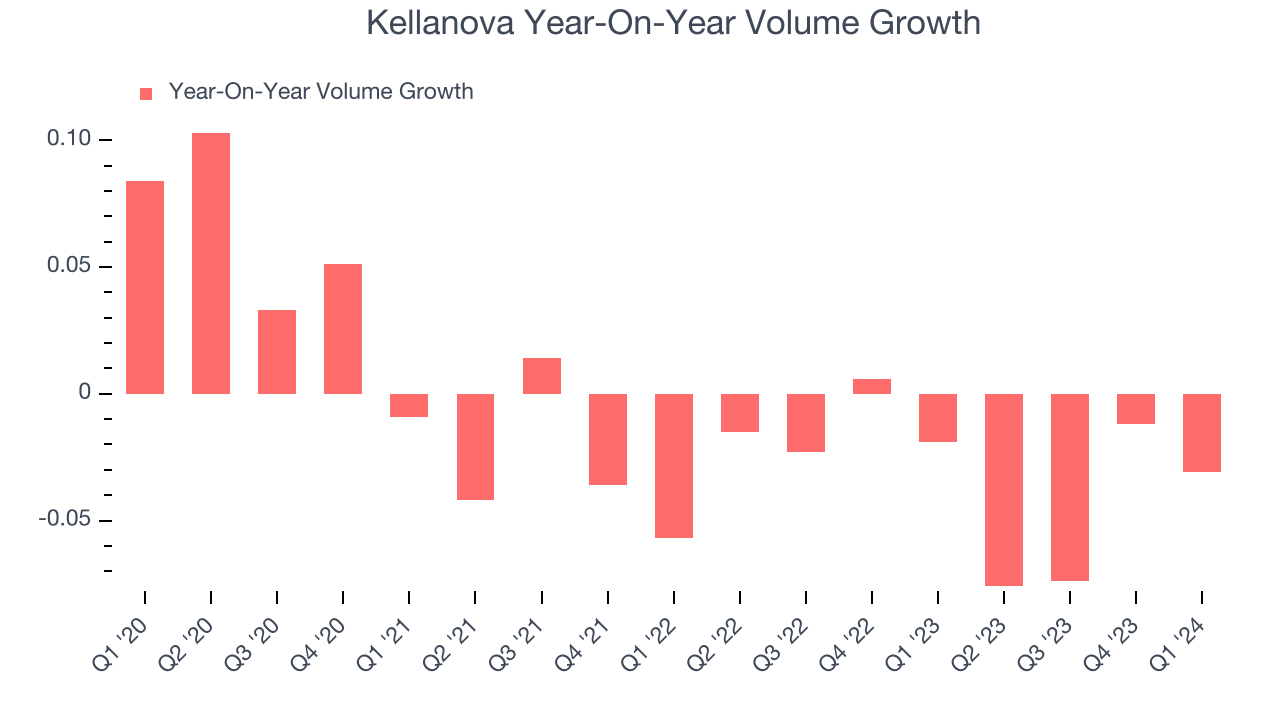
In Kellanova's Q1 2024, sales volumes dropped 3.1% year on year. This result was a further deceleration from the 1.9% year-on-year decline it posted 12 months ago, showing the business is struggling to push its products.
Gross Margin & Pricing Power
Gross profit margins tell us how much money a company gets to keep after paying for the direct costs of the goods it sells.
This quarter, Kellanova's gross profit margin was 32.2%, up 17.3 percentage points year on year. That means for every $1 in revenue, a chunky $0.68 went towards paying for raw materials, production of goods, and distribution expenses.
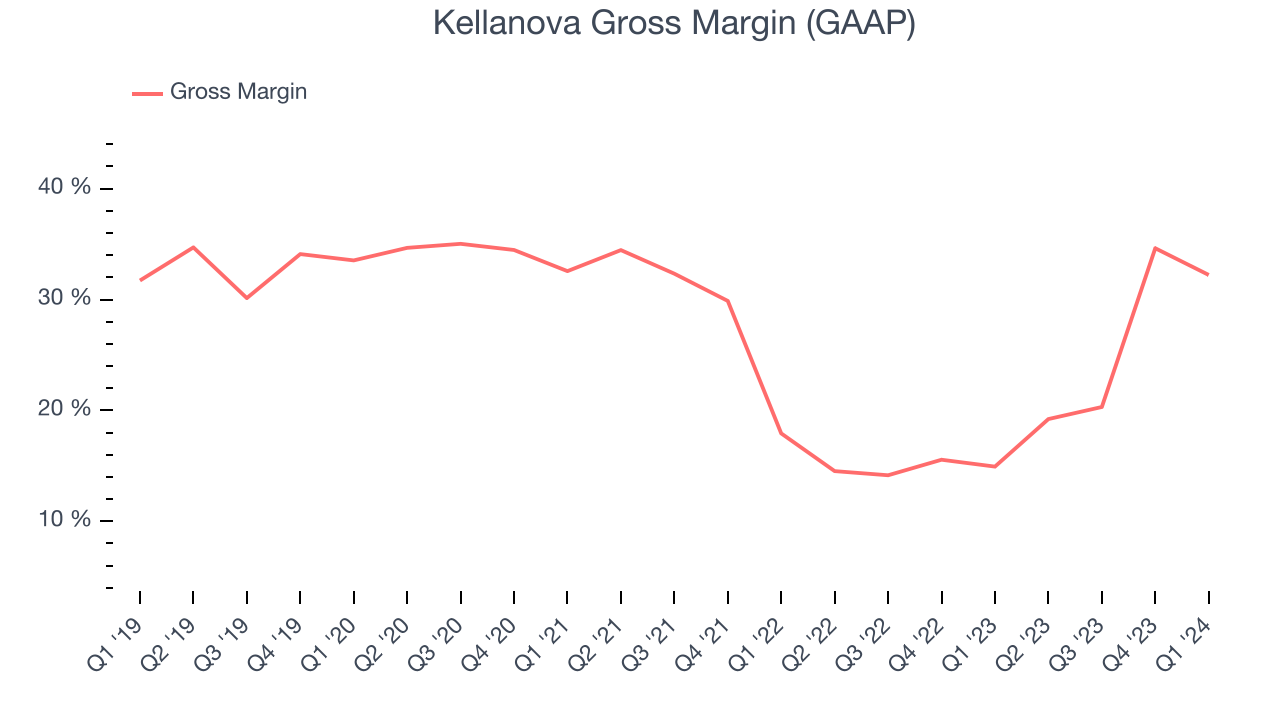
Kellanova has poor unit economics for a consumer staples company, leaving it with little room for error if things go awry. As you can see above, it's averaged a paltry 20.6% gross margin over the last two years. Its margin, however, has been trending up over the last 12 months, averaging 78.6% year-on-year increases each quarter. If this trend continues, it could suggest a less competitive environment.
Operating Margin
Operating margin is an important measure of profitability accounting for key expenses such as marketing and advertising, IT systems, wages, and other administrative costs.
This quarter, Kellanova generated an operating profit margin of 12.3%, in line with the same quarter last year. This indicates the company's costs have been relatively stable.
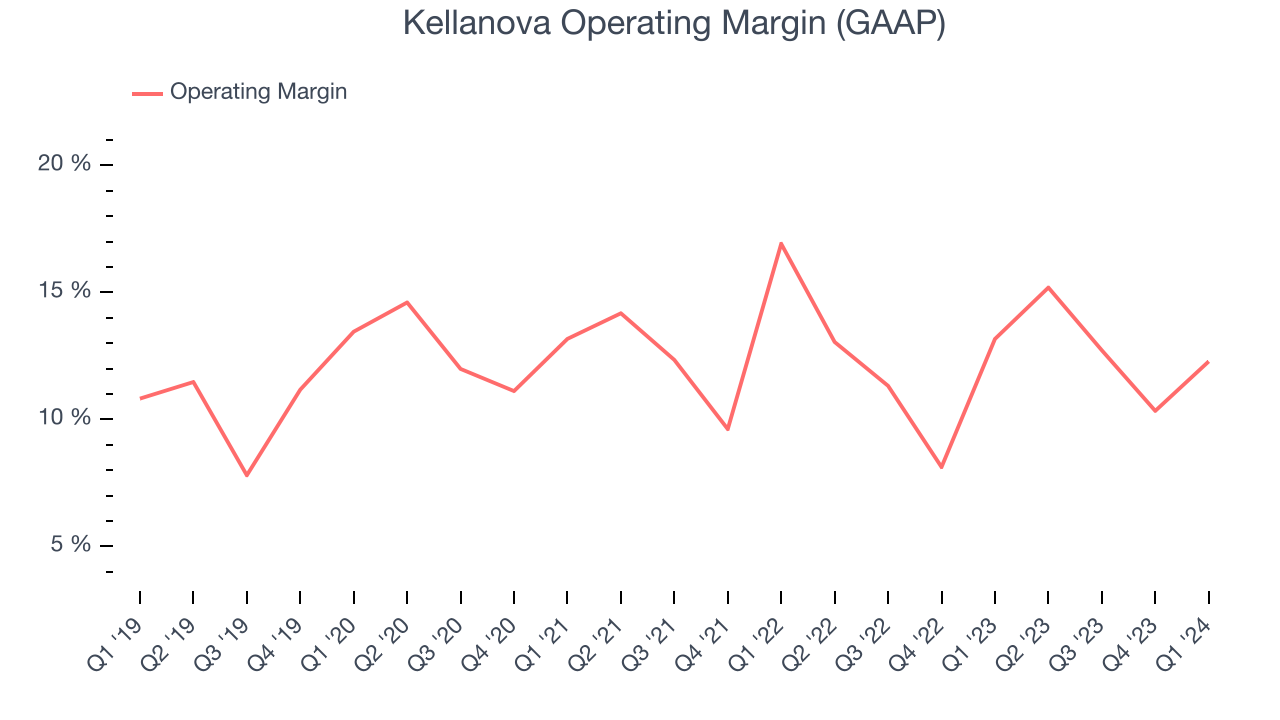 Zooming out, Kellanova has managed its expenses well over the last two years. It's demonstrated solid profitability for a consumer staples business, producing an average operating margin of 12.1%. On top of that, its margin has risen by 1.2 percentage points on average over the last year, showing the company is improving its fundamentals. The company's operating profitability was particularly impressive because of its low gross margin, which is mostly a factor of what it sells and takes tectonic shifts to move meaningfully. Companies have more control over their operating margins, and it signals strength if they're high when gross margins are low (like for Kellanova).
EPS
Earnings growth is a critical metric to track, but for long-term shareholders, earnings per share (EPS) is more telling because it accounts for dilution and share repurchases.
In Q1, Kellanova reported EPS at $1.01, up from $0.78 in the same quarter a year ago. This print beat Wall Street's estimates by 18.2%.
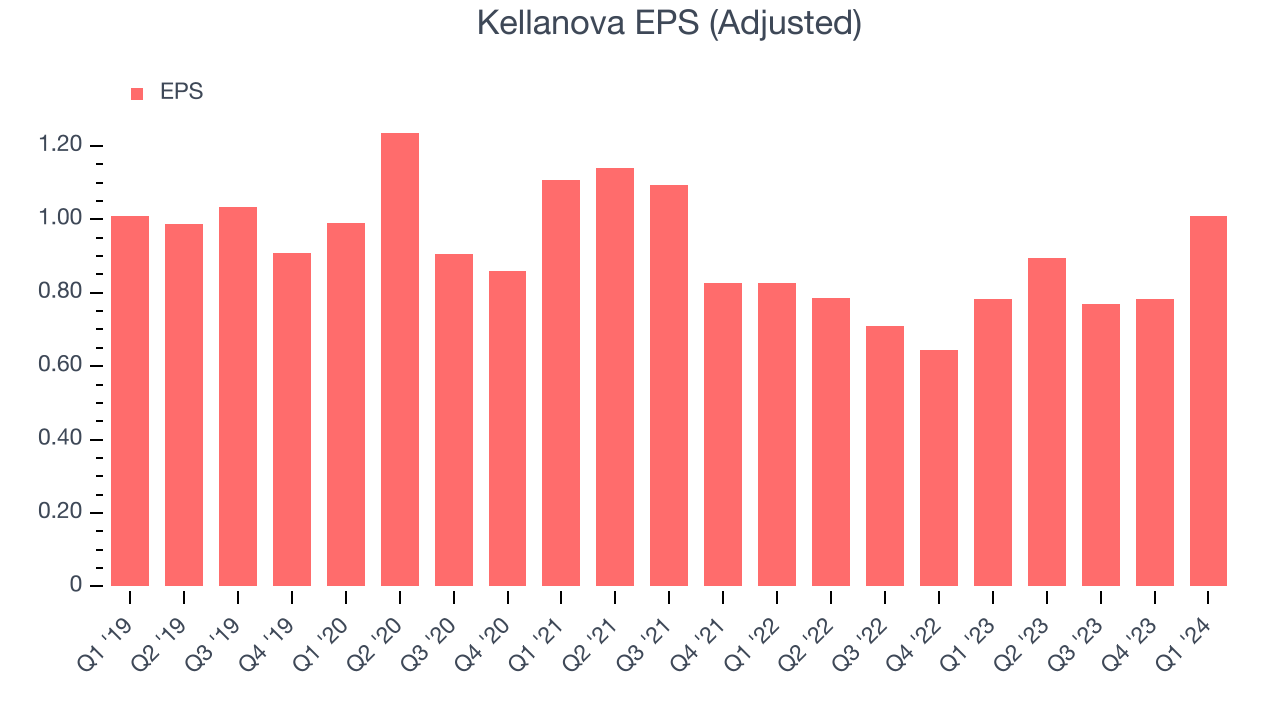
Between FY2021 and FY2024, Kellanova's EPS dropped 15.9%, translating into 5.6% annualized declines. We tend to steer our readers away from companies with falling EPS, especially in the consumer staples sector, where shrinking earnings could imply changing secular trends or consumer preferences. If there's no earnings growth, it's difficult to build confidence in a business's underlying fundamentals, leaving a low margin of safety around the company's valuation (making the stock susceptible to large downward swings).
On the bright side, Wall Street expects the company's earnings to grow over the next 12 months, with analysts projecting an average 5.1% year-on-year increase in EPS.
Cash Is King
If you've followed StockStory for a while, you know we emphasize free cash flow. Why, you ask? We believe that in the end, cash is king, and you can't use accounting profits to pay the bills.
Kellanova's free cash flow came in at $209 million in Q1, up 186% year on year. This result represents a 6.5% margin.
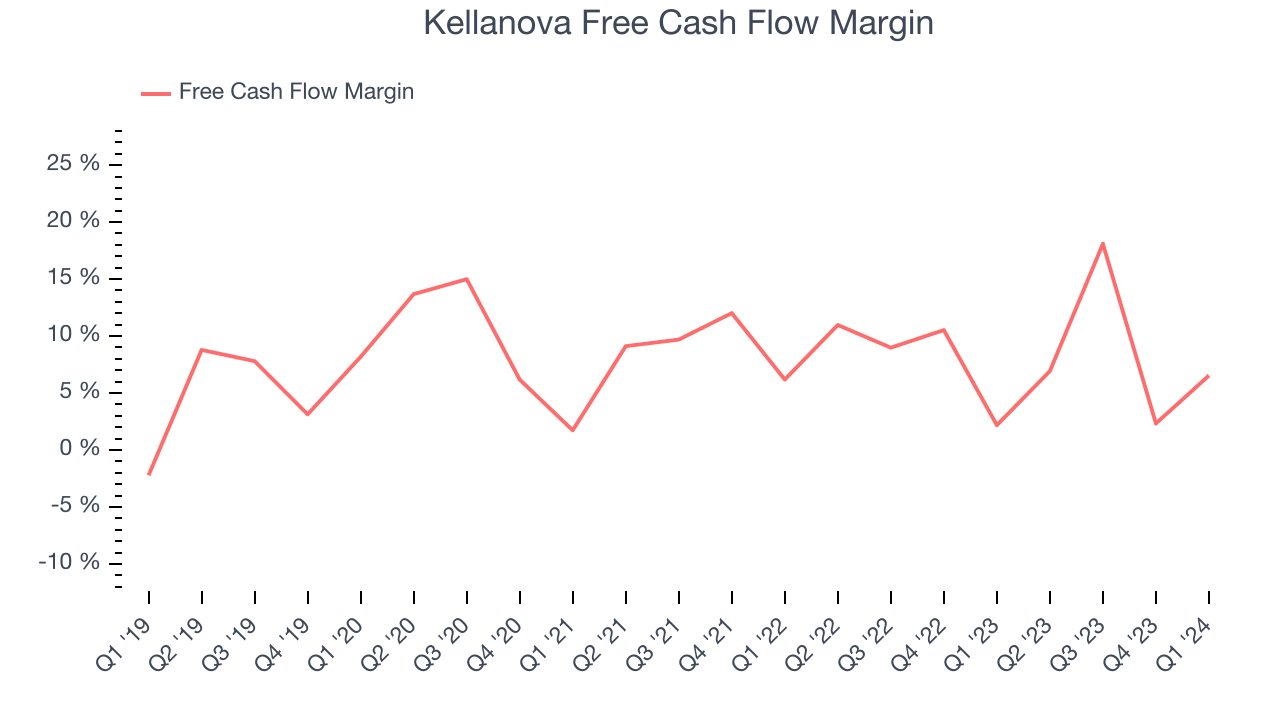
Over the last eight quarters, Kellanova has shown solid cash profitability, giving it the flexibility to reinvest or return capital to investors. The company's free cash flow margin has averaged 8.3%, above the broader consumer staples sector. Furthermore, its margin has been flat, showing that the company's cash flows are relatively stable.
Return on Invested Capital (ROIC)
EPS and free cash flow tell us whether a company was profitable while growing revenue. But was it capital-efficient? A company’s ROIC explains this by showing how much operating profit a company makes compared to how much money the business raised (debt and equity).
Kellanova's five-year average ROIC was 12.8%, slightly better than the broader sector. Just as you’d like your investment dollars to generate returns, Kellanova's invested capital has produced decent profits.
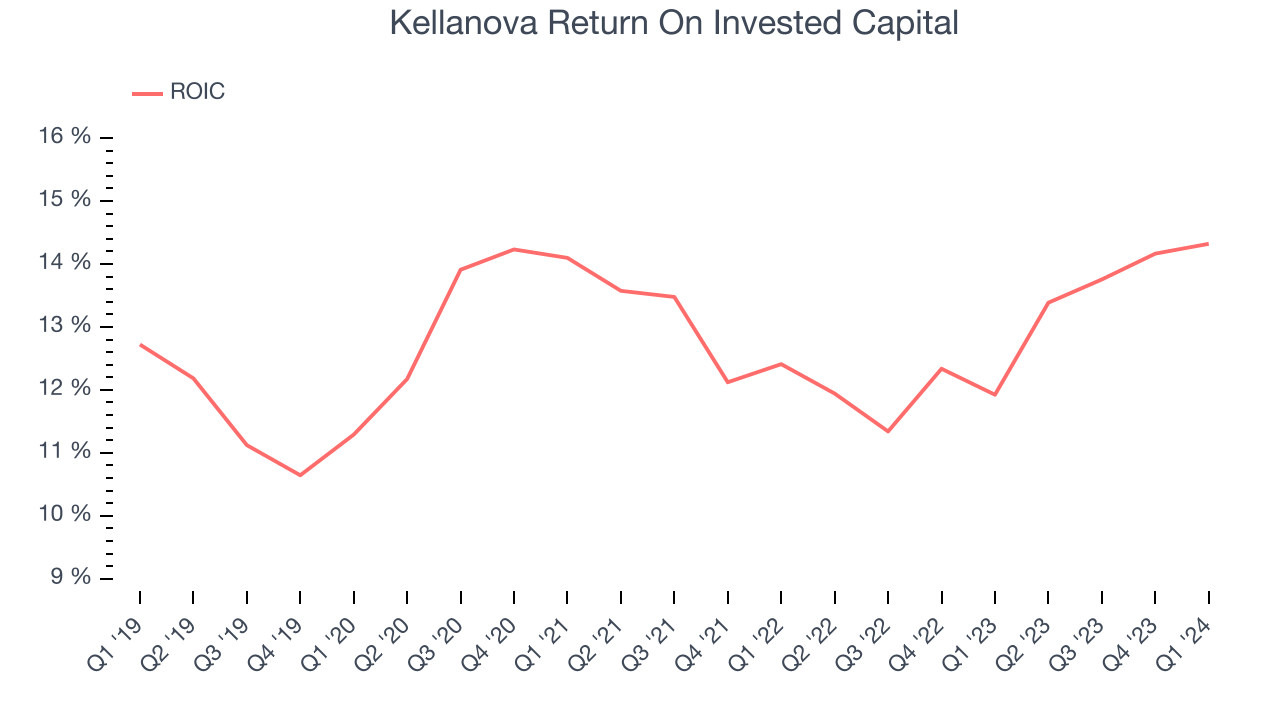
The trend in its ROIC, however, is often what surprises the market and drives the stock price. Uneventfully, Kellanova's ROIC has stayed the same over the last few years. This is fine because its returns are solid, but if the company wants to become an investable business, it will need to increase its ROIC even more.
Balance Sheet Risk
As long-term investors, the risk we care most about is the permanent loss of capital. This can happen when a company goes bankrupt or raises money from a disadvantaged position and is separate from short-term stock price volatility, which we are much less bothered by.
Kellanova reported $242 million of cash and $5.93 billion of debt on its balance sheet in the most recent quarter. As investors in high-quality companies, we primarily focus on two things: 1) that a company's debt level isn't too high and 2) that its interest payments are not excessively burdening the business.
With $2.00 billion of EBITDA over the last 12 months, we view Kellanova's 2.9x net-debt-to-EBITDA ratio as safe. We also see its $167 million of annual interest expenses as appropriate. The company's profits give it plenty of breathing room, allowing it to continue investing in new initiatives.
Key Takeaways from Kellanova's Q1 Results
We were impressed by how significantly Kellanova blew past analysts' organic revenue growth expectations this quarter. We were also excited its EPS outperformed Wall Street's estimates. On the other hand, its gross margin missed analysts' expectations and its operating margin missed Wall Street's estimates. Zooming out, we think this was still a decent, albeit mixed, quarter, showing that the company is staying on track. The stock is flat after reporting and currently trades at $56.91 per share.
Is Now The Time?
Kellanova may have had a favorable quarter, but investors should also consider its valuation and business qualities when assessing the investment opportunity.
We cheer for all companies serving consumers, but in the case of Kellanova, we'll be cheering from the sidelines. Its revenue has declined over the last three years, but at least growth is expected to increase in the short term. And while its well-known brand makes it a household name consumers consistently turn to, the downside is its gross margins make it more challenging to reach positive operating profits compared to other consumer staples businesses. On top of that, its shrinking sales volumes suggest it'll need to change its strategy to succeed.
Kellanova's price-to-earnings ratio based on the next 12 months is 15.7x. While there are some things to like about Kellanova and its valuation is reasonable, we think there are better opportunities elsewhere in the market right now.
Wall Street analysts covering the company had a one-year price target of $60.11 per share right before these results (compared to the current share price of $56.91).
To get the best start with StockStory, check out our most recent stock picks, and then sign up to our earnings alerts by adding companies to your watchlist here. We typically have the quarterly earnings results analyzed within seconds of the data being released, and especially for companies reporting pre-market, this often gives investors the chance to react to the results before the market has fully absorbed the information.