
Beverage company Coca-Cola (NYSE:KO) reported results ahead of analysts' expectations in Q1 CY2024, with revenue up 3.1% year on year to $11.3 billion. It made a non-GAAP profit of $0.72 per share, improving from its profit of $0.68 per share in the same quarter last year.
Coca-Cola (KO) Q1 CY2024 Highlights:
- Revenue: $11.3 billion vs analyst estimates of $10.97 billion (3% beat)
- EPS (non-GAAP): $0.72 vs analyst estimates of $0.70 (3.4% beat)
- Maintained 2024 EPS (non-GAAP) guidance of 4% to 5% year on year growth versus $2.69 in 2023 (in line)
- Gross Margin (GAAP): 62.5%, up from 60.6% in the same quarter last year
- Free Cash Flow of $158 million, down 91.3% from the previous quarter
- Organic Revenue was up 11% year on year
- Sales Volumes were up 1% year on year
- Market Capitalization: $267.5 billion
A pioneer and behemoth in carbonated soft drinks, The Coca-Cola Company (NYSE:KO) is a storied beverage company best known for its flagship soda of the same name.
The company was founded in 1886 when the namesake soda was created by pharmacist Dr. John S. Pemberton in Atlanta, Georgia. The original formula was intended as a patent medicine and sold as a medicinal tonic. Pemberton's bookkeeper, Frank Robinson, came up with the name "Coca-Cola" and designed the iconic script logo that is still used today. Coca-Cola is one of the most recognized and powerful brands on earth, period.
Today, Coca-Cola offers a diverse range of beverages including Diet Coke, Sprite, Powerade sports drinks, Minute Maid juices, and Dasani water. Therefore, its core customer is extremely broad. The company's products are widely available in grocery stores, supermarkets, convenience stores, restaurants, vending machines, and movie theaters globally. Coca-Cola's strong distribution network is a differentiator and ensures its products are easily accessible and visible in terms of shelf placement.
Whether it’s the script logo, “bottle skirt” glass bottle, or Santa Claus association, Coca-Cola is a product that is embedded in pop culture.
Beverages and Alcohol
These companies' performance is influenced by brand strength, marketing strategies, and shifts in consumer preferences. Changing consumption patterns are particularly relevant and can be seen in the explosion of alcoholic craft beer drinks or the steady decline of non-alcoholic sugary sodas. Companies that spend on innovation to meet consumers where they are with regards to trends can reap huge demand benefits while those who ignore trends can see stagnant volumes. Finally, with the advent of the social media, the cost of starting a brand from scratch is much lower, meaning that new entrants can chip away at the market shares of established players.
Competitors that offer sodas and other beverages include PepsiCo (NASDAQ:PEP), Keurig Dr. Pepper (NASDAQ:KDP), Nestle (SWX:NESN), and Monster Beverage (NASDAQ:MNST).Sales Growth
Coca-Cola is one of the most widely recognized consumer staples companies in the world. Its influence over consumers gives it extremely high negotiating leverage with distributors, enabling it to pick and choose where it sells its products (a luxury many don't have).
As you can see below, the company's annualized revenue growth rate of 11.3% over the last three years was decent as consumers bought more of its products.
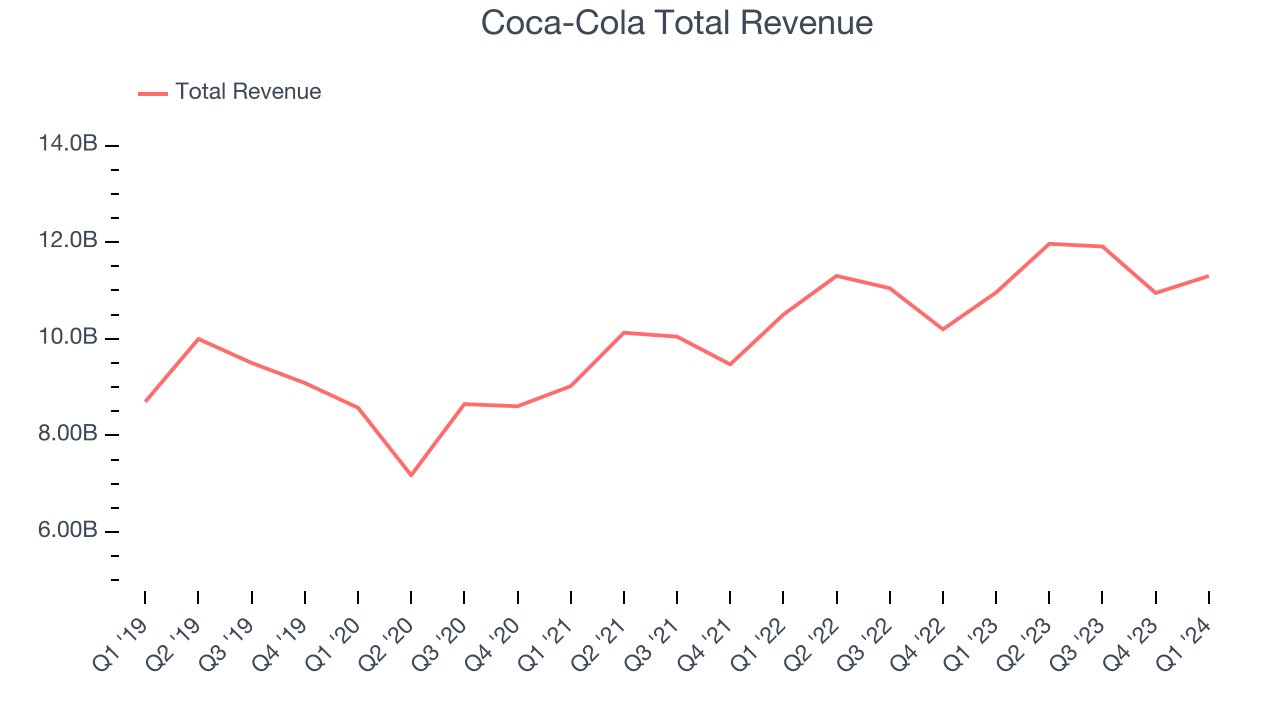
This quarter, Coca-Cola reported decent year-on-year revenue growth of 3.1%, and its $11.3 billion in revenue topped Wall Street's estimates by 3%. Looking ahead, Wall Street expects revenue to remain flat over the next 12 months, a deceleration from this quarter.
Volume Growth
Revenue growth can be broken down into changes in price and volume (the number of units sold). While both are important, volume is the lifeblood of a successful staples business as there’s a ceiling to what consumers will pay for everyday goods; they can always trade down to non-branded products if the branded versions are too expensive.
To analyze whether Coca-Cola generated its growth from changes in price or volume, we can compare its volume growth to its organic revenue growth, which excludes non-fundamental impacts on company financials like mergers and currency fluctuations.
Over the last two years, Coca-Cola's average quarterly volume growth was a healthy 2.6%. Even with this good performance, we can see that most of the company's gains have come from price increases by looking at its 13% average organic revenue growth. The ability to sell more products while raising prices indicates that Coca-Cola enjoys some degree of inelastic demand.
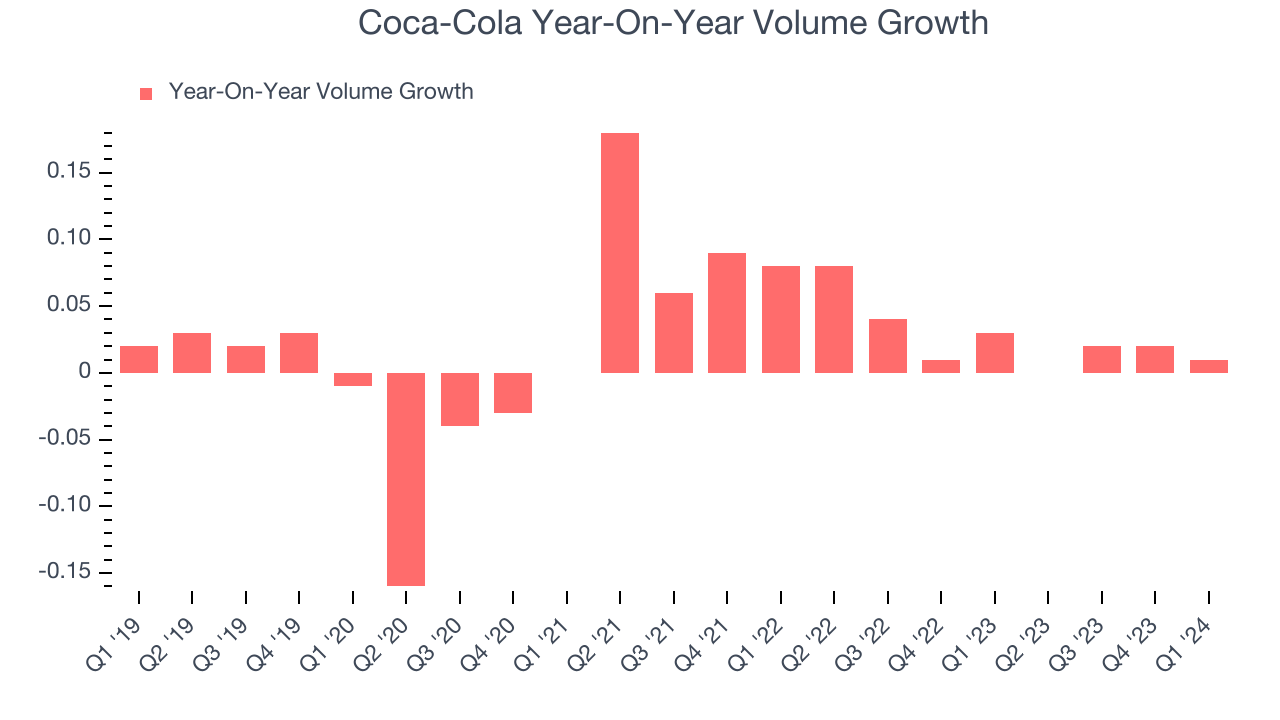
In Coca-Cola's Q1 2024, year on year sales volumes were flat. By the company's standards, this result was a meaningful deceleration from the 3% year-on-year increase it posted 12 months ago. We'll be watching Coca-Cola closely to see if it can reaccelerate demand for its products.
Gross Margin & Pricing Power
This quarter, Coca-Cola's gross profit margin was 62.5%, up 1.9 percentage points year on year. That means for every $1 in revenue, $0.37 went towards paying for raw materials, production of goods, and distribution expenses.
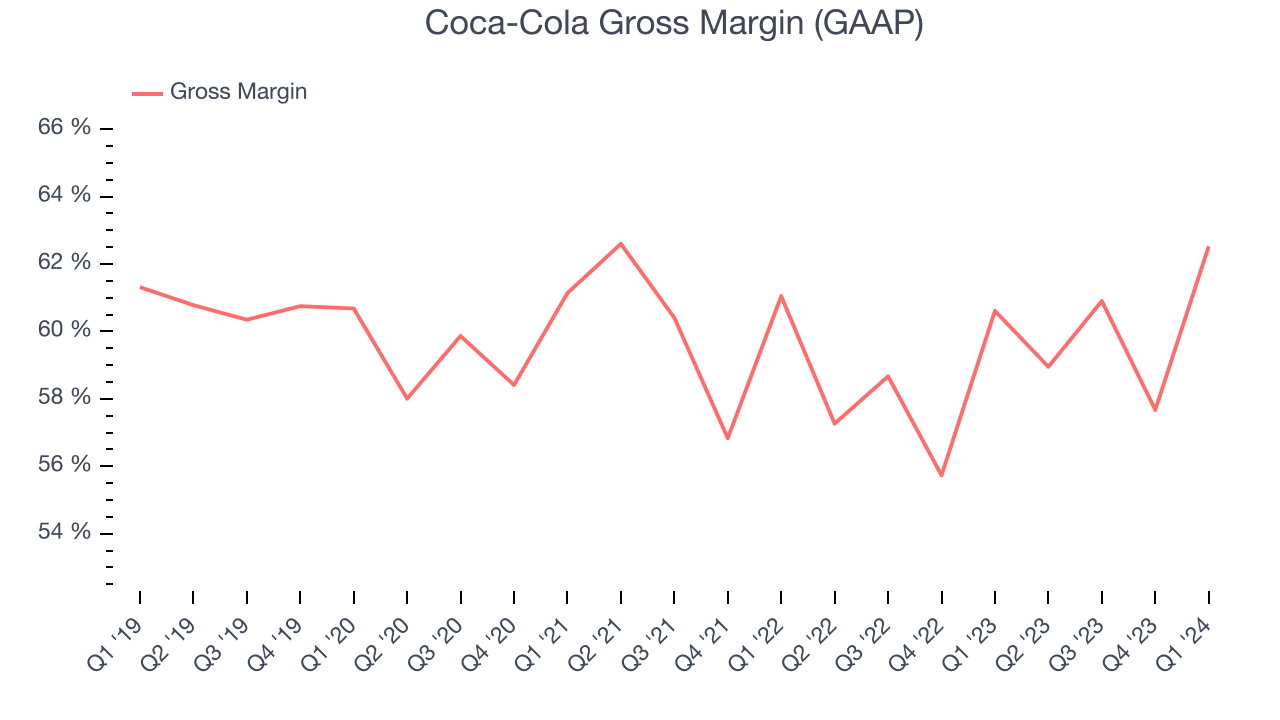
Coca-Cola has best-in-class unit economics for a consumer staples company, enabling it to invest in areas such as marketing and talent to stay one step ahead of the competition. As you can see above, it's averaged an exceptional 59.1% gross margin over the last two years. Its margin has also been trending up over the last 12 months, averaging 3.3% year-on-year increases each quarter. If this trend continues, it could suggest a less competitive environment where the company has better pricing power and more favorable input costs (such as raw materials).
Operating Margin
Operating margin is an important measure of profitability accounting for key expenses such as marketing and advertising, IT systems, wages, and other administrative costs.
In Q1, Coca-Cola generated an operating profit margin of 18.9%, down 11.8 percentage points year on year. Conversely, the company's gross margin actually increased, so we can assume the reduction was driven by operational inefficiencies and a step up in discretionary spending in areas like corporate overhead and advertising.
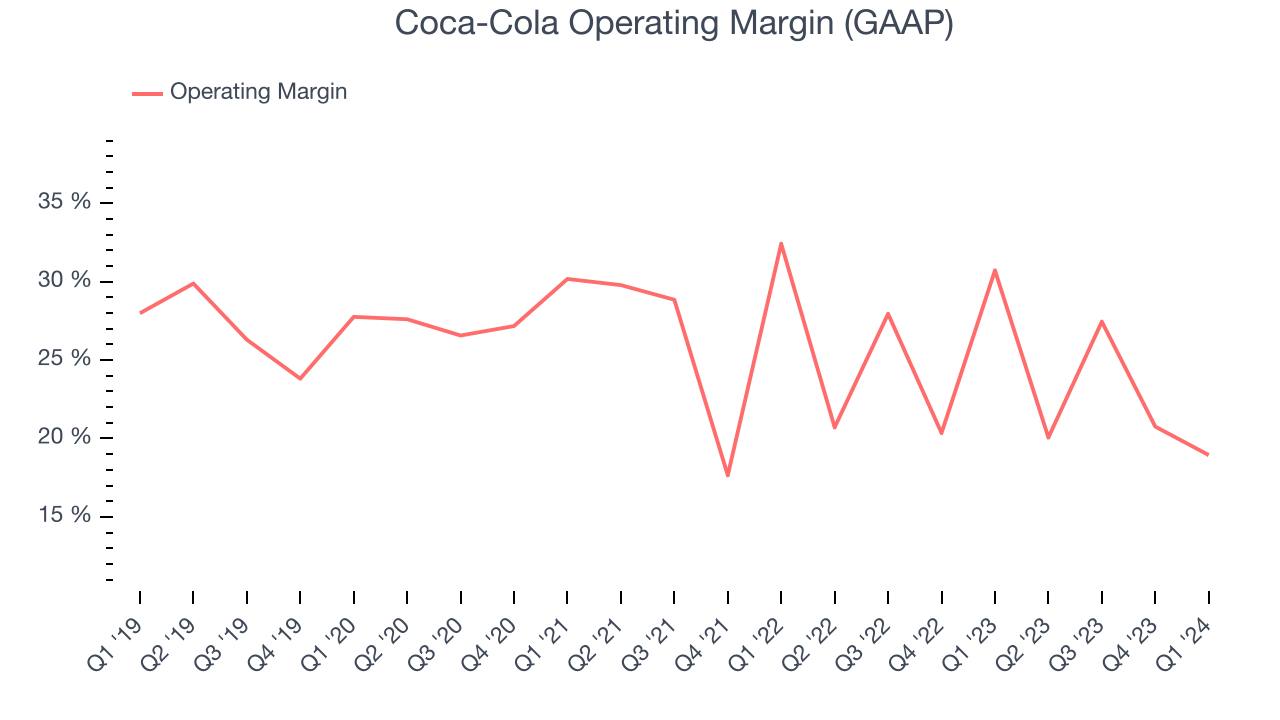 Zooming out, Coca-Cola has been a well-oiled machine over the last two years. It's demonstrated elite profitability for a consumer staples business, boasting an average operating margin of 23.4%. However, Coca-Cola's margin has declined by 3.1 percentage points on average over the last year. Although this isn't the end of the world, investors are likely hoping for better results in the future.
 EPS
These days, some companies issue new shares like there's no tomorrow. That's why we like to track earnings per share (EPS) because it accounts for shareholder dilution and share buybacks.
In Q1, Coca-Cola reported EPS at $0.72, up from $0.68 in the same quarter a year ago. This print beat Wall Street's estimates by 3.4%.
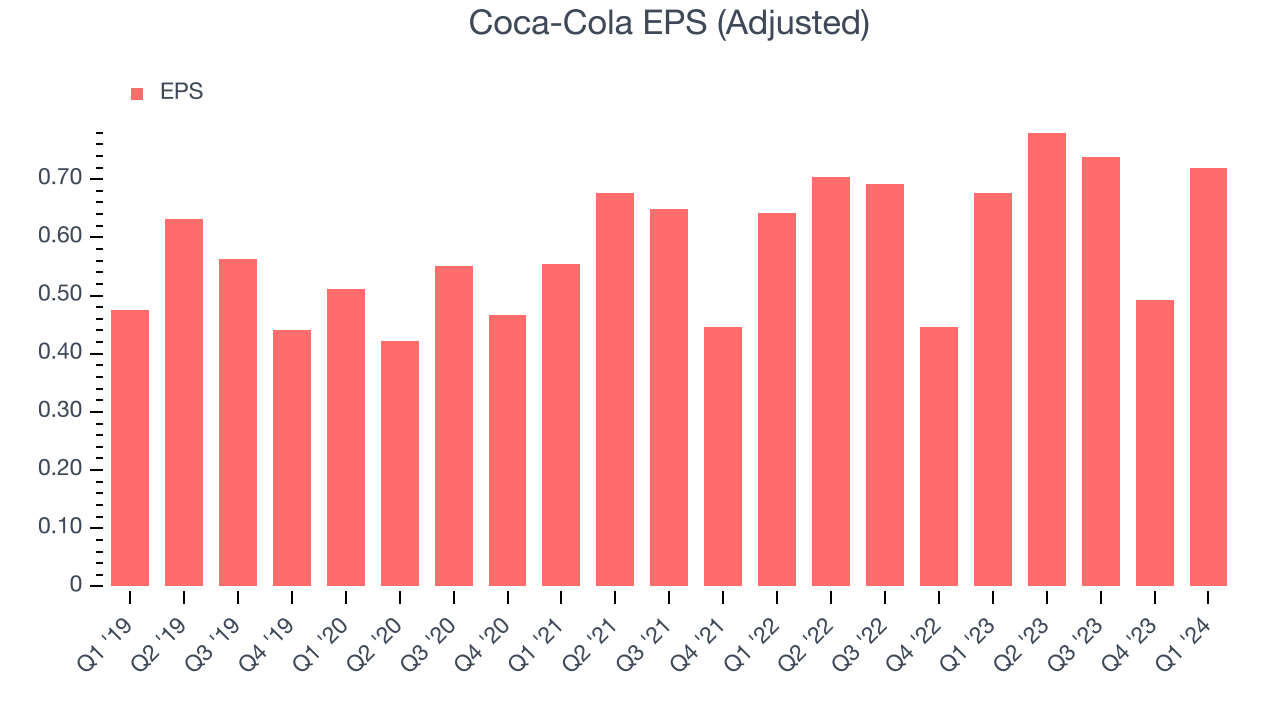
Between FY2021 and FY2024, Coca-Cola's EPS grew 37%, translating into a solid 11.1% compounded annual growth rate.
Wall Street expects the company to continue growing earnings over the next 12 months, with analysts projecting an average 4.6% year-on-year increase in EPS.
Cash Is King
If you've followed StockStory for a while, you know we emphasize free cash flow. Why, you ask? We believe that in the end, cash is king, and you can't use accounting profits to pay the bills.
Coca-Cola's free cash flow came in at $158 million in Q1, representing a 1.4% margin. This result was great for the business as it flipped from cash flow negative in the same quarter last year to positive this quarter.
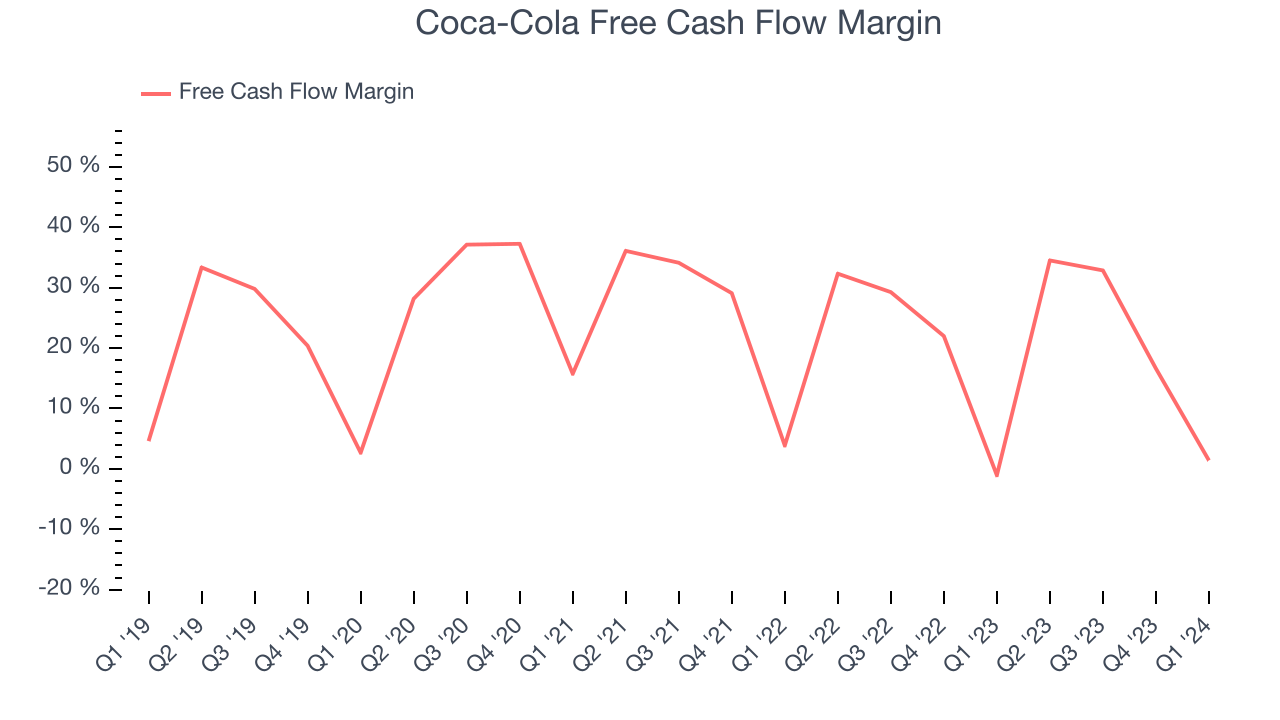
Over the last eight quarters, Coca-Cola has shown terrific cash profitability, enabling it to reinvest, return capital to investors, and stay ahead of the competition while maintaining a robust cash balance. The company's free cash flow margin has been among the best in the consumer staples sector, averaging 21.2%. Furthermore, its margin has averaged year-on-year increases of 1 percentage points over the last 12 months. This likely pleases the company's investors.
Return on Invested Capital (ROIC)
EPS and free cash flow tell us whether a company was profitable while growing revenue. But was it capital-efficient? Enter ROIC, a metric showing how much operating profit a company generates relative to how much money the business raised (debt and equity).
Coca-Cola's five-year average ROIC was 15.7%, higher than most consumer staples companies. Just as you’d like your investment dollars to generate returns, Coca-Cola's invested capital has produced solid profits.
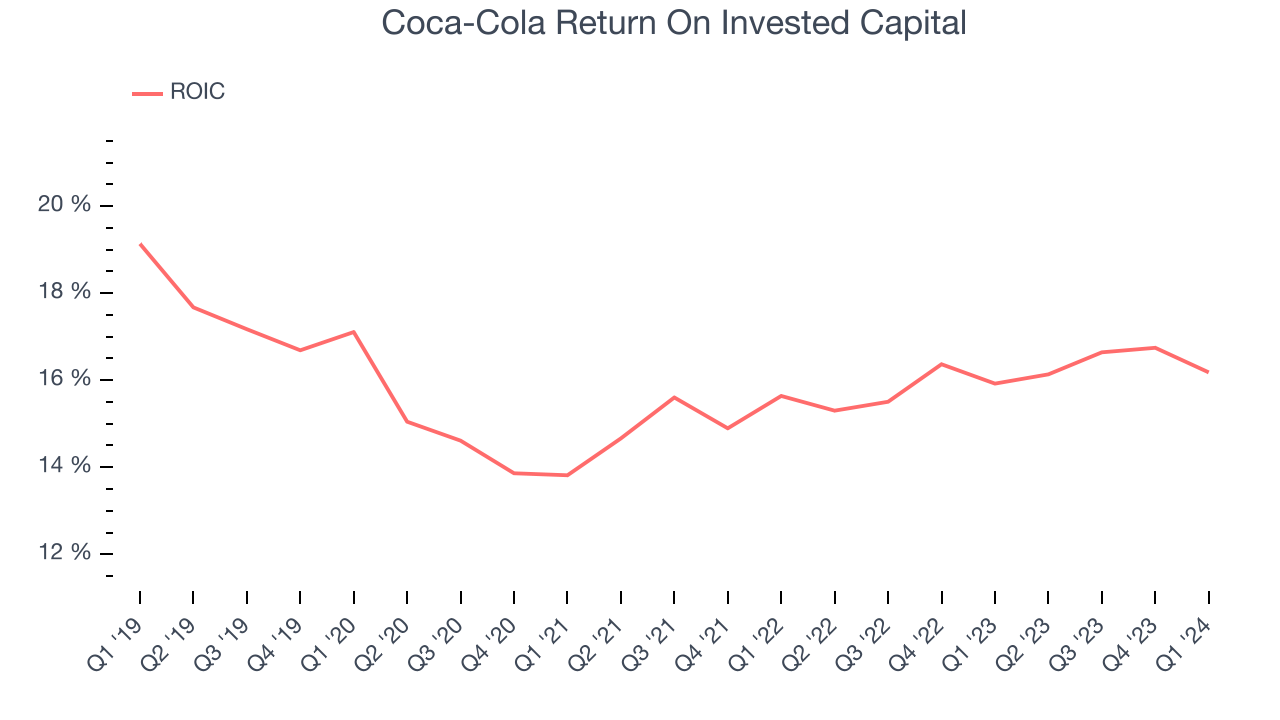
The trend in its ROIC, however, is often what surprises the market and drives the stock price. Uneventfully, Coca-Cola's ROIC has stayed the same over the last few years. A rising ROIC would be ideal, but this is still a noteworthy feat when considering its returns are already high.
Balance Sheet Risk
As long-term investors, the risk we care most about is the permanent loss of capital. This can happen when a company goes bankrupt or raises money from a disadvantaged position and is separate from short-term stock price volatility, which we are much less bothered by.
Coca-Cola reported $16.92 billion of cash and $42.55 billion of debt on its balance sheet in the most recent quarter. As investors in high-quality companies, we primarily focus on two things: 1) that a company's debt level isn't too high and 2) that its interest payments are not excessively burdening the business.
With $13.09 billion of EBITDA over the last 12 months, we view Coca-Cola's 2.0x net-debt-to-EBITDA ratio as safe. We also see its $138 million of annual interest expenses as appropriate. The company's profits give it plenty of breathing room, allowing it to continue investing in new initiatives.
Key Takeaways from Coca-Cola's Q1 Results
We were impressed that Coca-Cola beat past analysts' organic revenue growth expectations this quarter. We were also excited its revenue outperformed Wall Street's estimates. On the other hand, its operating margin missed analysts' expectations. The company maintained its full year guidance for EPS, showing that it is staying on track and that the macro in which it operates hasn't changed much since giving guidance roughly three months ago. Overall, this quarter's results seemed fairly positive and shareholders should feel optimistic. The stock is flat after reporting and currently trades at $61.65 per share.
Is Now The Time?
Coca-Cola may have had a favorable quarter, but investors should also consider its valuation and business qualities when assessing the investment opportunity.
We think Coca-Cola is a solid business. First off, its revenue growth has been solid over the last three years. And while its projected EPS for the next year is lacking, its powerful free cash flow generation enables it to stay ahead of the competition through consistent reinvestment of profits. On top of that, its scale gives it immense negotiating leverage with retailers.
Coca-Cola's price-to-earnings ratio based on the next 12 months is 21.7x. There are definitely things to like about Coca-Cola, and looking at the consumer staples landscape right now, it seems to be trading at a reasonable price.
Wall Street analysts covering the company had a one-year price target of $66.14 per share right before these results (compared to the current share price of $61.65), implying they saw upside in buying Coca-Cola in the short term.
To get the best start with StockStory, check out our most recent stock picks, and then sign up to our earnings alerts by adding companies to your watchlist here. We typically have the quarterly earnings results analyzed within seconds of the data being released, and especially for companies reporting pre-market, this often gives investors the chance to react to the results before the market has fully absorbed the information.