Homebuilder Lennar (NYSE:LEN) reported Q3 CY2024 results exceeding the market’s revenue expectations with sales up 7.9% year on year to $9.42 billion. Its GAAP profit of $4.26 per share was also 17.3% above analysts’ consensus estimates.
Is now the time to buy Lennar? Find out by accessing our full research report, it’s free.
Lennar (LEN) Q3 CY2024 Highlights:
- Revenue: $9.42 billion vs analyst estimates of $9.16 billion (2.8% beat)
- EPS: $4.26 vs analyst estimates of $3.63 (17.3% beat)
- Q4'24 new orders guidance: 19,150 vs analyst estimates of 18,936 (1.1% beat)
- Gross Margin (GAAP): 25.5%, in line with the same quarter last year
- Backlog: $7.7 billion at quarter end, down 21.9% year on year (7% miss vs. expectations of $8.3 billion)
- Market Capitalization: $51.22 billion
Stuart Miller, Executive Chairman and Co-Chief Executive Officer of Lennar, said, "We are pleased to report another solid quarter backed by an economic environment that remains very constructive for homebuilders. Employment was strong, housing supply remained chronically short due to production deficits of over a decade, and demand was solid driven by strong household formation. Although affordability continued to be tested during the quarter, purchasers remained responsive to increased sales incentives, resulting in a 16% increase in our deliveries and a 5% increase in our new orders year over year. "
One of the largest homebuilders in America, Lennar (NYSE:LEN) is known for constructing affordable, move-up, and retirement homes across a range of markets and communities.
Home Builders
Traditionally, homebuilders have built competitive advantages with economies of scale that lead to advantaged purchasing and brand recognition among consumers. Aesthetic trends have always been important in the space, but more recently, energy efficiency and conservation are driving innovation. However, these companies are still at the whim of the macro, specifically interest rates that heavily impact new and existing home sales. In fact, homebuilders are one of the most cyclical subsectors within industrials.
Sales Growth
A company’s long-term performance can give signals about its business quality. Even a bad business can shine for one or two quarters, but a top-tier one tends to grow for years. Over the last five years, Lennar grew its sales at an impressive 10.9% compounded annual growth rate. This shows it expanded quickly, a useful starting point for our analysis. 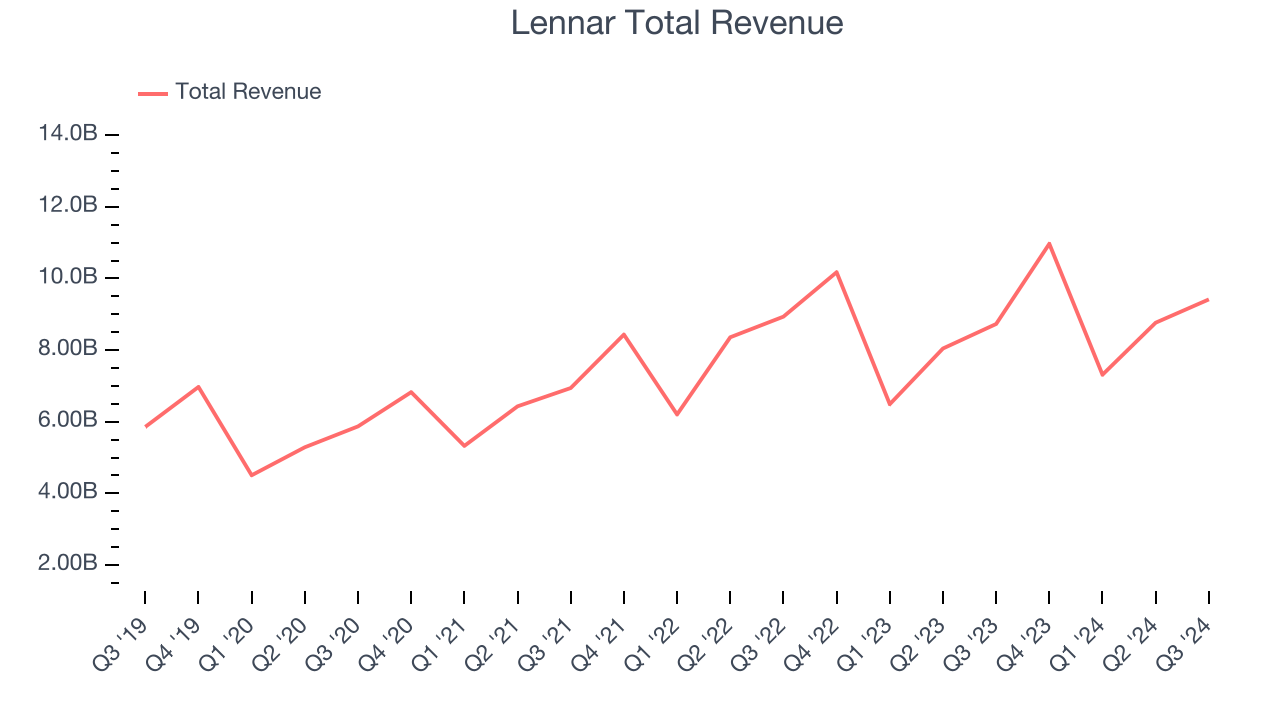
Long-term growth is the most important, but within industrials, a half-decade historical view may miss new industry trends or demand cycles. Lennar’s recent history shows its demand slowed significantly as its annualized revenue growth of 6.9% over the last two years is well below its five-year trend.
Lennar also reports its backlog, or the value of its outstanding orders that have not yet been executed or delivered. Lennar’s backlog reached $7.7 billion in the latest quarter and averaged 24.1% year-on-year declines over the last two years. Because this number is lower than its revenue growth, we can see the company hasn’t secured enough new orders to maintain its growth rate in the future. 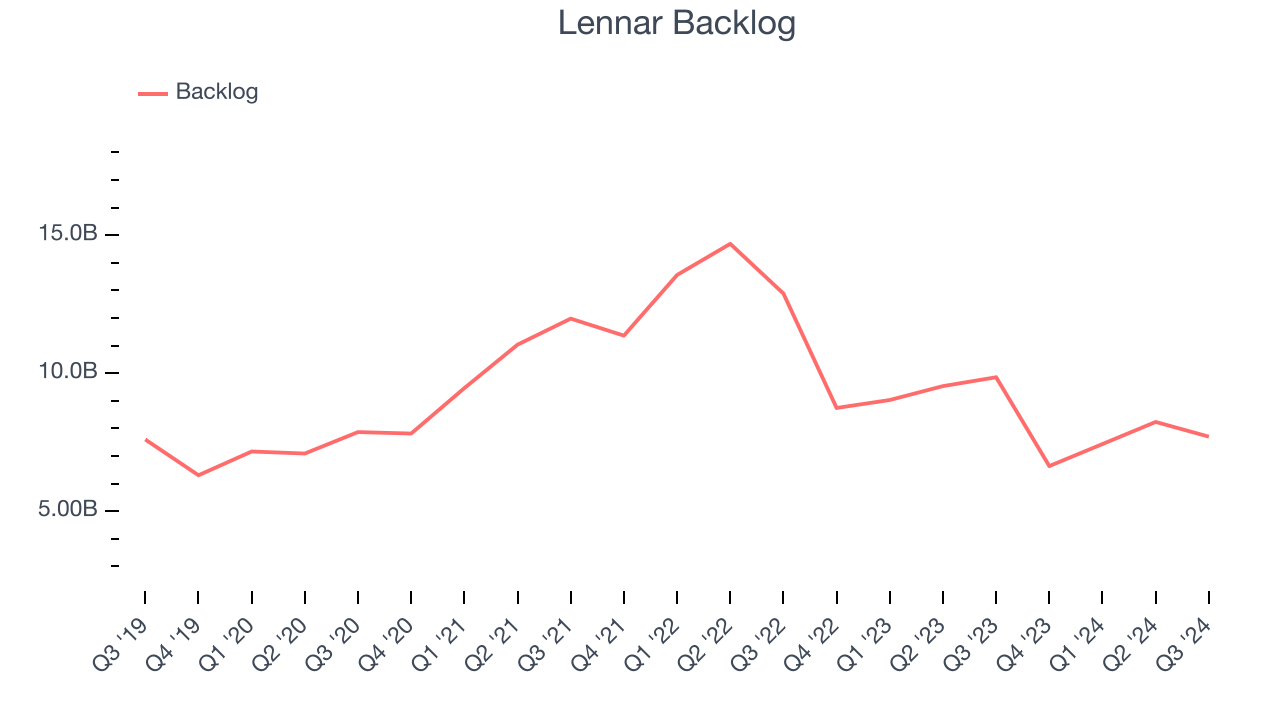
This quarter, Lennar reported solid year-on-year revenue growth of 7.9%, and its $9.42 billion of revenue outperformed Wall Street’s estimates by 2.8%. Looking ahead, Wall Street expects sales to grow 1.9% over the next 12 months, a deceleration versus the last two years.
Unless you’ve been living under a rock, it should be obvious by now that generative AI is going to have a huge impact on how large corporations do business. While Nvidia and AMD are trading close to all-time highs, we prefer a lesser-known (but still profitable) semiconductor stock benefitting from the rise of AI. Click here to access our free report on our favorite semiconductor growth story.
Operating Margin
Operating margin is an important measure of profitability as it shows the portion of revenue left after accounting for all core expenses–everything from the cost of goods sold to advertising and wages. It’s also useful for comparing profitability across companies with different levels of debt and tax rates because it excludes interest and taxes.
Lennar has been a well-oiled machine over the last five years. It demonstrated elite profitability for an industrials business, boasting an average operating margin of 16.6%. This result was particularly impressive because of its low gross margin, which is mostly a factor of what it sells and takes huge shifts to move meaningfully. Companies have more control over their operating margins, and it’s a show of well-managed operations if they’re high when gross margins are low.
Looking at the trend in its profitability, Lennar’s annual operating margin rose by 2.6 percentage points over the last five years.
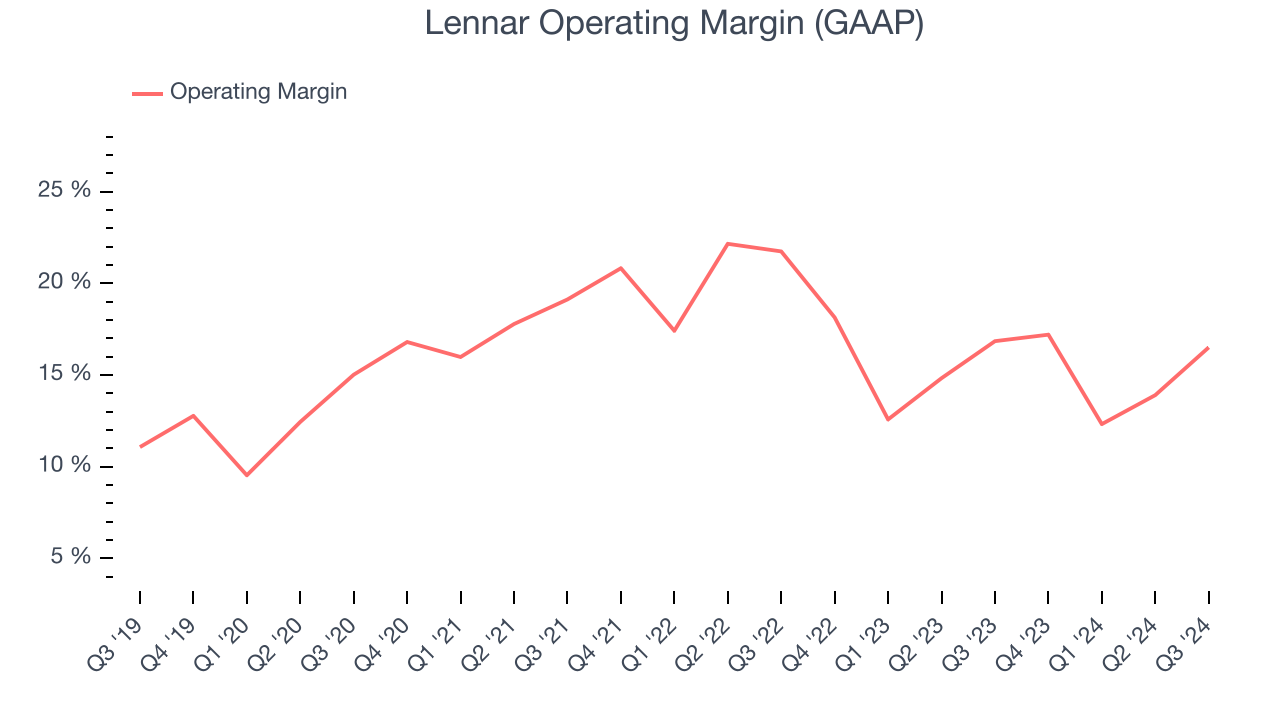
This quarter, Lennar generated an operating profit margin of 16.5%, in line with the same quarter last year. This indicates the company’s cost structure has recently been stable.
EPS
We track the long-term growth in earnings per share (EPS) for the same reason as long-term revenue growth. Compared to revenue, however, EPS highlights whether a company’s growth was profitable.
Lennar’s EPS grew at an astounding 20% compounded annual growth rate over the last five years, higher than its 10.9% annualized revenue growth. This tells us the company became more profitable as it expanded.
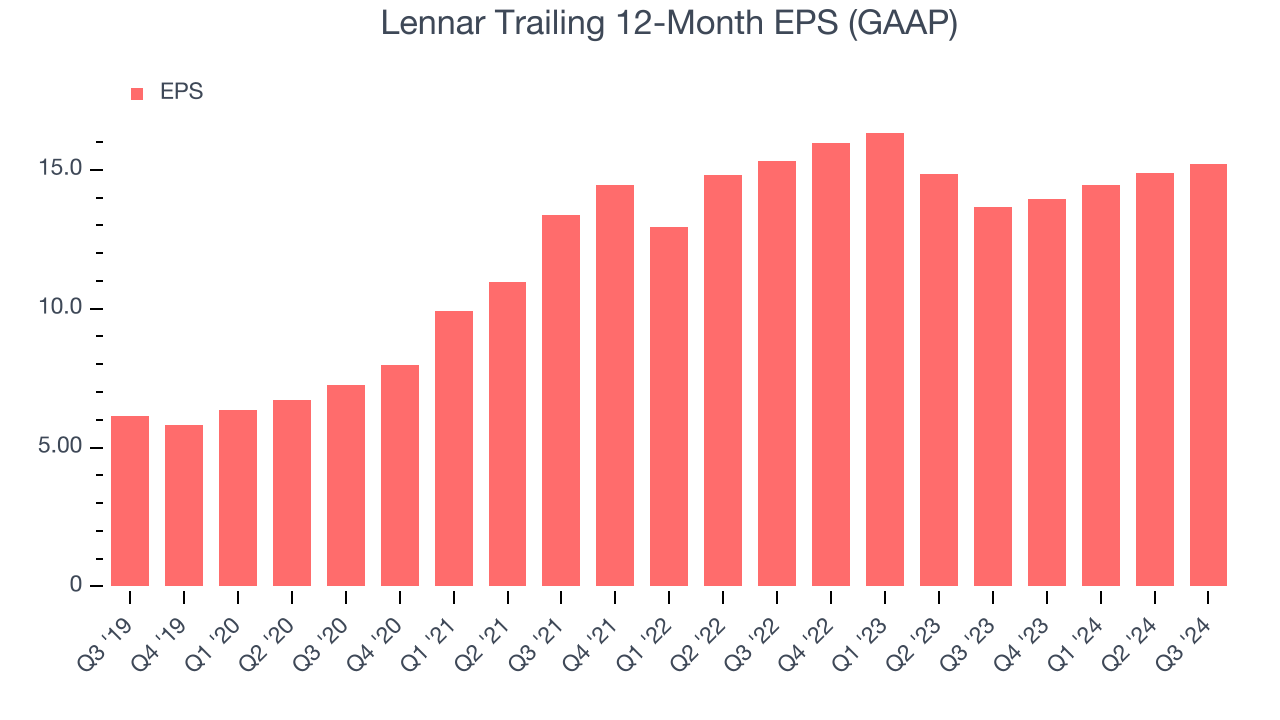
We can take a deeper look into Lennar’s earnings quality to better understand the drivers of its performance. As we mentioned earlier, Lennar’s operating margin was flat this quarter but expanded by 2.6 percentage points over the last five years. On top of that, its share count shrank by 15.1%. These are positive signs for shareholders because improving profitability and share buybacks turbocharge EPS growth relative to revenue growth. 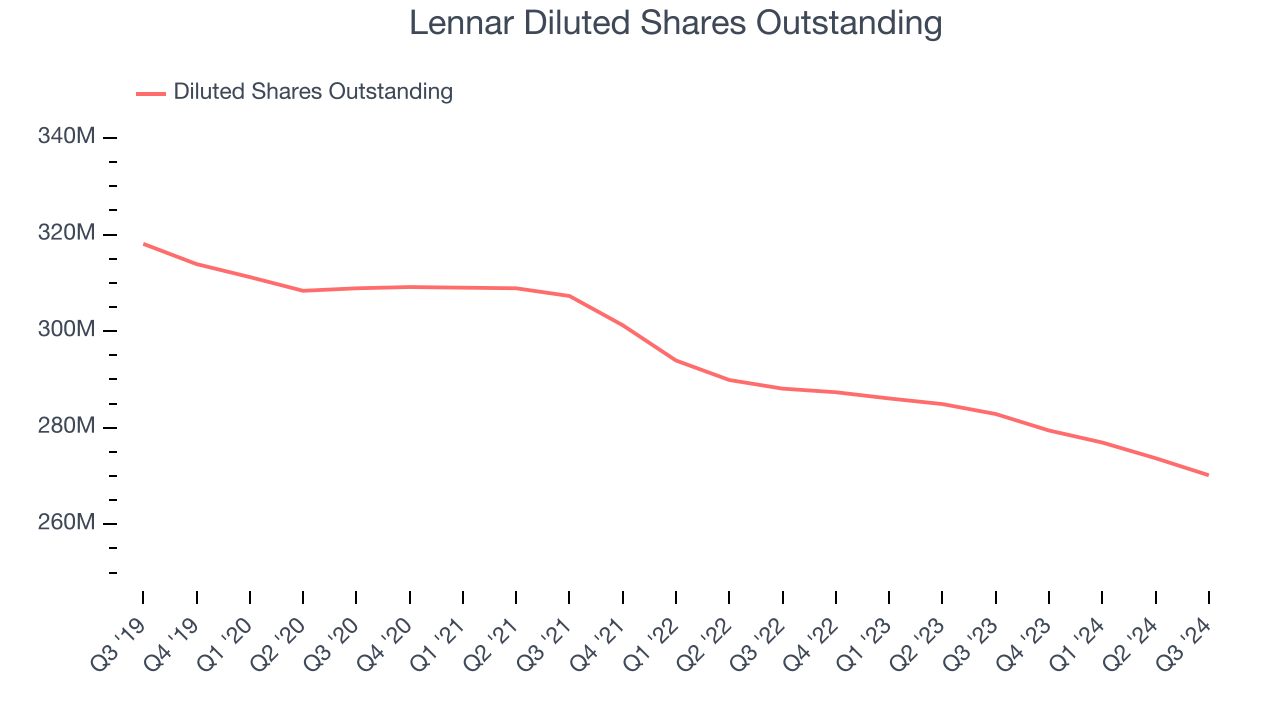
Like with revenue, we analyze EPS over a more recent period because it can give insight into an emerging theme or development for the business. For Lennar, EPS didn’t budge over the last two years, a regression from its five-year trend. We hope it can revert to earnings growth in the coming years.
In Q3, Lennar reported EPS at $4.26, up from $3.92 in the same quarter last year. This print easily cleared analysts’ estimates, and shareholders should be content with the results. Over the next 12 months, Wall Street expects Lennar’s full-year EPS of $15.22 to grow by 2.5%.
Key Takeaways from Lennar’s Q3 Results
We liked that Lennar blew beat analysts’ revenue and EPS expectations this quarter. On the other hand, its backlog missed, and since this is a leading indicator of future topline performance, it is an area of focus. Overall, this was a mixed quarter. The stock traded down 1.9% to $188.83 immediately after reporting.
Is Lennar an attractive investment opportunity right now?If you’re making that decision, you should consider the bigger picture of valuation, business qualities, as well as the latest earnings.We cover that in our actionable full research report which you can read here, it’s free.
