
Hospitality and casino entertainment company MGM Resorts (NYSE:MGM) beat analysts' expectations in Q1 CY2024, with revenue up 13.2% year on year to $4.38 billion. It made a non-GAAP profit of $0.74 per share, improving from its profit of $0.44 per share in the same quarter last year.
MGM Resorts (MGM) Q1 CY2024 Highlights:
- Revenue: $4.38 billion vs analyst estimates of $4.23 billion (3.7% beat)
- Adjusted EBITDA: $1.23 billion vs analyst estimates of $1.18 billion (4.7% beat)
- EPS (non-GAAP): $0.74 vs analyst estimates of $0.58 (28.6% beat)
- Gross Margin (GAAP): 46.4%, down from 48.7% in the same quarter last year
- Free Cash Flow of $377.2 million, similar to the previous quarter
- Market Capitalization: $12.5 billion
Operating several properties on the Las Vegas Strip, MGM Resorts (NYSE:MGM) is a global hospitality and entertainment company known for its resorts and casinos.
MGM Resorts was established to be more than a casino operator, aiming to offer comprehensive entertainment and hospitality experiences. This ambition led the company to create destination resorts that blend casino gaming with a full spectrum of resort amenities, including massive pools and all-you-can-eat buffets.
MGM Resorts operates a diverse property portfolio with destinations around the world. The company serves a broad audience, including leisure travelers, gaming enthusiasts, business professionals, and event organizers.
MGM Resorts has also adapted to the online age by introducing digital casino games that can be played from your phone along with a digital sportsbook, BetMGM. It generates its revenue from casino games, sports betting, hotel stays, dining, entertainment, and convention services.
Casino Operator
Casino operators enjoy limited competition because gambling is a highly regulated industry. These companies can also enjoy healthy margins and profits. Have you ever heard the phrase ‘the house always wins’? Regulation cuts both ways, however, and casinos may face stroke-of-the-pen risk that suddenly limits what they can or can't do and where they can do it. Furthermore, digitization is changing the game, pun intended. Whether it’s online poker or sports betting on your smartphone, innovation is forcing these players to adapt to changing consumer preferences, such as being able to wager anywhere on demand.
Competitors in the casino and hospitality industry include Caesars Entertainment (NASDAQ:CZR), Las Vegas Sands (NYSE:LVS), and Wynn Resorts (NASDAQ:WYNN).Sales Growth
Reviewing a company's long-term performance can reveal insights into its business quality. Any business can have short-term success, but a top-tier one sustains growth for years. MGM Resorts's annualized revenue growth rate of 6.6% over the last five years was weak for a consumer discretionary business. 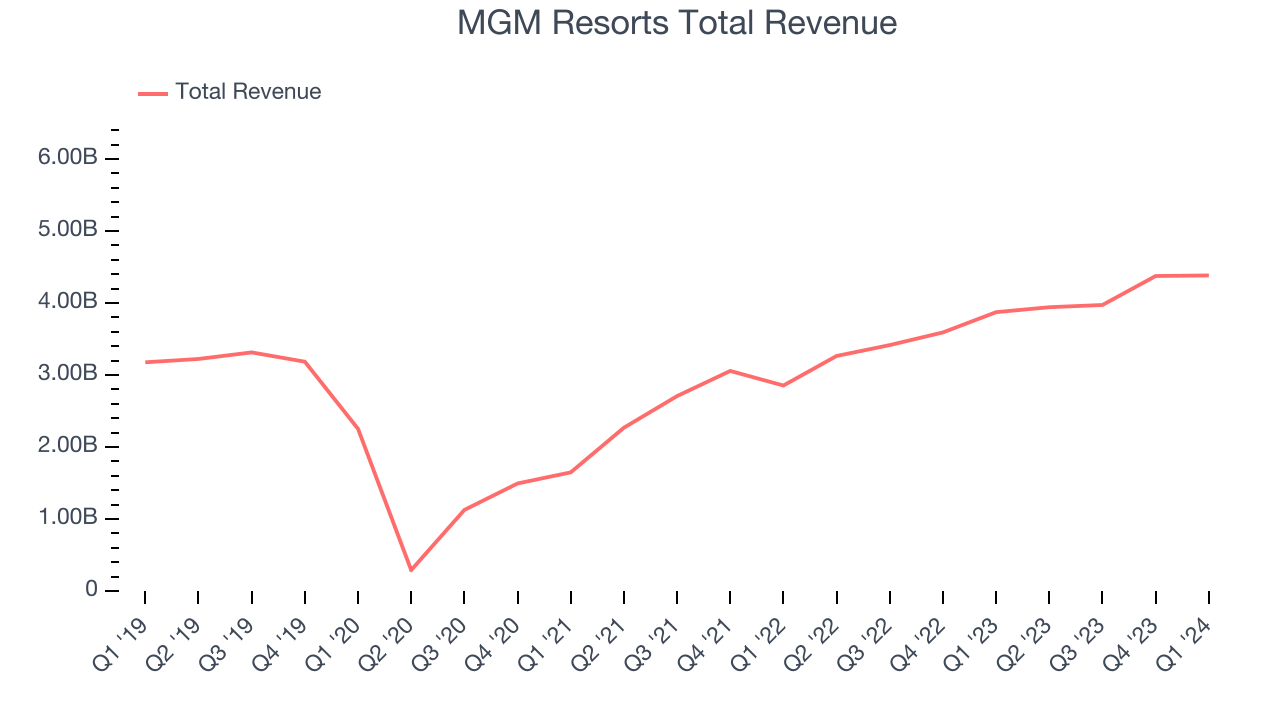 Within consumer discretionary, a long-term historical view may miss a company riding a successful new product or emerging trend. That's why we also follow short-term performance. MGM Resorts's annualized revenue growth of 23.8% over the last two years is above its five-year trend, suggesting some bright spots.
We can dig even further into the company's revenue dynamics by analyzing its most important segment, Casino. Over the last two years, MGM Resorts's Casino revenue (Poker, sports betting) averaged 23.3% year-on-year growth.
This quarter, MGM Resorts reported robust year-on-year revenue growth of 13.2%, and its $4.38 billion of revenue exceeded Wall Street's estimates by 3.7%. Looking ahead, Wall Street expects revenue to remain flat over the next 12 months, a deceleration from this quarter.
Operating Margin
Operating margin is a key measure of profitability. Think of it as net income–the bottom line–excluding the impact of taxes and interest on debt, which are less connected to business fundamentals.
MGM Resorts has done a decent job managing its expenses over the last eight quarters. The company has produced an average operating margin of 12%, higher than the broader consumer discretionary sector.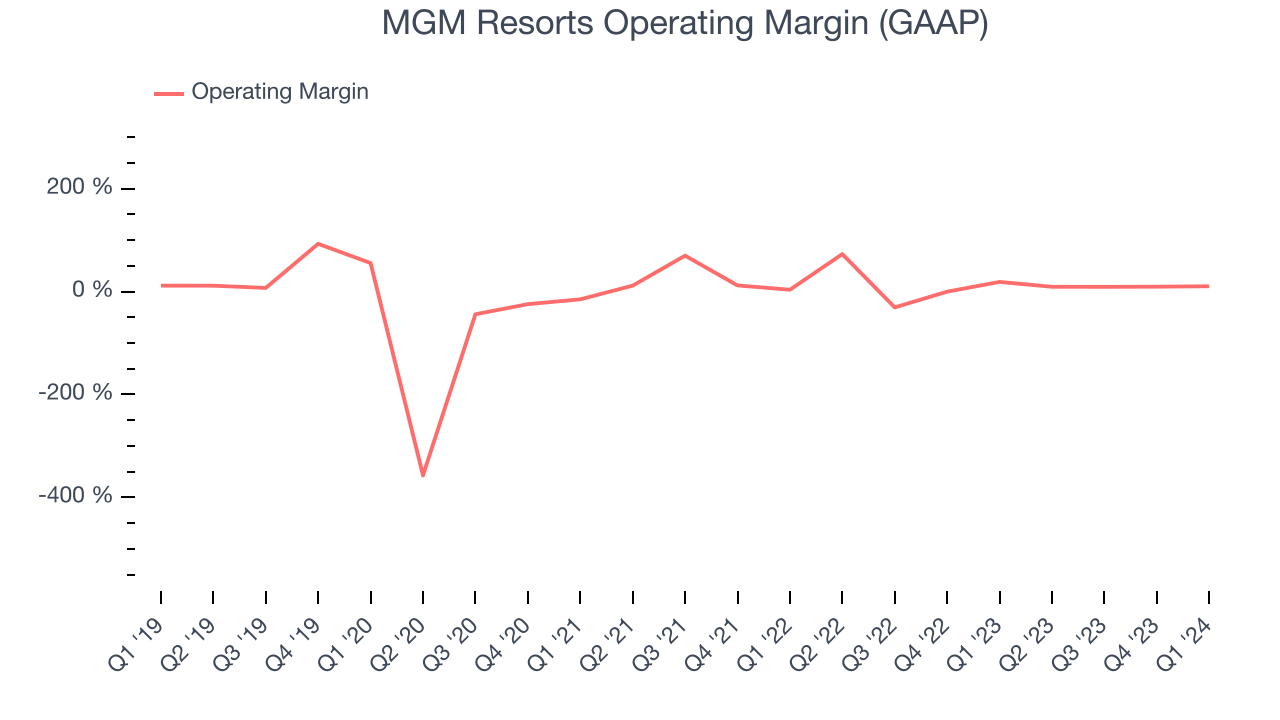
In Q1, MGM Resorts generated an operating profit margin of 10.5%, down 8.4 percentage points year on year.
Over the next 12 months, Wall Street expects MGM Resorts to become more profitable. Analysts are expecting the company’s LTM operating margin of 9.7% to rise to 10.9%.EPS
We track long-term historical earnings per share (EPS) growth for the same reason as long-term revenue growth. Compared to revenue, however, EPS highlights whether a company's growth was profitable. 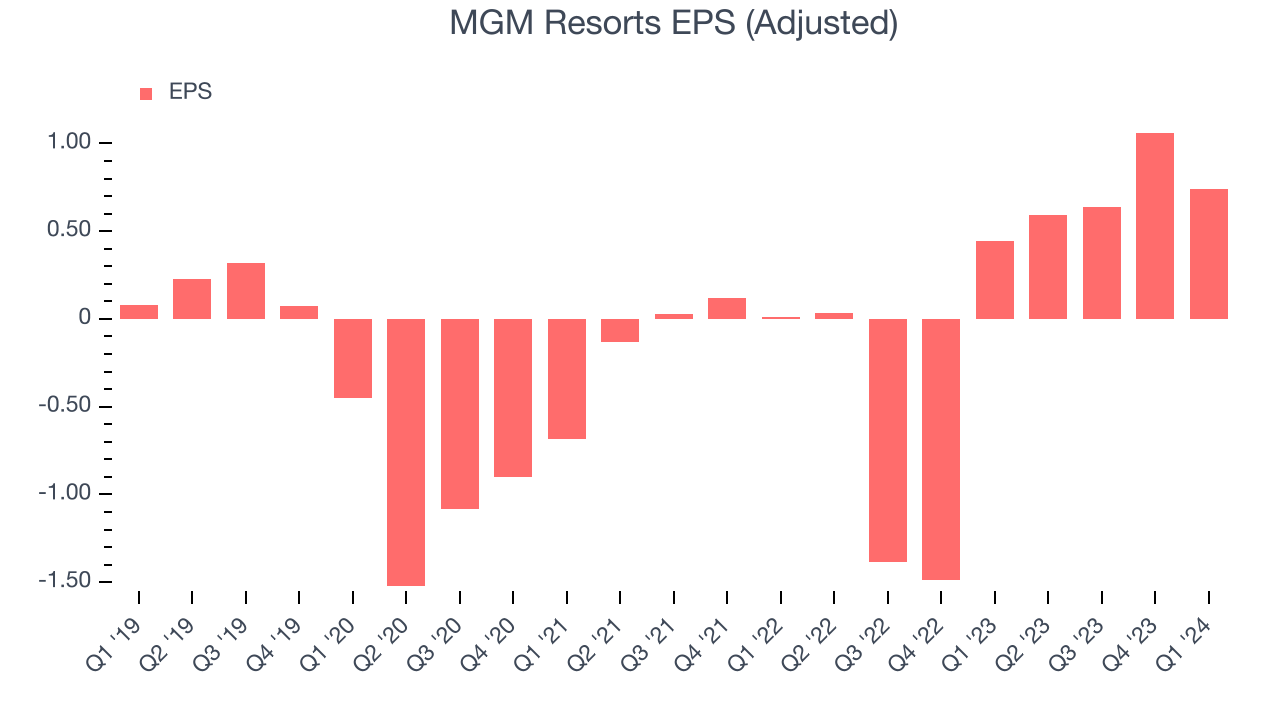
Over the last five years, MGM Resorts's EPS grew 435%, translating into an astounding 39.9% compounded annual growth rate. This performance is materially higher than its 6.6% annualized revenue growth over the same period. Let's dig into why.
A five-year view shows that MGM Resorts has repurchased its stock, shrinking its share count by 39.8%. This has led to higher per share earnings. Taxes and interest expenses can also affect EPS growth, but they don't tell us as much about a company's fundamentals.In Q1, MGM Resorts reported EPS at $0.74, up from $0.44 in the same quarter last year. This print beat analysts' estimates by 28.6%. Over the next 12 months, Wall Street expects MGM Resorts to perform poorly. Analysts are projecting its LTM EPS of $3.03 to shrink by 16.2% to $2.54.
Cash Is King
Although earnings are undoubtedly valuable for assessing company performance, we believe cash is king because you can't use accounting profits to pay the bills.
Over the last two years, MGM Resorts has shown mediocre cash profitability, putting it in a pinch as it gives the company limited opportunities to reinvest, pay down debt, or return capital to shareholders. Its free cash flow margin has averaged 9.1%, subpar for a consumer discretionary business.
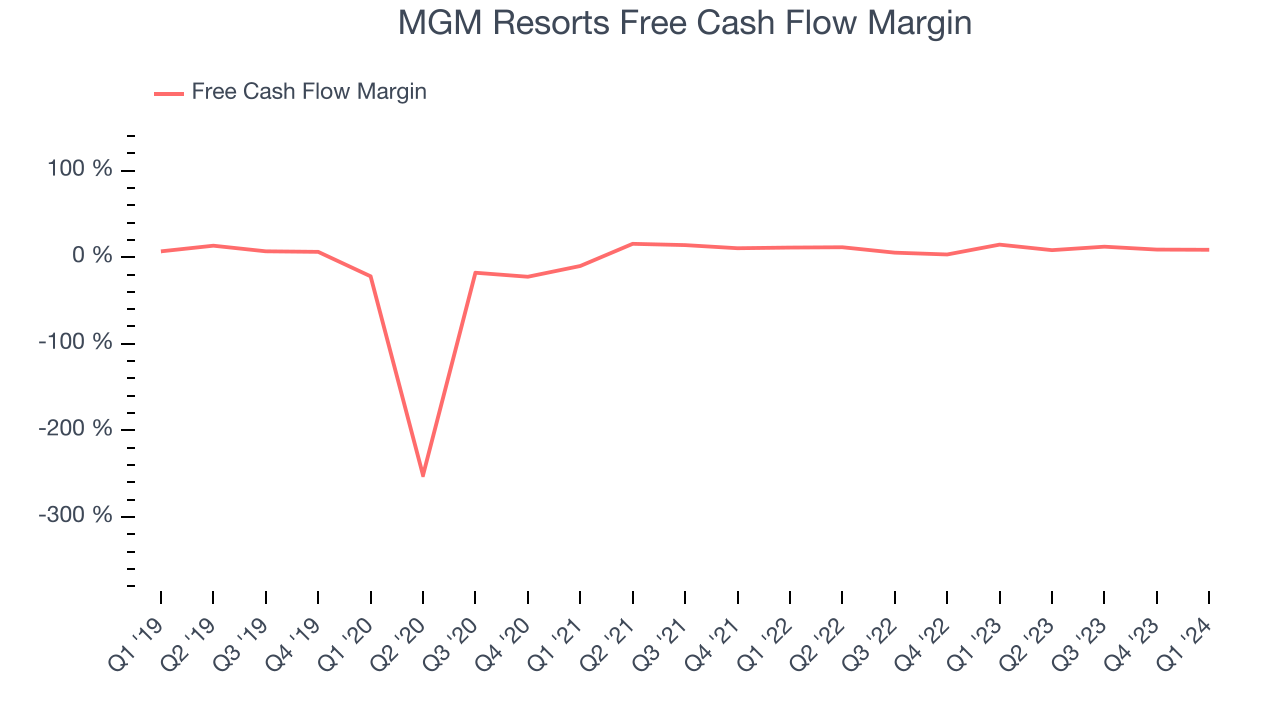
MGM Resorts's free cash flow came in at $377.2 million in Q1, equivalent to a 8.6% margin and down 33.1% year on year.
Return on Invested Capital (ROIC)
EPS and free cash flow tell us whether a company was profitable while growing revenue. But was it capital-efficient? Enter ROIC, a metric showing how much operating profit a company generates relative to how much money the business raised (debt and equity).
MGM Resorts's five-year average return on invested capital was 10.4%, somewhat low compared to the best consumer discretionary companies that pump out 25%+. Its returns suggest it historically did a subpar job investing in profitable business initiatives.
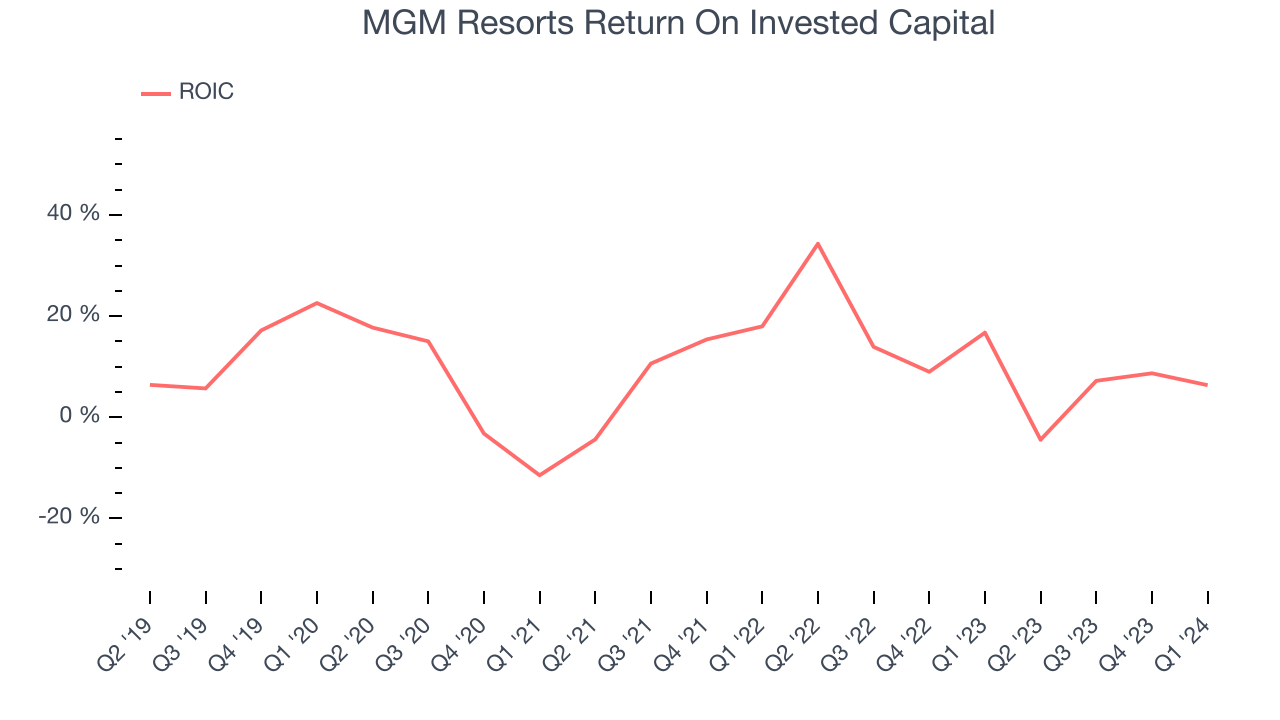
The trend in its ROIC, however, is often what surprises the market and drives the stock price. Over the last few years, MGM Resorts's ROIC averaged 6 percentage point increases. This is a good sign, and if the company's returns keep rising, there's a chance it could evolve into an investable business.
Balance Sheet Risk
Debt is a tool that can boost company returns but presents risks if used irresponsibly.
MGM Resorts's $31.5 billion of debt exceeds the $2.72 billion of cash on its balance sheet. Furthermore, its 12x net-debt-to-EBITDA ratio (based on its EBITDA of $2.44 billion over the last 12 months) shows the company is overleveraged.
At this level of debt, incremental borrowing becomes increasingly expensive and credit agencies could downgrade the company’s rating if profitability falls. MGM Resorts could also be backed into a corner if the market turns unexpectedly – a situation we seek to avoid as investors in high-quality companies.
We hope MGM Resorts can improve its balance sheet and remain cautious until it increases its profitability or reduces its debt.
Key Takeaways from MGM Resorts's Q1 Results
We liked how MGM Resorts beat revenue, adjusted EBITDA, and EPS expectations this quarter. Management attributed the good performance to "...strong performance at MGM China and in Las Vegas specifically at our luxury resort properties." Zooming out, we think this was a very solid quarter. The stock is up 2% after reporting and currently trades at $40.52 per share.
Is Now The Time?
MGM Resorts may have had a good quarter, but investors should also consider its valuation and business qualities when assessing the investment opportunity.
MGM Resorts isn't a bad business, but it probably wouldn't be one of our picks. Its revenue growth has been uninspiring over the last five years, and analysts expect growth to deteriorate from here. And while its EPS growth over the last five years has been fantastic, the downside is its projected EPS for the next year is lacking. On top of that, its relatively low ROIC suggests it has historically struggled to find compelling business opportunities.
MGM Resorts's price-to-earnings ratio based on the next 12 months is 15.7x. In the end, beauty is in the eye of the beholder. While MGM Resorts wouldn't be our first pick, if you like the business, the shares are trading at a pretty interesting price right now.
Wall Street analysts covering the company had a one-year price target of $55.19 per share right before these results (compared to the current share price of $40.52).
To get the best start with StockStory, check out our most recent stock picks, and then sign up for our earnings alerts by adding companies to your watchlist here. We typically have the quarterly earnings results analyzed within seconds of the data being released, and especially for companies reporting pre-market, this often gives investors the chance to react to the results before the market has fully absorbed the information.