
Flooring manufacturer Mohawk Industries (NYSE:MHK) reported Q1 CY2024 results topping analysts' expectations, with revenue down 4.5% year on year to $2.68 billion. It made a non-GAAP profit of $1.86 per share, improving from its profit of $1.75 per share in the same quarter last year.
Mohawk Industries (MHK) Q1 CY2024 Highlights:
- Revenue: $2.68 billion vs analyst estimates of $2.64 billion (1.4% beat)
- EPS (non-GAAP): $1.86 vs analyst estimates of $1.68 (11% beat)
- Gross Margin (GAAP): 24.2%, up from 24% in the same quarter last year
- Free Cash Flow of $96.9 million, up 73.2% from the previous quarter
- Market Capitalization: $7.11 billion
Established in 1878, Mohawk Industries (NYSE:MHK) is a leading producer of floor-covering products for both residential and commercial applications.
The company's product portfolio includes carpets, rugs, ceramic tile, laminate, wood, stone, and vinyl flooring, catering to diverse consumers and commercial needs.
To capture market share, the company has developed new technologies and materials for flooring, such as its SmartStrand carpet, which features built-in stain resistance, and its RevWood laminate, known for its durability and natural appearance. These features are designed to enhance product longevity.
Mohawk Industries’ strategy includes expansive acquisitions and partnerships. The company has acquired several key players in the flooring industry, such as Marazzi Group and IVC Group. These deals increased Mohawk's geographic footprint and ability to cater to varying market preferences and trends.
The company's distribution and sales strategy is another key factor. Mohawk Industries utilizes a multi-channel approach, selling through independent distributors, retailers, home centers, and its own retail showrooms. This broad distribution network enables the company to effectively reach a wide customer base, providing flexibility and convenience for its consumers.
Home Furnishings
A healthy housing market is good for furniture demand as more consumers are buying, renting, moving, and renovating. On the other hand, periods of economic weakness or high interest rates discourage home sales and can squelch demand. In addition, home furnishing companies must contend with shifting consumer preferences such as the growing propensity to buy goods online, including big things like mattresses and sofas that were once thought to be immune from e-commerce competition.
Mohawk Industries' primary competitors include Shaw Industries (owned by Berkshire Hathaway NYSE:BRK.A), Armstrong Flooring (NYSE:AFI), Tarkett (EPA:TKTT), Interface (NASDAQ:TILE), and private company Mannington Mills.Sales Growth
Reviewing a company's long-term performance can reveal insights into its business quality. Any business can have short-term success, but a top-tier one sustains growth for years. Mohawk Industries's annualized revenue growth rate of 1.9% over the last five years was weak for a consumer discretionary business. 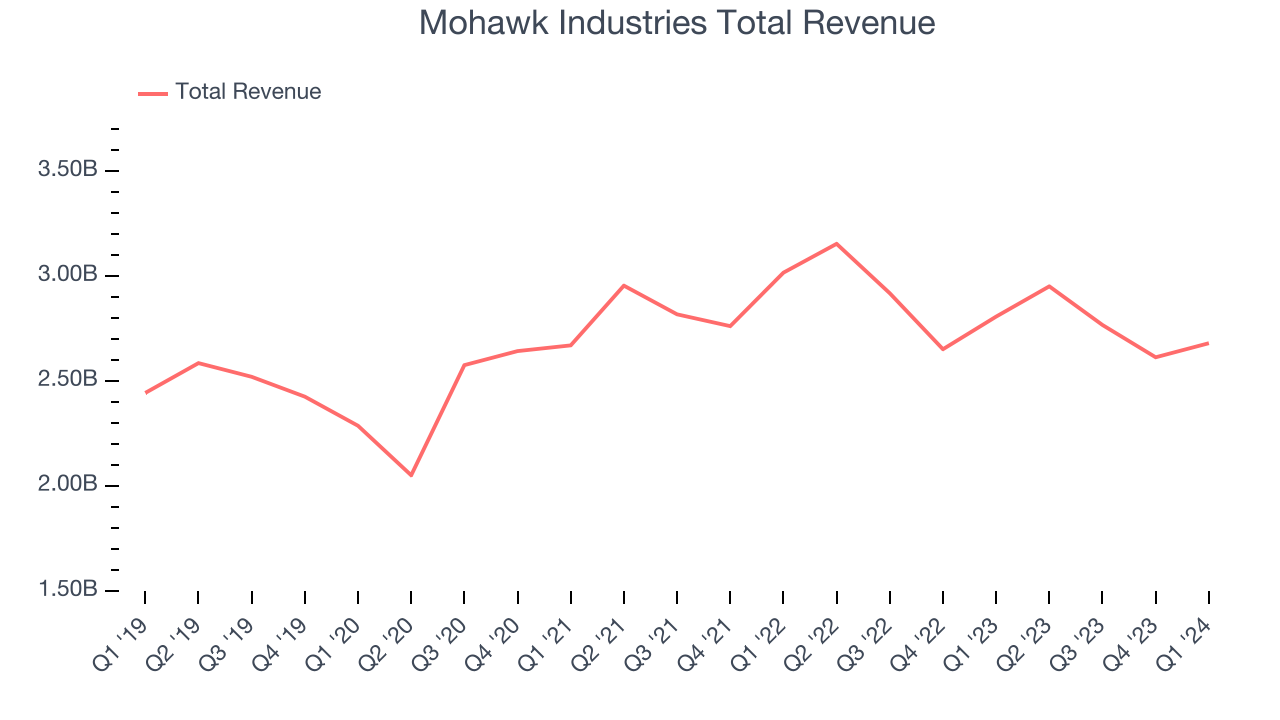 Within consumer discretionary, a long-term historical view may miss a company riding a successful new product or emerging trend. That's why we also follow short-term performance. Mohawk Industries's recent history shows a reversal from its already weak five-year trend as its revenue has shown annualized declines of 2.4% over the last two years.
This quarter, Mohawk Industries's revenue fell 4.5% year on year to $2.68 billion but beat Wall Street's estimates by 1.4%. Looking ahead, Wall Street expects revenue to remain flat over the next 12 months.
Operating Margin
Operating margin is an important measure of profitability. It’s the portion of revenue left after accounting for all core expenses–everything from the cost of goods sold to advertising and wages. Operating margin is also useful for comparing profitability across companies with different levels of debt and tax rates because it excludes interest and taxes.
Mohawk Industries was roughly breakeven when averaging the last two years of quarterly operating profits, weak for a consumer discretionary business.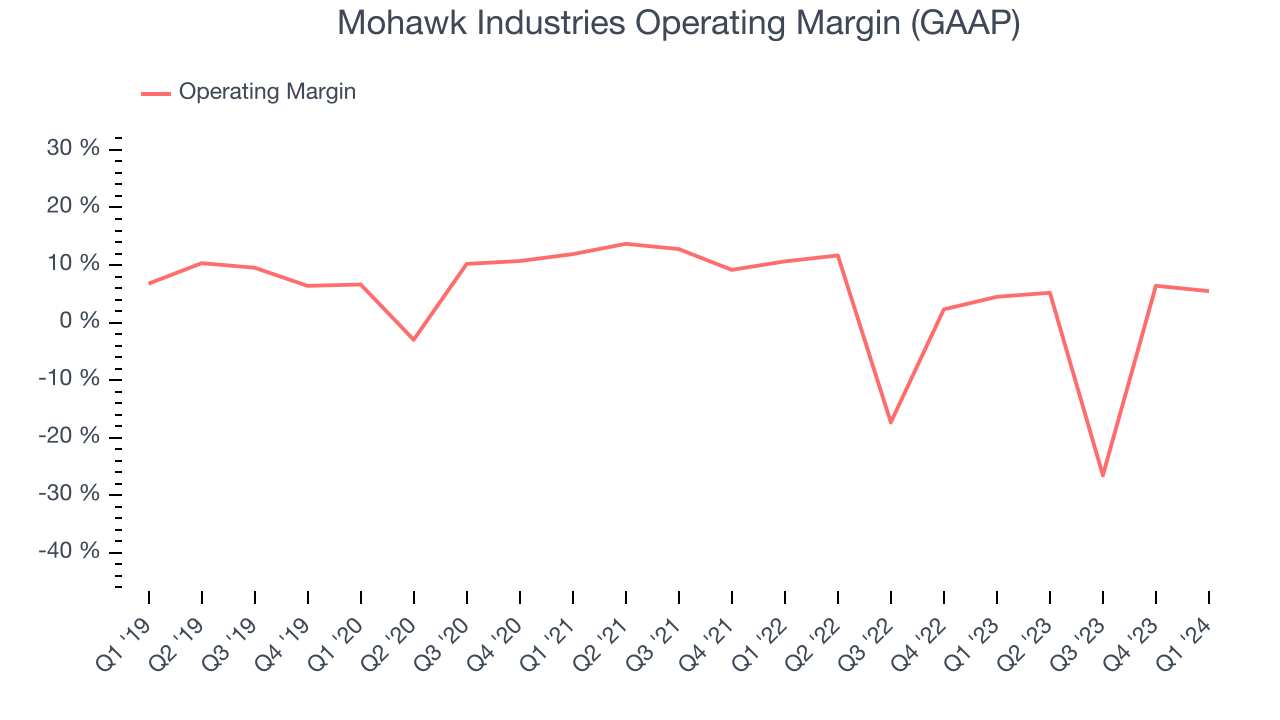
In Q1, Mohawk Industries generated an operating profit margin of 5.5%, in line with the same quarter last year. This indicates the company's costs have been relatively stable.
Over the next 12 months, Wall Street expects Mohawk Industries to become profitable. Analysts are expecting the company’s LTM operating margin of negative 2.4% to rise to positive 7.9%.EPS
We track long-term historical earnings per share (EPS) growth for the same reason as long-term revenue growth. Compared to revenue, however, EPS highlights whether a company's growth was profitable. 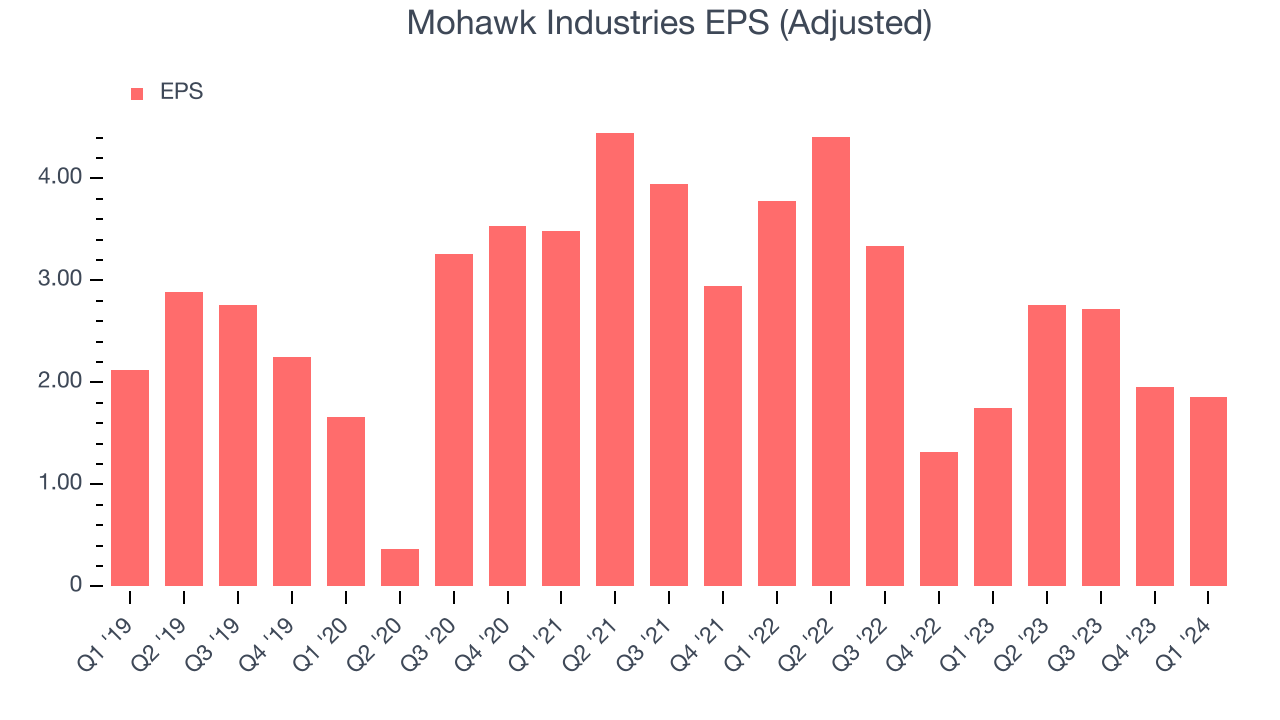
Over the last five years, Mohawk Industries's EPS dropped 22.2%, translating into 4.1% annualized declines. We tend to steer our readers away from companies with falling EPS, where diminishing earnings could imply changing secular trends or consumer preferences. Consumer discretionary companies are particularly exposed to this, leaving a low margin of safety around the company (making the stock susceptible to large downward swings).
In Q1, Mohawk Industries reported EPS at $1.86, up from $1.75 in the same quarter last year. This print beat analysts' estimates by 11%. Over the next 12 months, Wall Street expects Mohawk Industries to grow its earnings. Analysts are projecting its LTM EPS of $9.29 to climb by 8.3% to $10.06.
Cash Is King
If you've followed StockStory for a while, you know we emphasize free cash flow. Why, you ask? We believe that in the end, cash is king, and you can't use accounting profits to pay the bills.
Over the last two years, Mohawk Industries has shown mediocre cash profitability, putting it in a pinch as it gives the company limited opportunities to reinvest, pay down debt, or return capital to shareholders. Its free cash flow margin has averaged 4.3%, subpar for a consumer discretionary business.
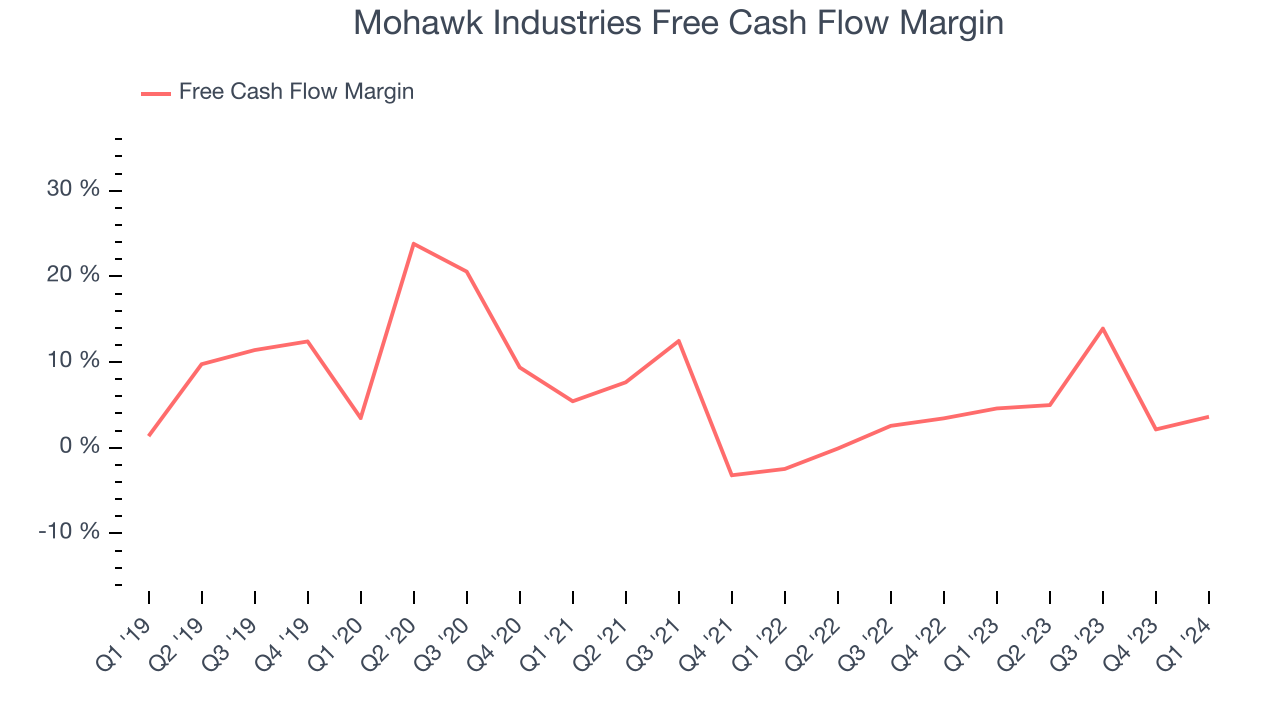
Mohawk Industries's free cash flow came in at $96.9 million in Q1, equivalent to a 3.6% margin and down 24.8% year on year. Over the next year, analysts predict Mohawk Industries's cash profitability will improve. Their consensus estimates imply its LTM free cash flow margin of 6.2% will increase to 7.3%.
Return on Invested Capital (ROIC)
EPS and free cash flow tell us whether a company was profitable while growing revenue. But was it capital-efficient? A company’s ROIC explains this by showing how much operating profit a company makes compared to how much money the business raised (debt and equity).
Mohawk Industries's five-year average return on invested capital was 4.5%, somewhat low compared to the best consumer discretionary companies that pump out 25%+. Its returns suggest it historically did a subpar job investing in profitable business initiatives.
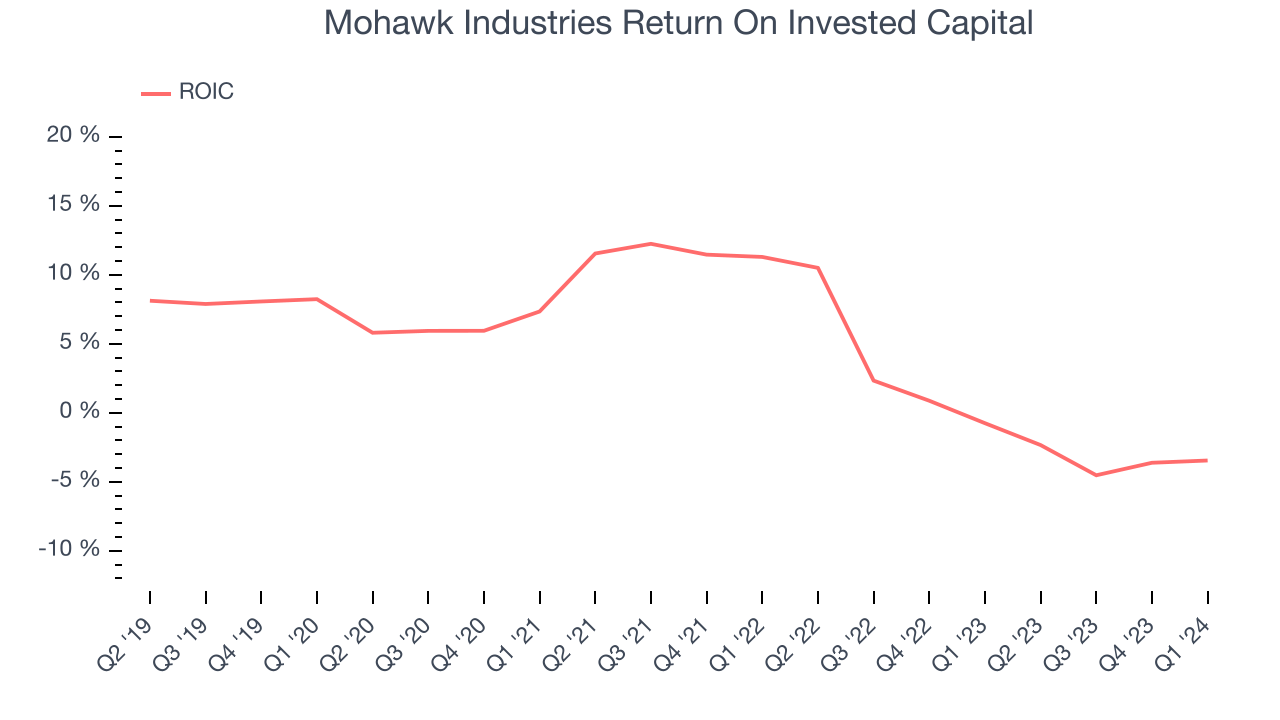
The trend in its ROIC, however, is often what surprises the market and drives the stock price. Unfortunately, Mohawk Industries's ROIC averaged 9.9 percentage point decreases over the last few years. Paired with its already low returns, these declines suggest the company's profitable business opportunities are few and far between.
Balance Sheet Risk
Debt is a tool that can boost company returns but presents risks if used irresponsibly.
Mohawk Industries reported $658.5 million of cash and $3.06 billion of debt on its balance sheet in the most recent quarter. As investors in high-quality companies, we primarily focus on two things: 1) that a company's debt level isn't too high and 2) that its interest payments are not excessively burdening the business.
With $1.43 billion of EBITDA over the last 12 months, we view Mohawk Industries's 1.7x net-debt-to-EBITDA ratio as safe. We also see its $46.58 million of annual interest expenses as appropriate. The company's profits give it plenty of breathing room, allowing it to continue investing in new initiatives.
Key Takeaways from Mohawk Industries's Q1 Results
It was good to see Mohawk Industries beat analysts' revenue and adjusted EPS expectations this quarter. On the other hand, its free cash flow and operating margin missed Wall Street's estimates. Management didn't provide any guidance but noted macroeconomic weakness. Specifically, the demand for residential remodeling is falling as inflation is suppressing discretionary spending. Overall, we think this was still a mixed quarter, and the company's commentary makes us uneasy. The stock is flat after reporting and currently trades at $110.27 per share.
Is Now The Time?
Mohawk Industries may have had a favorable quarter, but investors should also consider its valuation and business qualities when assessing the investment opportunity.
We cheer for all companies serving consumers, but in the case of Mohawk Industries, we'll be cheering from the sidelines. Its revenue growth has been weak over the last five years, and analysts expect growth to deteriorate from here. On top of that, its organic sales performance has been disappointing, and its relatively low ROIC suggests it has historically struggled to find compelling business opportunities.
Mohawk Industries's price-to-earnings ratio based on the next 12 months is 11.0x. While there are some things to like about Mohawk Industries and its valuation is reasonable, we think there are better opportunities elsewhere in the market right now.
Wall Street analysts covering the company had a one-year price target of $125.83 per share right before these results (compared to the current share price of $110.27).
To get the best start with StockStory, check out our most recent stock picks, and then sign up for our earnings alerts by adding companies to your watchlist here. We typically have the quarterly earnings results analyzed within seconds of the data being released, and especially for companies reporting pre-market, this often gives investors the chance to react to the results before the market has fully absorbed the information.