
Athletic apparel brand Nike (NYSE:NKE) beat analysts' expectations in Q1 CY2024, with revenue flat year on year at $12.43 billion. It made a non-GAAP profit of $0.98 per share, improving from its profit of $0.79 per share in the same quarter last year.
Nike (NKE) Q1 CY2024 Highlights:
- Revenue: $12.43 billion vs analyst estimates of $12.3 billion (1.1% beat)
- EPS (non-GAAP): $0.98 vs analyst estimates of $0.75 (29.9% beat)
- Gross Margin (GAAP): 44.8%, up from 43.3% in the same quarter last year
- Market Capitalization: $151.9 billion
Originally selling Japanese Onitsuka Tiger sneakers as Blue Ribbon Sports, Nike (NYSE:NKE) is a global titan in athletic footwear, apparel, equipment, and accessories.
Nike's extensive product line covers a range of sports and fitness activities. The company is known for its athletic footwear with iconic series such as Air Jordan, Air Max, and Nike Free. These products are not just functional; they are also fashion statements, often setting trends in the broader footwear and apparel industry. In apparel, Nike offers everything from sports uniforms to casual wear.
To make its products, Nike primarily outsources manufacturing to various suppliers globally, leveraging cost efficiencies and scale production according to demand. This network of suppliers is managed under strict guidelines to maintain quality and ethical standards in production. Consumers can find the company’s products in its brick-and-mortar locations, department stores, and online.
While Nike's image has been crafted around elite athletes, its customers include everyone from a middle school boy idolizing NBA players to a middle-aged yoga enthusiast. Because of its broad customer base that spans all income levels, Nike sells its product in a wide variety of channels from mass merchandisers to higher-end retailers. Department stores, fashion-focused retailers, athletic footwear stores, and a variety of e-commerce sites also carry Nike products.
Over the last decade, Nike has increasingly sold directly to consumers through its own branded stores and website, where it achieves higher profit margins and can release exclusive products and designs that are not available at your local retailer.
Footwear
Before the advent of the internet, styles changed, but consumers mainly bought shoes by visiting local brick-and-mortar shoe, department, and specialty stores. Today, not only do styles change more frequently as fads travel through social media and the internet but consumers are also shifting the way they buy their goods, favoring omnichannel and e-commerce experiences. Some footwear companies have made concerted efforts to adapt while those who are slower to move may fall behind.
Nike's primary competitors include Adidas (ETR:ADS), Under Armour (NYSE:UAA), Puma (ETR:PUM), ASICS (TYO:7936), Columbia Sportswear (NASDAQ:COLM), and Reebok (owned by private company Authentic Brands Group).Sales Growth
A company's long-term performance can indicate its business quality. Any business can enjoy short-lived success, but best-in-class ones sustain growth over many years. Nike's annualized revenue growth rate of 5.9% over the last five years was weak for a consumer discretionary business. 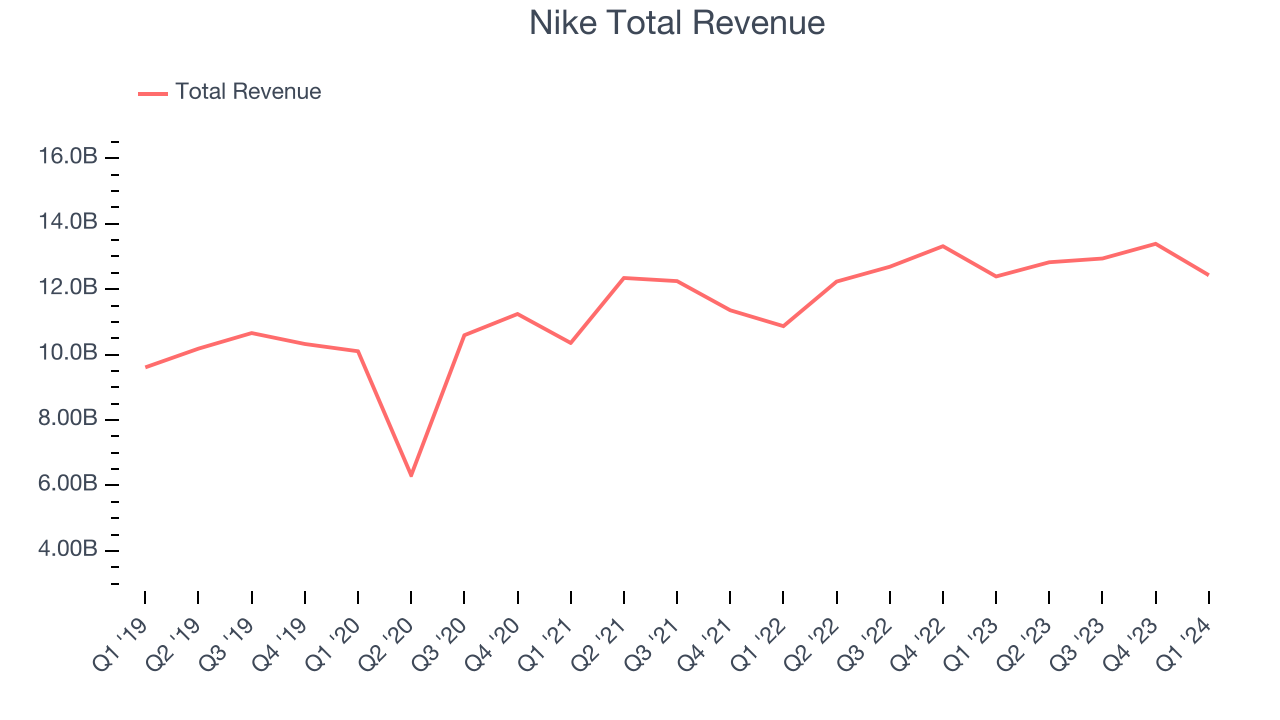 Within consumer discretionary, a long-term historical view may miss a company riding a successful new product or emerging trend. That's why we also follow short-term performance. Nike's annualized revenue growth of 5% over the last two years aligns with its five-year revenue growth, suggesting the company's demand has been stable.
Nike also reports sales performance excluding currency movements, which are outside the company’s control and not indicative of demand. Over the last two years, its constant currency sales averaged 8.5% year-on-year growth. Because this number is higher than its revenue growth during the same period, we can see that foreign exchange rates have been a headwind for Nike. 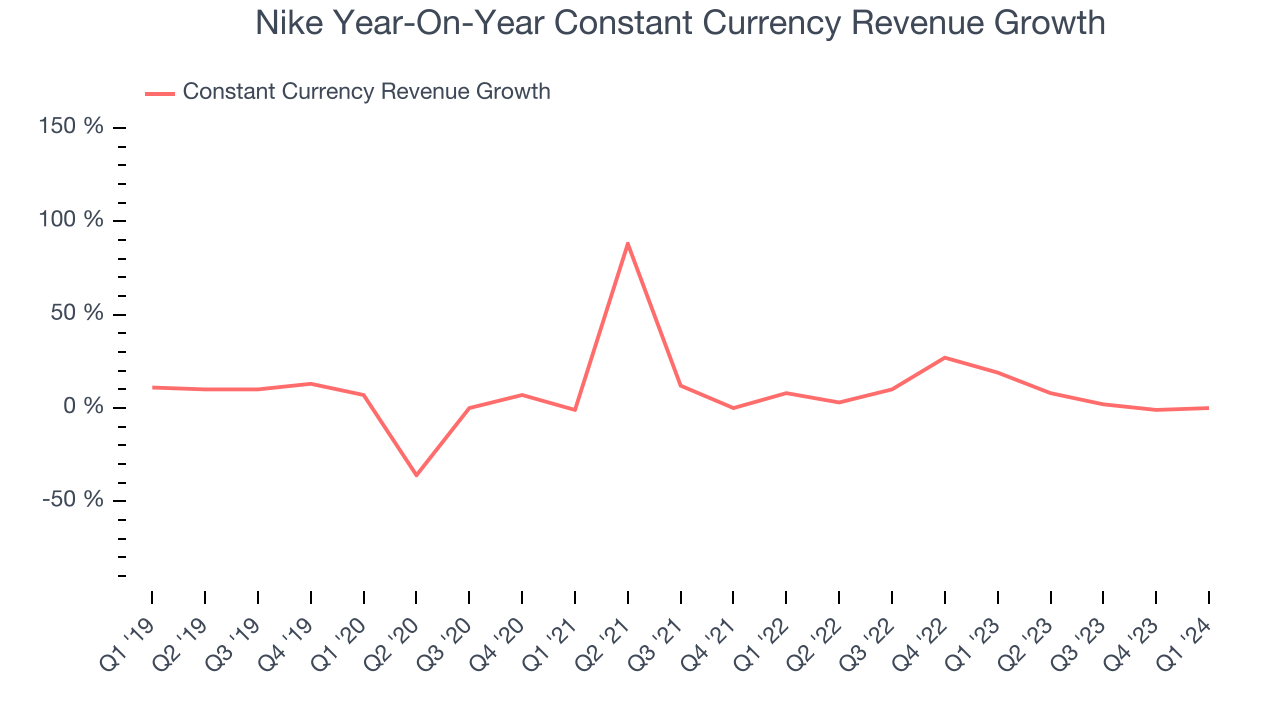
This quarter, Nike's $12.43 billion of revenue was flat year on year but beat Wall Street's estimates by 1.1%. Looking ahead, Wall Street expects sales to grow 4.3% over the next 12 months, an acceleration from this quarter.
Operating Margin
Operating margin is an important measure of profitability. It’s the portion of revenue left after accounting for all core expenses–everything from the cost of goods sold to advertising and wages. Operating margin is also useful for comparing profitability across companies with different levels of debt and tax rates because it excludes interest and taxes.
Nike has done a decent job managing its expenses over the last eight quarters. The company has produced an average operating margin of 11.9%, higher than the broader consumer discretionary sector.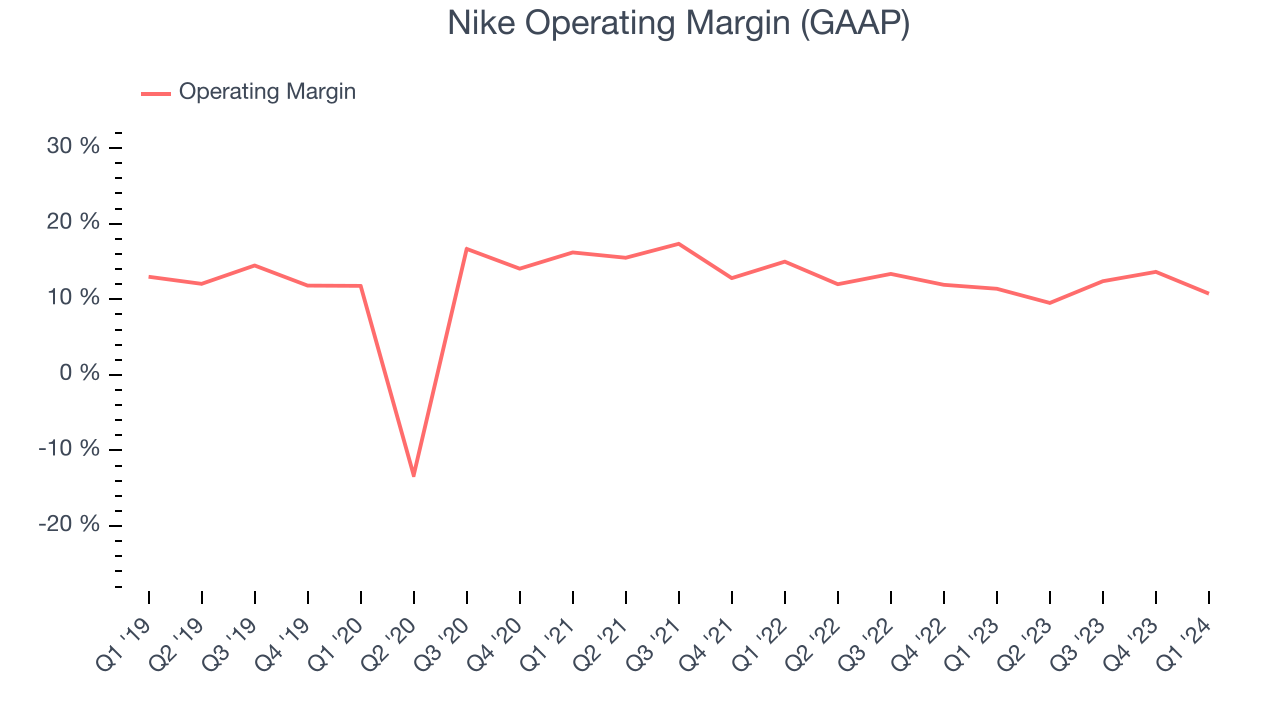
In Q1, Nike generated an operating profit margin of 10.7%, in line with the same quarter last year. This indicates the company's costs have been relatively stable.
Over the next 12 months, Wall Street expects Nike to become more profitable. Analysts are expecting the company’s LTM operating margin of 11.6% to rise to 13.4%.EPS
We track long-term historical earnings per share (EPS) growth for the same reason as long-term revenue growth. Compared to revenue, however, EPS highlights whether a company's growth was profitable. 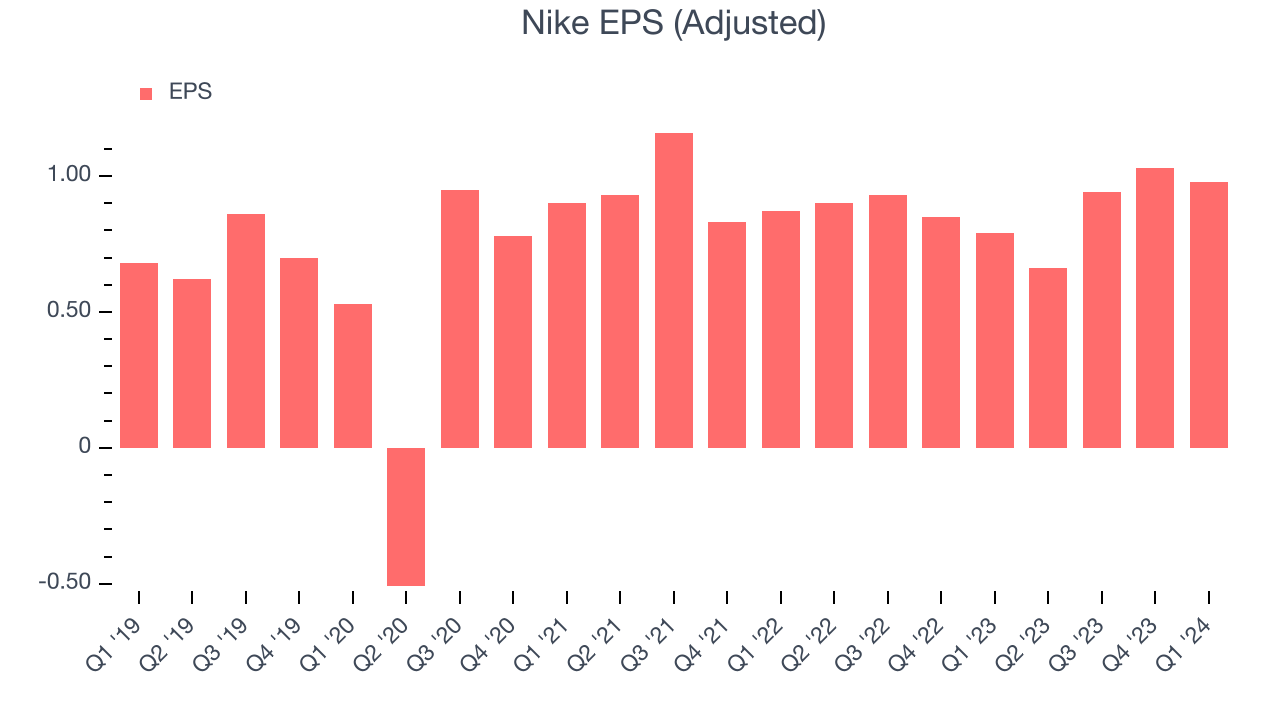
Over the last five years, Nike's EPS grew 41%, translating into an unimpressive 7.1% compounded annual growth rate. This performance, however, is higher than its 5.9% annualized revenue growth over the same period. Let's dig into why. A five-year view shows that Nike has repurchased its stock, shrinking its share count by 5.2%. This has led to higher per share earnings. Taxes and interest expenses can also affect EPS growth, but they don't tell us as much about a company's fundamentals.
In Q1, Nike reported EPS at $0.98, up from $0.79 in the same quarter a year ago. This print beat analysts' estimates by 29.9%. Over the next 12 months, Wall Street expects Nike to grow its earnings. Analysts are projecting its LTM EPS of $3.61 to climb by 12.9% to $4.08.
Return on Invested Capital (ROIC)
EPS and free cash flow tell us whether a company was profitable while growing revenue. But was it capital-efficient? A company’s ROIC explains this by showing how much operating profit a company makes compared to how much money the business raised (debt and equity).
Although Nike hasn't been the highest-quality company lately because of its poor top-line performance, it historically did a wonderful job investing in profitable business initiatives. Its five-year average return on invested capital was 44.5%, splendid for a consumer discretionary business.
The trend in its ROIC, however, is often what surprises the market and drives the stock price. Unfortunately, Nike's ROIC over the last two years averaged 6.6 percentage point decreases each year. We like what management has done historically but are concerned its ROIC is declining, perhaps a symptom of waning business opportunities to invest profitably.
Key Takeaways from Nike's Q1 Results
We were impressed by how significantly Nike blew past analysts' EPS expectations this quarter. We were also happy its revenue and gross margin narrowly outperformed Wall Street's estimates, driven by strong sales of its Nike-branded goods (this excludes Converse, whose revenue dropped 20% on a constant currency basis). Specifically, Nike-branded equipment sales were up 21% year-on-year. Overall, we think this was a good quarter that should please shareholders. The stock is up 3% after reporting and currently trades at $103.78 per share.
Is Now The Time?
Nike may have had a favorable quarter, but investors should also consider its valuation and business qualities when assessing the investment opportunity.
We cheer for all companies serving consumers, but in the case of Nike, we'll be cheering from the sidelines. Its revenue growth has been uninspiring over the last five years. And while its stellar ROIC suggests it has been a well-run company historically, the downside is its constant currency sales performance has been disappointing. On top of that, its EPS growth over the last five years has been mediocre.
Nike's price-to-earnings ratio based on the next 12 months is 24.7x. While we've no doubt one can find things to like about Nike, we think there are better opportunities elsewhere in the market. We don't see many reasons to get involved at the moment.
Wall Street analysts covering the company had a one-year price target of $120.86 per share right before these results (compared to the current share price of $103.78).
To get the best start with StockStory, check out our most recent stock picks, and then sign up for our earnings alerts by adding companies to your watchlist here. We typically have the quarterly earnings results analyzed within seconds of the data being released, and especially for companies reporting pre-market, this often gives investors the chance to react to the results before the market has fully absorbed the information.