
Fashion conglomerate Oxford Industries (NYSE:OXM) fell short of analysts' expectations in Q4 CY2023, with revenue up 5.7% year on year to $404.4 million. Next quarter's revenue guidance of $405 million also underwhelmed, coming in 2.1% below analysts' estimates. It made a non-GAAP profit of $1.90 per share, down from its profit of $2.28 per share in the same quarter last year.
Oxford Industries (OXM) Q4 CY2023 Highlights:
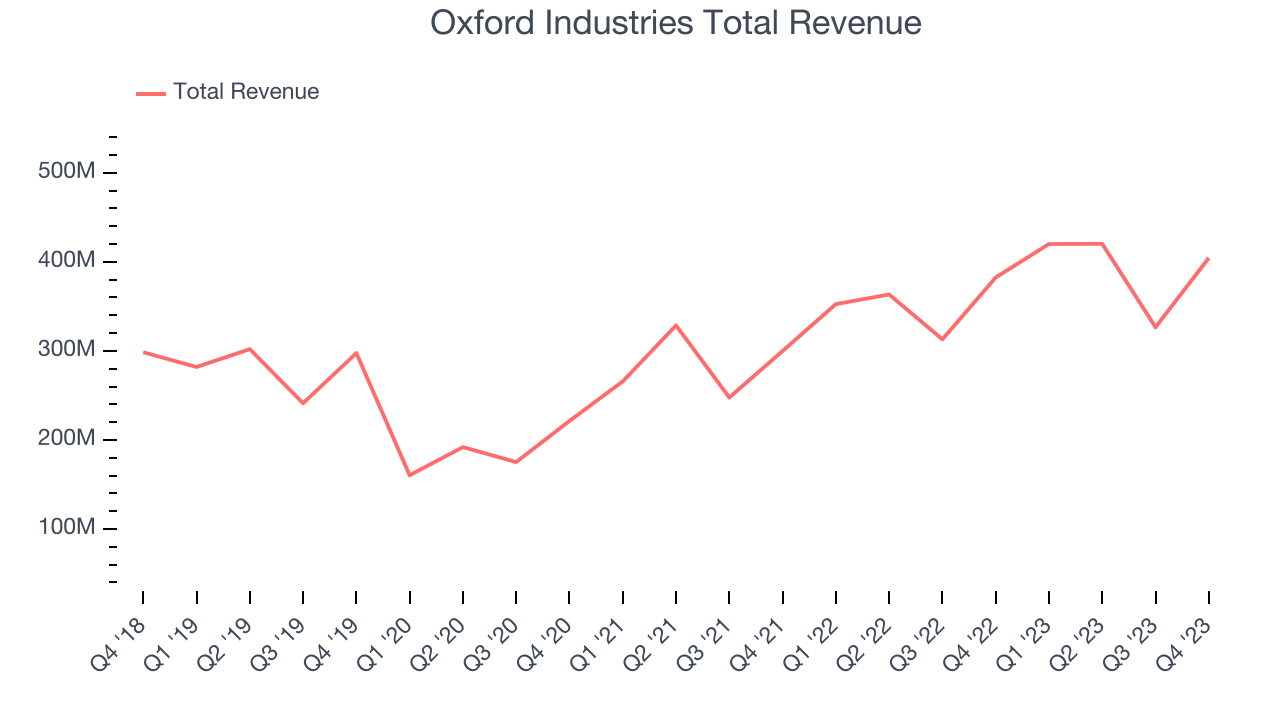
- Revenue: $404.4 million vs analyst estimates of $408.3 million (0.9% miss)
- EPS (non-GAAP): $1.90 vs analyst expectations of $1.95 (2.4% miss)
- Revenue Guidance for Q1 CY2024 is $405 million at the midpoint, below analyst estimates of $413.9 million
- EPS (non-GAAP) Guidance for Q1 CY2024 is $2.70 at the midpoint, below analyst estimates of $3.48
- Management's revenue guidance for the upcoming financial year 2024 is $1.65 billion at the midpoint, beating analyst estimates by 2.1% and implying 5% growth (vs 11.2% in FY2023)
- Gross Margin (GAAP): 60.9%, up from 59.4% in the same quarter last year
- Free Cash Flow of $117.4 million is up from -$6.19 million in the previous quarter
- Market Capitalization: $1.76 billion
The parent company of Tommy Bahama, Oxford Industries (NYSE:OXM) is a lifestyle fashion conglomerate with brands that embody outdoor happiness.
Over the decades, Oxford Industries has established itself with its wide range of premium lifestyle brands including Lilly Pulitzer, Southern Tide, The Beaufort Bonnet Company, Johnny Was, and Duck Head.
Tommy Bahama, Oxford Industries's largest brand, embodies the laid-back luxury lifestyle, offering men's and women's sportswear, swimwear, accessories, and home furnishings. Lilly Pulitzer sports a similar style as it's known for its vibrant, colorful designs and resort wear while Southern Tide brings Southern charm to classic American sportswear.
Oxford Industries grew its portfolio of brands through acquisitions, selectively buying companies with loyal customer bases. The company's distribution strategy leverages a mix of wholesale and direct-to-consumer channels, including branded retail stores, e-commerce platforms, and department store partnerships. This multi-channel approach allows Oxford to reach a wide audience, adapting to the shifting retail landscape and consumer buying habits.
Apparel, Accessories and Luxury Goods
Within apparel and accessories, not only do styles change more frequently today than decades past as fads travel through social media and the internet but consumers are also shifting the way they buy their goods, favoring omnichannel and e-commerce experiences. Some apparel, accessories, and luxury goods companies have made concerted efforts to adapt while those who are slower to move may fall behind.
Oxford Industries's primary competitors include PVH Corp (NYSE: PVH), Ralph Lauren (NYSE: RL), VF Corp (NYSE: VFC), Perry Ellis (NASDAQ: PERY), and Columbia Sportswear (NASDAQ: COLM).Sales Growth
Examining a company's long-term performance can provide clues about its business quality. Any business can put up a good quarter or two, but the best consistently grow over the long haul. Oxford Industries's annualized revenue growth rate of 7.2% over the last five years was weak for a consumer discretionary business.
Within consumer discretionary, a long-term historical view may miss a company riding a successful new product or emerging trend. That's why we also follow short-term performance. Oxford Industries's annualized revenue growth of 17.3% over the last two years is above its five-year trend, suggesting some bright spots.
This quarter, Oxford Industries's revenue grew 5.7% year on year to $404.4 million, missing Wall Street's estimates. The company is guiding for a 3.6% year-on-year revenue decline next quarter to $405 million, a reversal from the 19.1% year-on-year increase it recorded in the same quarter last year. Looking ahead, Wall Street expects sales to grow 1.7% over the next 12 months, a deceleration from this quarter.
Operating Margin
Operating margin is a key measure of profitability. Think of it as net income–the bottom line–excluding the impact of taxes and interest on debt, which are less connected to business fundamentals.
Oxford Industries has done a decent job managing its expenses over the last eight quarters. The company has produced an average operating margin of 10%, higher than the broader consumer discretionary sector.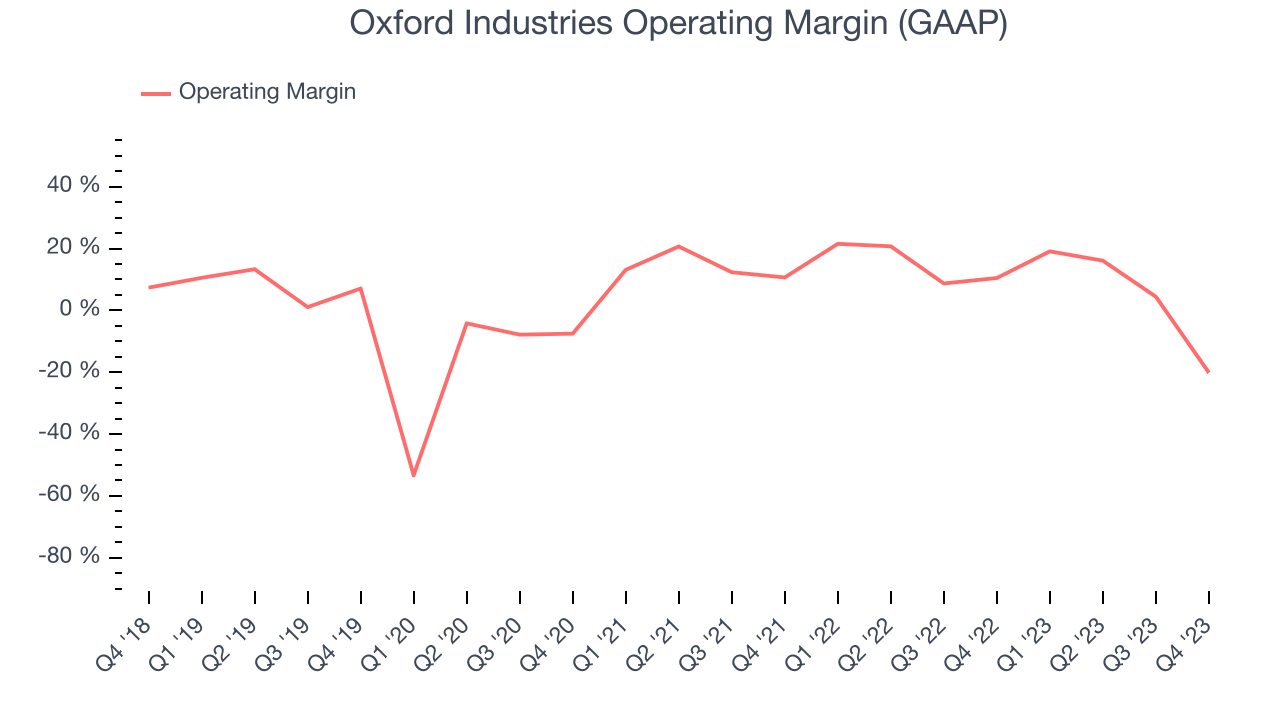
This quarter, Oxford Industries generated an operating profit margin of negative 20.1%, down 30.6 percentage points year on year.
Over the next 12 months, Wall Street expects Oxford Industries to become more profitable. Analysts are expecting the company’s LTM operating margin of 5.2% to rise to 12.9%.EPS
We track long-term historical earnings per share (EPS) growth for the same reason as long-term revenue growth. Compared to revenue, however, EPS highlights whether a company's growth was profitable. 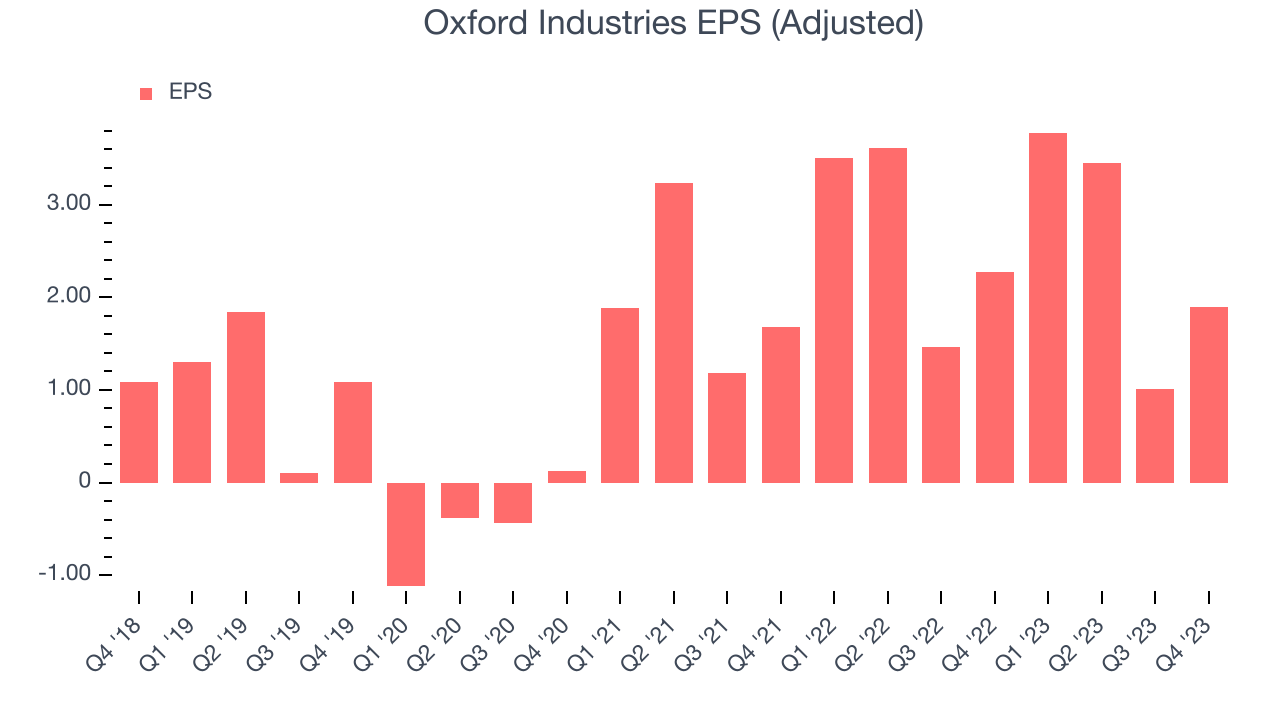
Over the last five years, Oxford Industries's EPS grew 134%, translating into a remarkable 18.6% compounded annual growth rate. This performance is materially higher than its 7.2% annualized revenue growth over the same period. There are a few reasons for this, and understanding why can shed light on its fundamentals. A five-year view shows that Oxford Industries has repurchased its stock, shrinking its share count by 7.7%. This has led to higher per share earnings. Taxes and interest expenses can also affect EPS growth, but they don't tell us as much about a company's fundamentals.
In Q4, Oxford Industries reported EPS at $1.90, down from $2.28 in the same quarter a year ago. This print unfortunately missed analysts' estimates, but we care more about long-term EPS growth rather than short-term movements. Over the next 12 months, Wall Street expects Oxford Industries's LTM EPS of $10.14 to stay about the same.
Cash Is King
Although earnings are undoubtedly valuable for assessing company performance, we believe cash is king because you can't use accounting profits to pay the bills.
Over the last two years, Oxford Industries has shown decent cash profitability, giving it some reinvestment opportunities. The company's free cash flow margin has averaged 10.4%, slightly better than the broader consumer discretionary sector.
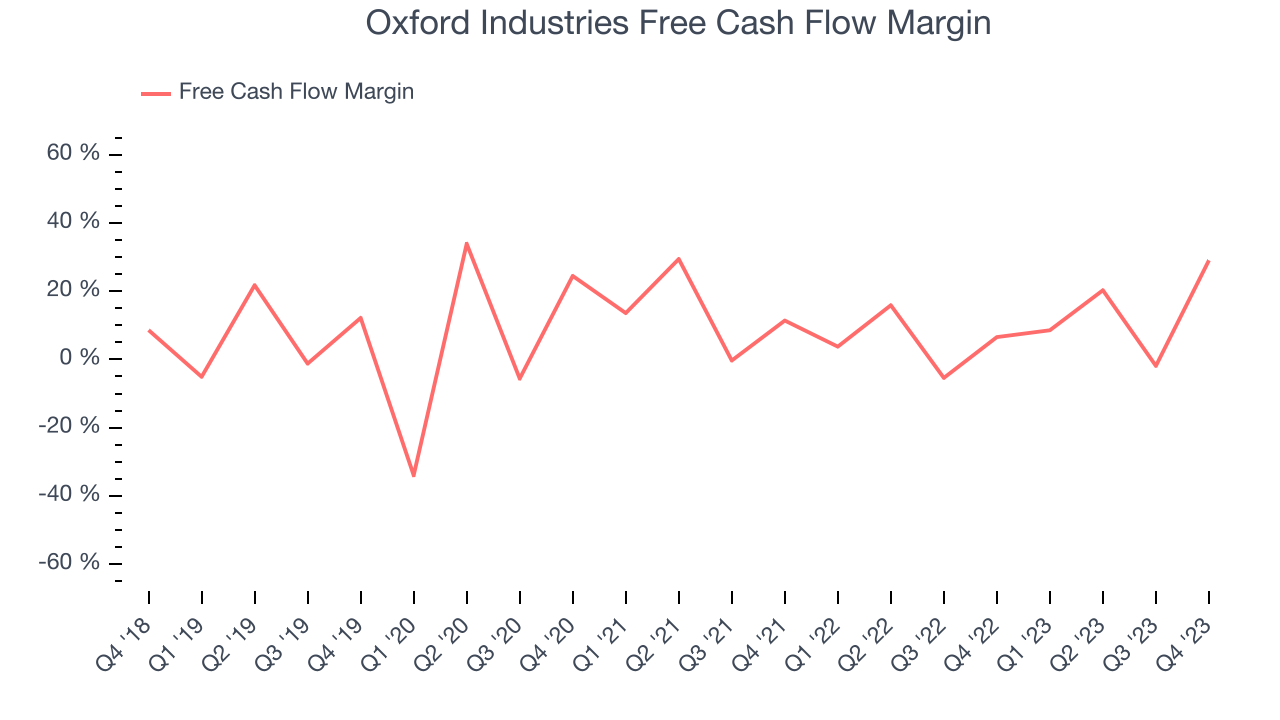
Oxford Industries's free cash flow came in at $117.4 million in Q4, equivalent to a 29% margin and up 369% year on year.
Return on Invested Capital (ROIC)
EPS and free cash flow tell us whether a company was profitable while growing revenue. But was it capital-efficient? A company’s ROIC explains this by showing how much operating profit a company makes compared to how much money the business raised (debt and equity).
Oxford Industries's five-year average return on invested capital was 13.4%, somewhat low compared to the best consumer discretionary companies that pump out 25%+. Its returns suggest it historically did a subpar job investing in profitable business initiatives.
The trend in its ROIC, however, is often what surprises the market and drives the stock price. Over the last five years, Oxford Industries's ROIC averaged meaningful increases each year, although COVID provided a low starting point for this analysis. This is still a good sign and we hope the company can continue to improving.
Key Takeaways from Oxford Industries's Q4 Results
Revenue and EPS missed this quarter. The company's earnings guidance for next quarter fell short of Wall Street's estimates. Overall, this was a weaker quarter for Oxford Industries. The company is down 6.6% on the results and currently trades at $105 per share.
Is Now The Time?
Oxford Industries may have had a tough quarter, but investors should also consider its valuation and business qualities when assessing the investment opportunity.
We cheer for all companies serving consumers, but in the case of Oxford Industries, we'll be cheering from the sidelines. Its revenue growth has been a little slower over the last five years, and analysts expect growth to deteriorate from here. And while its EPS growth over the last five years has significantly beat its peer group average, the downside is its same-store sales performance has been disappointing. On top of that, its projected EPS for the next year is lacking.
Oxford Industries's price-to-earnings ratio based on the next 12 months is 11.1x. While the price is reasonable and there are some things to like about Oxford Industries, we think there are better opportunities elsewhere in the market right now.
Wall Street analysts covering the company had a one-year price target of $103.20 per share right before these results (compared to the current share price of $105).
To get the best start with StockStory, check out our most recent stock picks, and then sign up for our earnings alerts by adding companies to your watchlist here. We typically have the quarterly earnings results analyzed within seconds of the data being released, and especially for companies reporting pre-market, this often gives investors the chance to react to the results before the market has fully absorbed the information.