
Consumer products behemoth Proctor & Gamble (NYSE:PG) fell short of analysts' expectations in Q1 CY2024, with revenue flat year on year at $20.2 billion. It made a non-GAAP profit of $1.52 per share, improving from its profit of $1.37 per share in the same quarter last year.
Procter & Gamble (PG) Q1 CY2024 Highlights:
- Revenue: $20.2 billion vs analyst estimates of $20.44 billion (1.2% miss)
- EPS (non-GAAP): $1.52 vs analyst estimates of $1.41 (7.5% beat)
- Raised full year 2024 EPS (non-GAAP) from up -8-9% year on year previously to up 10-11% year on year currently (implies $6.52 vs. estimates of $6.41)
- Gross Margin (GAAP): 51.2%, up from 48.2% in the same quarter last year
- Free Cash Flow of $3.29 billion, down 23.2% from the previous quarter
- Organic Revenue was up 3% year on year (miss vs. expectations of up 3.6% year on year)
- Market Capitalization: $370.1 billion
Founded by candle maker William Procter and soap maker James Gamble, Proctor & Gamble (NYSE:PG) is a consumer products behemoth whose product portfolio spans everything from facial tissues to laundry detergent to feminine care to men’s grooming.
You’ve probably heard of Bounty paper towels, Pampers diapers, Tide laundry detergent, Gillette razors, and Crest toothpaste–these are some of the company’s powerhouse brands. These brands are both household mainstays as well as innovators that help steer the direction of these categories. For example, Tide introduced the first synthetic laundry detergent (made from petrochemicals) in the 1940s, moving the industry away from traditional soaps (lye and fats). Additionally, Gillette was a pioneer in multi-blade technology that resulted in a closer shave with less irritation.
Given its vast portfolio, Gillette’s core customer is nearly everyone who shops for the personal care or hygiene needs of themselves or their family members. These customers seek a brand that’s familiar and trusted, first and foremost. Additionally, these customers want cost-effective products, although many are willing to pay a reasonable premium to buy established brands rather than lesser-known or private-label brands.
It’s probably harder to avoid Gillette products rather than to find them. They drive traffic and are prominently featured on the shelves of grocery stores, mass merchandise retailers, drug stores, and specialty retailers.
Household Products
Household products stocks are generally stable investments, as many of the industry's products are essential for a comfortable and functional living space. Recently, there's been a growing emphasis on eco-friendly and sustainable offerings, reflecting the evolving consumer preferences for environmentally conscious options. These trends can be double-edged swords that benefit companies who innovate quickly to take advantage of them and hurt companies that don't invest enough to meet consumers where they want to be with regards to trends.
Competitors that offer a wide range of household and personal care products include Kimberly-Clark (NYSE:KMB), Unilever (LSE:ULVR), Colgate-Palmolive (NYSE:CL), and Church & Dwight (NYSE:CHD).Sales Growth
Procter & Gamble is one of the most widely recognized consumer staples companies in the world. Its influence over consumers gives it extremely high negotiating leverage with distributors, enabling it to pick and choose where it sells its products (a luxury many don't have).
As you can see below, the company's annualized revenue growth rate of 3.9% over the last three years was weak as consumers bought less of its products. We'll explore what this means in the "Volume Growth" section.
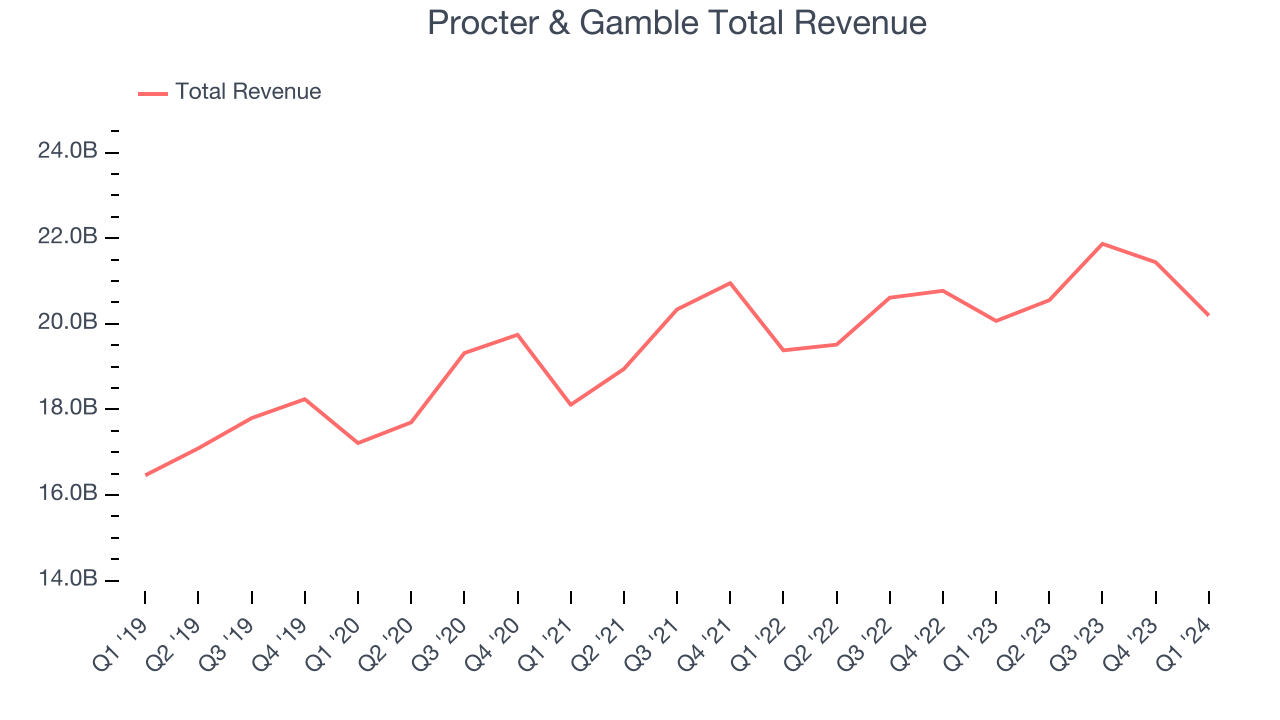
This quarter, Procter & Gamble's revenue grew 0.6% year on year to $20.2 billion, falling short of Wall Street's estimates. Looking ahead, Wall Street expects sales to grow 3.2% over the next 12 months, an acceleration from this quarter.
Volume Growth
Revenue growth can be broken down into changes in price and volume (the number of units sold). While both are important, volume is the lifeblood of a successful staples business as there’s a ceiling to what consumers will pay for everyday goods; they can always trade down to non-branded products if the branded versions are too expensive.
To analyze whether Procter & Gamble generated its growth from changes in price or volume, we can compare its volume growth to its organic revenue growth, which excludes non-fundamental impacts on company financials like mergers and currency fluctuations.
Over the last two years, Procter & Gamble's average quarterly sales volumes have shrunk by 2%. This decrease isn't ideal as the quantity demanded for consumer staples products is typically stable. Luckily, Procter & Gamble was able to offset fewer customers purchasing its products by charging higher prices, enabling it to generate 6.1% average organic revenue growth. We hope the company can grow its volumes soon, however, as consistent price increases (on top of inflation) aren't sustainable over the long term unless the business is really really special.
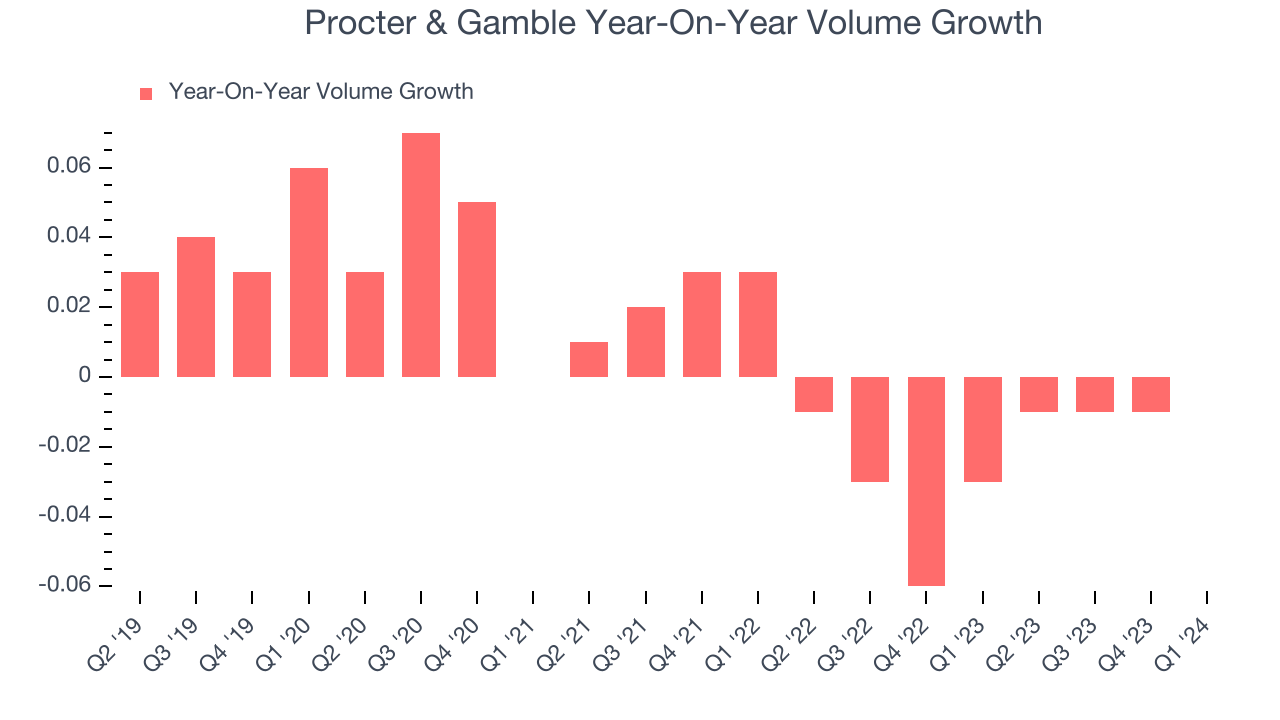
In Procter & Gamble's Q1 2024, year on year sales volumes were flat. This result was a well-appreciated turnaround from the 3% year-on-year decline it posted 12 months ago, showing the company is heading in the right direction.
Gross Margin & Pricing Power
This quarter, Procter & Gamble's gross profit margin was 51.2%, up 3 percentage points year on year. That means for every $1 in revenue, $0.49 went towards paying for raw materials, production of goods, and distribution expenses.
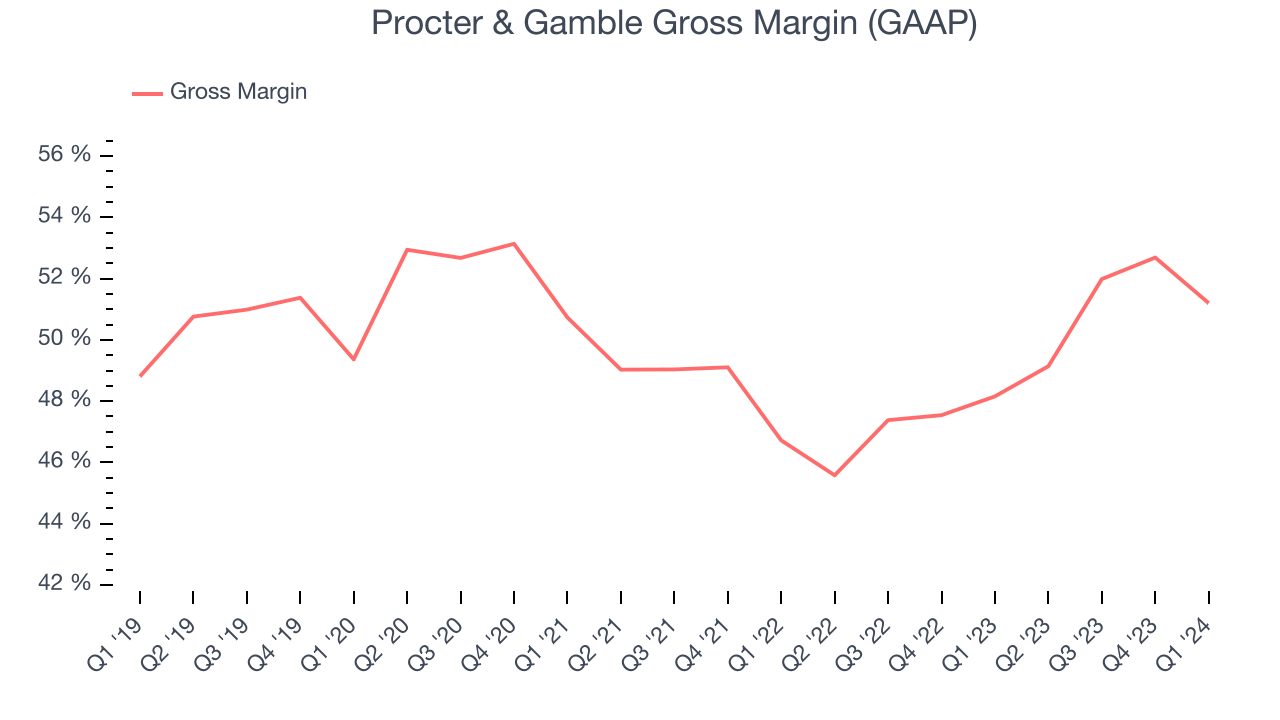
Procter & Gamble has great unit economics for a consumer staples company, giving it ample room to invest in areas such as marketing and talent to grow its brand. As you can see above, it's averaged an impressive 49.3% gross margin over the last eight quarters. Its margin has also been trending up over the last 12 months, averaging 8.7% year-on-year increases each quarter. If this trend continues, it could suggest a less competitive environment where the company has better pricing power and more favorable input costs (such as raw materials).
Operating Margin
Operating margin is a key profitability metric for companies because it accounts for all expenses enabling a business to operate smoothly, including marketing and advertising, IT systems, wages, and other administrative costs.
This quarter, Procter & Gamble generated an operating profit margin of 22.1%, in line with the same quarter last year. This indicates the company's costs have been relatively stable.
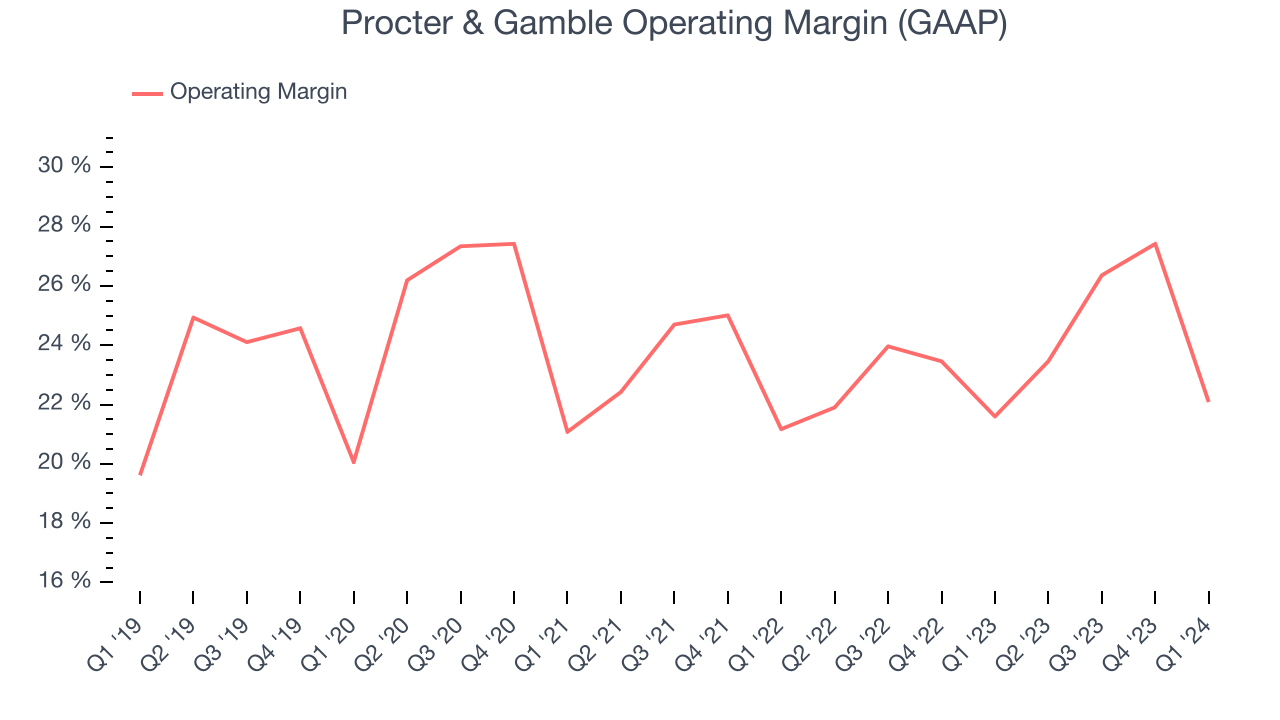 Zooming out, Procter & Gamble has been a well-oiled machine over the last two years. It's demonstrated elite profitability for a consumer staples business, boasting an average operating margin of 23.8%. On top of that, its margin has risen by 2.1 percentage points on average over the last year, showing the company is improving its fundamentals.
 EPS
These days, some companies issue new shares like there's no tomorrow. That's why we like to track earnings per share (EPS) because it accounts for shareholder dilution and share buybacks.
In Q1, Procter & Gamble reported EPS at $1.52, up from $1.37 in the same quarter a year ago. This print beat Wall Street's estimates by 7.5%.
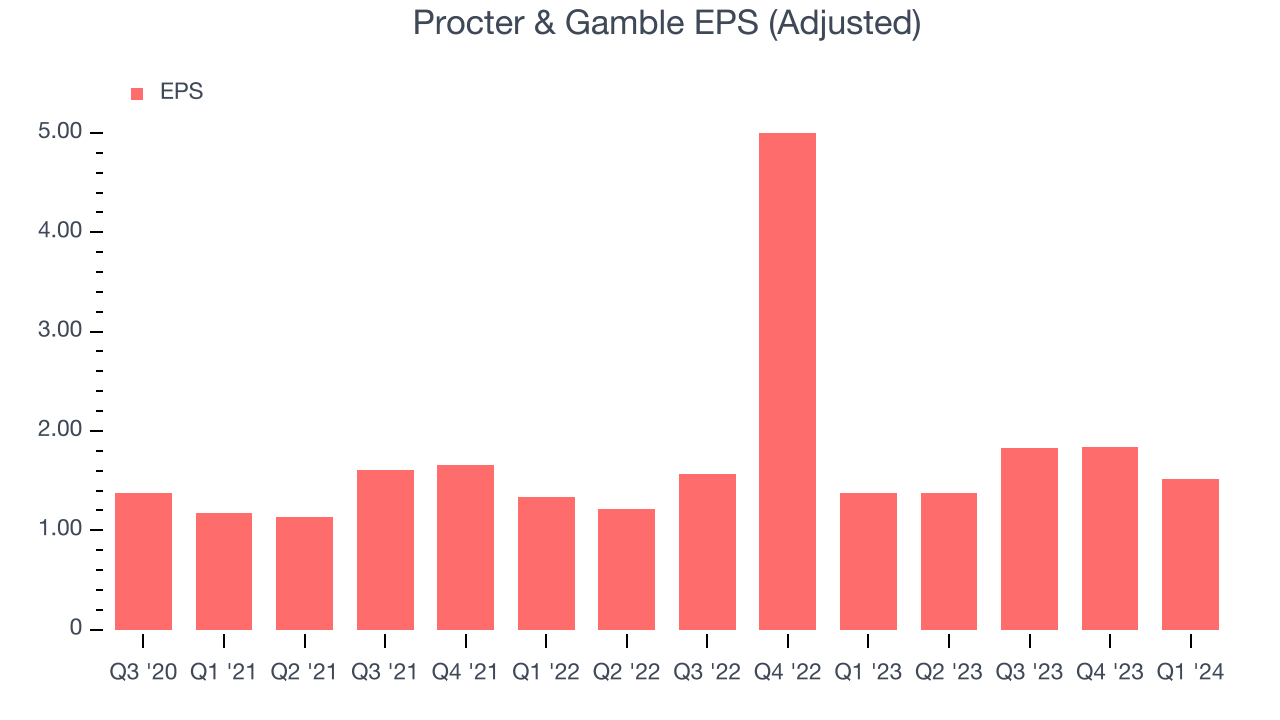
Between FY2021 and FY2024, Procter & Gamble cut its earnings losses. Its EPS has improved by 7% on average each year.
Wall Street expects the company to continue growing earnings over the next 12 months, with analysts projecting an average 3.9% year-on-year increase in EPS.
Cash Is King
Although earnings are undoubtedly valuable for assessing company performance, we believe cash is king because you can't use accounting profits to pay the bills.
Procter & Gamble's free cash flow came in at $3.29 billion in Q1, up 5% year on year. This result represents a 16.3% margin.
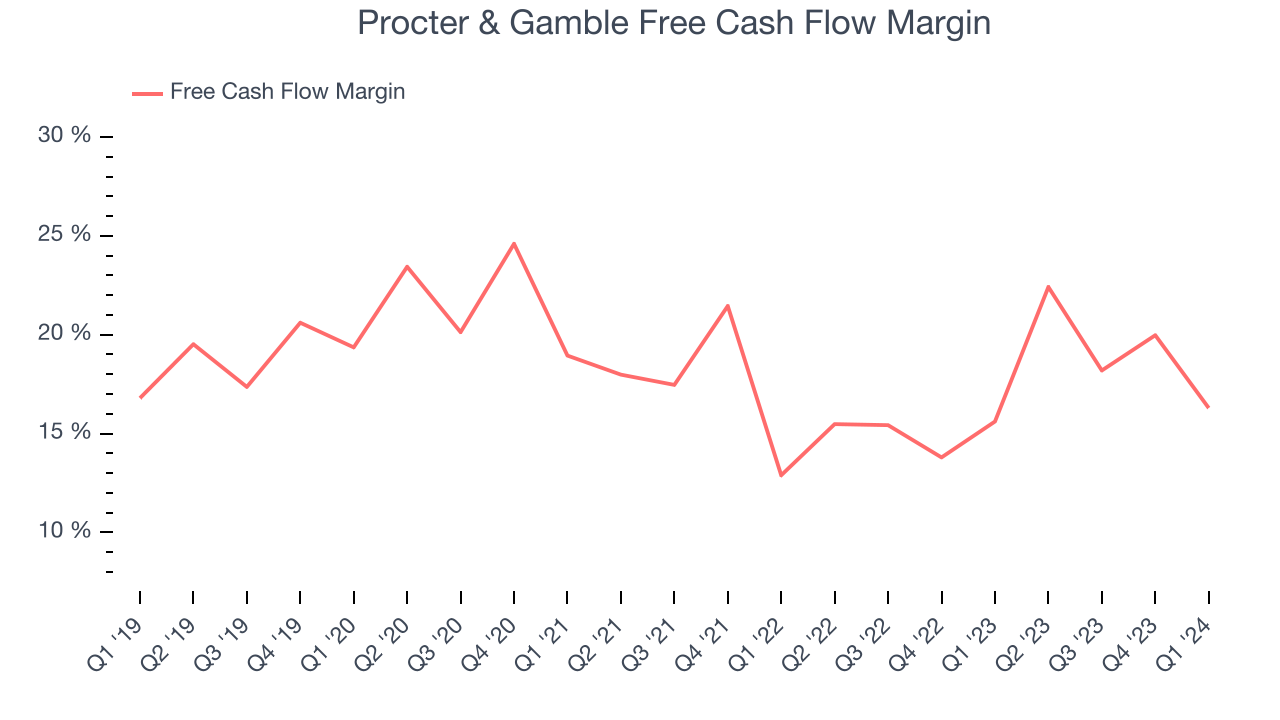
Over the last eight quarters, Procter & Gamble has shown terrific cash profitability, enabling it to reinvest, return capital to investors, and stay ahead of the competition while maintaining a robust cash balance. The company's free cash flow margin has been among the best in the consumer staples sector, averaging 17.2%. Furthermore, its margin has averaged year-on-year increases of 4.2 percentage points over the last 12 months. This likely pleases the company's investors.
Return on Invested Capital (ROIC)
EPS and free cash flow tell us whether a company was profitable while growing revenue. But was it capital-efficient? A company’s ROIC explains this by showing how much operating profit a company makes compared to how much money the business raised (debt and equity).
Procter & Gamble's five-year average ROIC was 22.8%, beating other consumer staples companies by a wide margin. Just as you’d like your investment dollars to generate returns, Procter & Gamble's invested capital has produced robust profits.
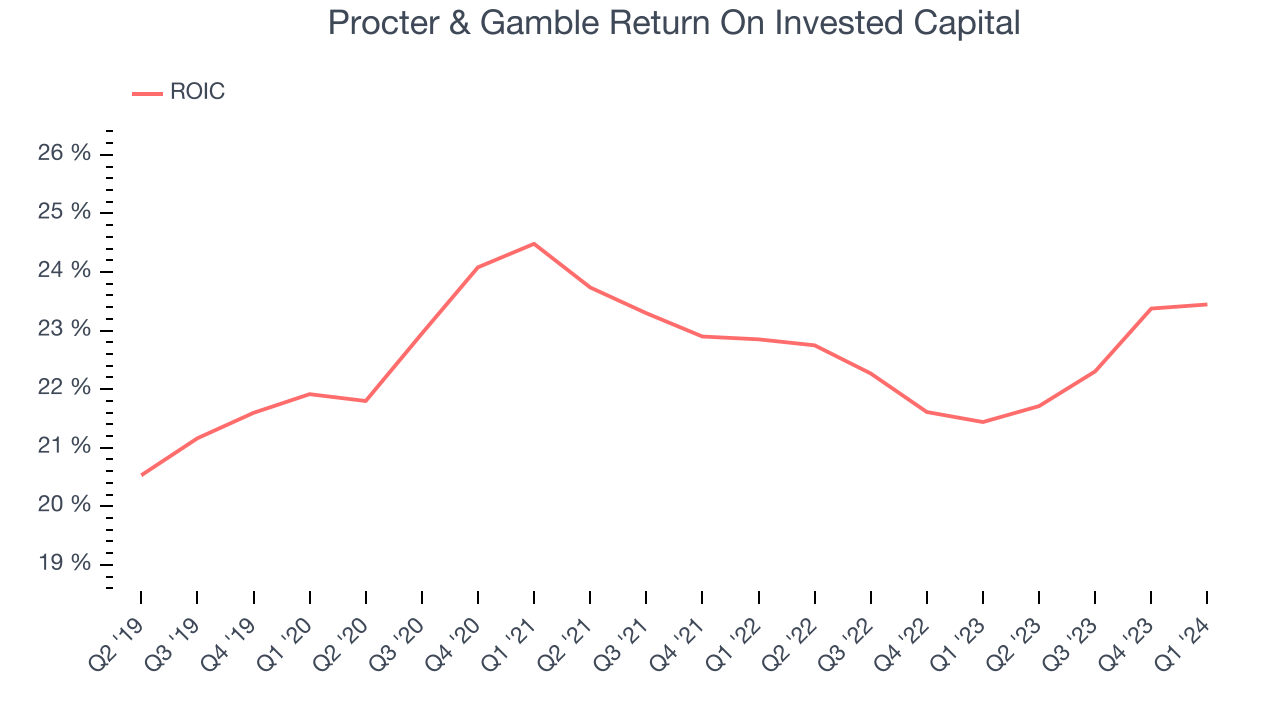
The trend in its ROIC, however, is often what surprises the market and drives the stock price. Uneventfully, Procter & Gamble's ROIC has stayed the same over the last few years. A rising ROIC would be ideal, but this is still a noteworthy feat when considering its returns are already high.
Balance Sheet Risk
Debt is a tool that can boost company returns but presents risks if used irresponsibly.
Procter & Gamble reported $6.83 billion of cash and $31.98 billion of debt on its balance sheet in the most recent quarter. As investors in high-quality companies, we primarily focus on two things: 1) that a company's debt level isn't too high and 2) that its interest payments are not excessively burdening the business.
With $23.51 billion of EBITDA over the last 12 months, we view Procter & Gamble's 1.1x net-debt-to-EBITDA ratio as safe. We also see its $207 million of annual interest expenses as appropriate. The company's profits give it plenty of breathing room, allowing it to continue investing in new initiatives.
Key Takeaways from Procter & Gamble's Q1 Results
Revenue unfortunately missed analysts' expectations on organic revenue that came in below Wall Street Consensus estimates. On the other hand, the company did beat EPS slightly and raised its full year EPS guidance to a level above expectations. Zooming out, we think this was still a decent, albeit mixed, quarter, showing that the company is staying on track. The stock is flat after reporting and currently trades at $157.2 per share.
Is Now The Time?
Procter & Gamble may have had a favorable quarter, but investors should also consider its valuation and business qualities when assessing the investment opportunity.
We think Procter & Gamble is a good business. Although its revenue growth has been a little slower over the last three years, its powerful free cash flow generation enables it to stay ahead of the competition through consistent reinvestment of profits. And while its shrinking sales volumes suggest it'll need to change its strategy to succeed, its scale gives it immense negotiating leverage with retailers.
Procter & Gamble's price-to-earnings ratio based on the next 12 months is 23.1x. There are definitely a lot of things to like about Procter & Gamble, and looking at the consumer staples landscape right now, it seems to be trading at a reasonable price.
Wall Street analysts covering the company had a one-year price target of $169.59 per share right before these results (compared to the current share price of $157.20), implying they saw upside in buying Procter & Gamble in the short term.
To get the best start with StockStory, check out our most recent stock picks, and then sign up to our earnings alerts by adding companies to your watchlist here. We typically have the quarterly earnings results analyzed within seconds of the data being released, and especially for companies reporting pre-market, this often gives investors the chance to react to the results before the market has fully absorbed the information.