
Packaged foods company Post (NYSE:POST) fell short of analysts' expectations in Q1 CY2024, with revenue up 23.4% year on year to $2.00 billion. It made a non-GAAP profit of $1.51 per share, improving from its profit of $1.10 per share in the same quarter last year.
Post (POST) Q1 CY2024 Highlights:
- Revenue: $2.00 billion vs analyst estimates of $2.03 billion (1.5% miss)
- EPS (non-GAAP): $1.51 vs analyst estimates of $1.29 (17.2% beat)
- Gross Margin (GAAP): 29%, up from 25.5% in the same quarter last year
- Sales Volumes were down 5.1% year on year
- Market Capitalization: $6.36 billion
Founded in 1895, Post (NYSE:POST) is a packaged food company known for its namesake breakfast cereal and healthier-for-you snacks.
Within the Post cereal umbrella, brands such as Honey Bunches of Oats, Grape-Nuts, Pebbles, and Shredded Wheat have made the company a mainstay in the cereal category. Weetabix, Bob Evans Farms, and Peter Pan Peanut Butter are other popular brands in the Post portfolio, and the company has even expanded into quality pet food.
Post’s core customer is an individual or family seeking convenient and nutritious packaged food. The company therefore shapes its branding and messaging to speak to those who are health-conscious or who lead active lifestyles that prioritize nutrition. On Post’s website, the brand portfolio is introduced with “Tasty and delicious. Wholesome and nutritious. We’ve got food brands the whole family will love.”
Post’s brands and products can be found in a wide range of stores and retailers, with major grocery stores and supermarkets being the main channels. Additionally, convenience stores, health food stores, and online food retailers also carry Post products. Wide distribution and prominent shelf placement over time have cemented Post as a bellwether staples company and leader in breakfast cereals.
Shelf-Stable Food
As America industrialized and moved away from an agricultural economy, people faced more demands on their time. Packaged foods emerged as a solution offering convenience to the evolving American family, whether it be canned goods or snacks. Today, Americans seek brands that are high in quality, reliable, and reasonably priced. Furthermore, there's a growing emphasis on health-conscious and sustainable food options. Packaged food stocks are considered resilient investments. People always need to eat, so these companies can enjoy consistent demand as long as they stay on top of changing consumer preferences. The industry spans from multinational corporations to smaller specialized firms and is subject to food safety and labeling regulations.
Competitors in the packaged food space and specifically in breakfast cereals include General Mills (NYSE:GIS), Kellogg (NYSE:K), and Kraft Heinz (NASDAQ:KHC).Sales Growth
Post is one of the larger consumer staples companies and benefits from a well-known brand, giving it customer mindshare and influence over purchasing decisions.
As you can see below, the company's annualized revenue growth rate of 12.8% over the last three years was solid for a consumer staples business.
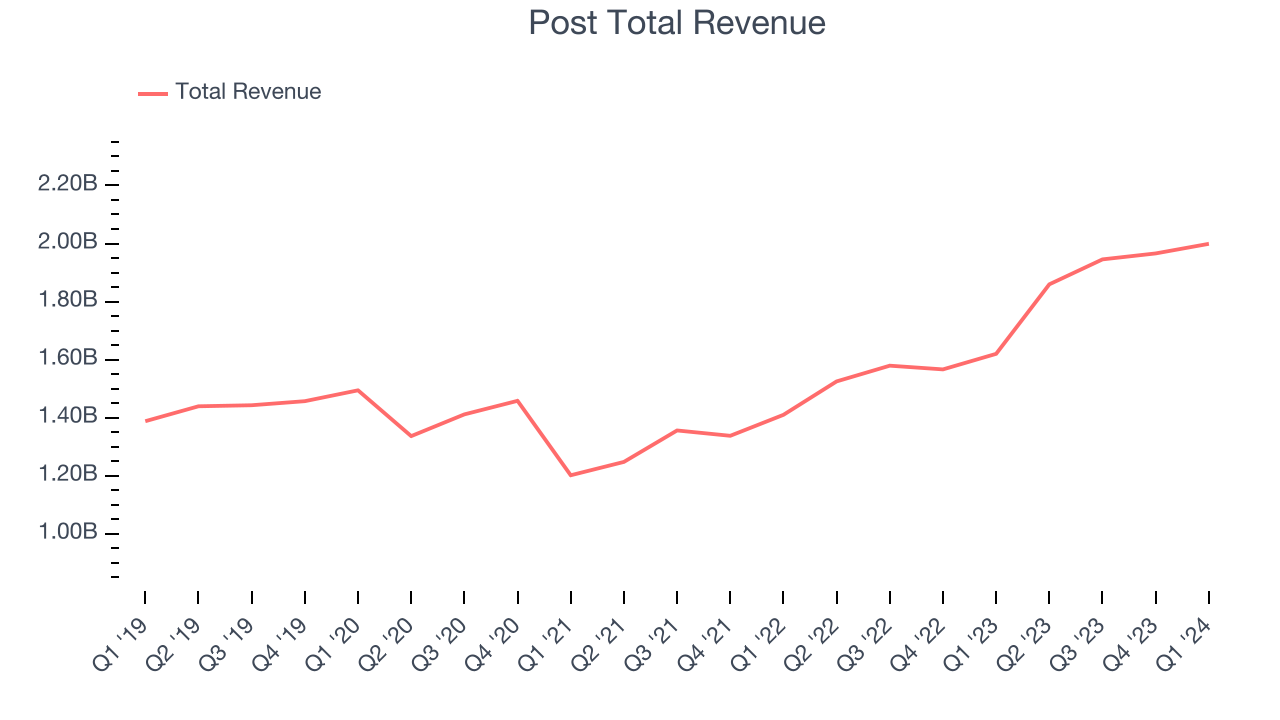
This quarter, Post generated an excellent 23.4% year-on-year revenue growth rate, but its $2.00 billion in revenue fell short of Wall Street's high expectations. Looking ahead, Wall Street expects sales to grow 6% over the next 12 months, a deceleration from this quarter.
Volume Growth
Revenue growth can be broken down into changes in price and volume (the number of units sold). While both are important, volume is the lifeblood of a successful staples business as there’s a ceiling to what consumers will pay for everyday goods; they can always trade down to non-branded products if the branded versions are too expensive.
Post's average quarterly sales volumes have shrunk by 7.7% over the last two years. This decrease isn't ideal because the quantity demanded for consumer staples products is typically stable.
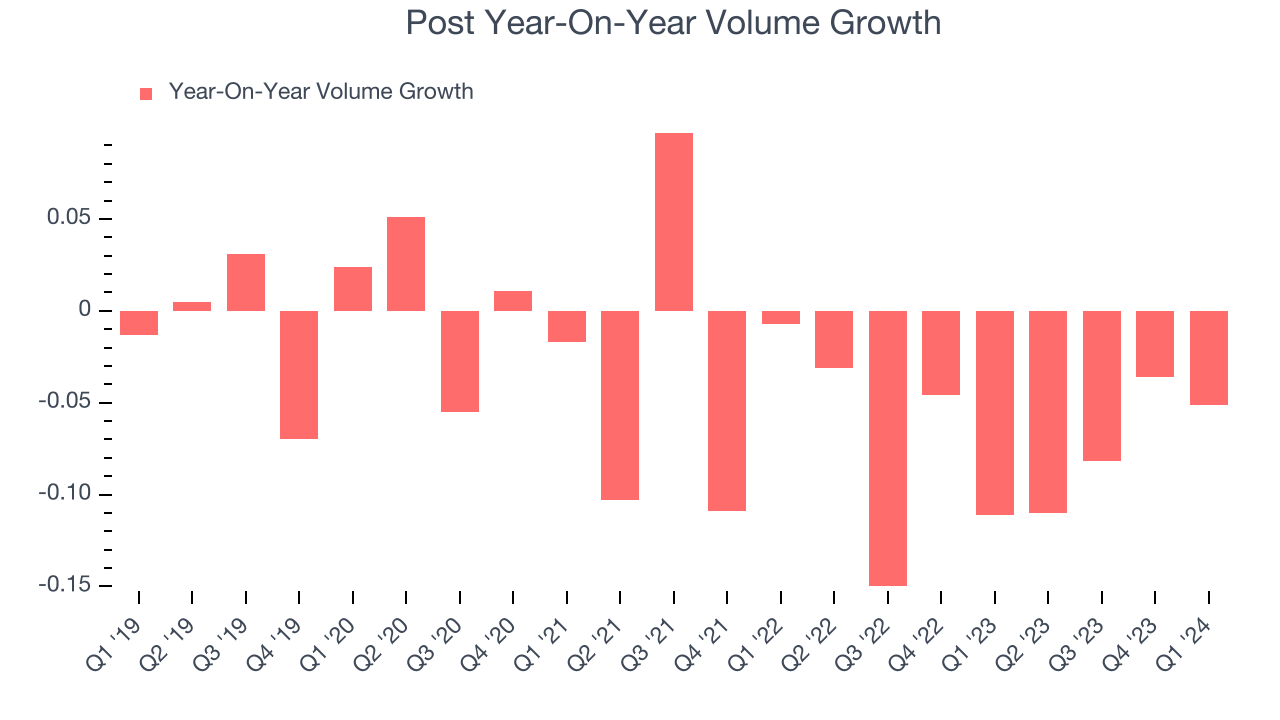
In Post's Q1 2024, sales volumes dropped 5.1% year on year. This result was a step in the right direction compared to its 11.1% year-on-year decline 12 months ago.
Gross Margin & Pricing Power
All else equal, we prefer higher gross margins. They usually indicate that a company sells more differentiated products and commands stronger pricing power.
Post's gross profit margin came in at 29% this quarter, up 3.4 percentage points year on year. That means for every $1 in revenue, a chunky $0.71 went towards paying for raw materials, production of goods, and distribution expenses.
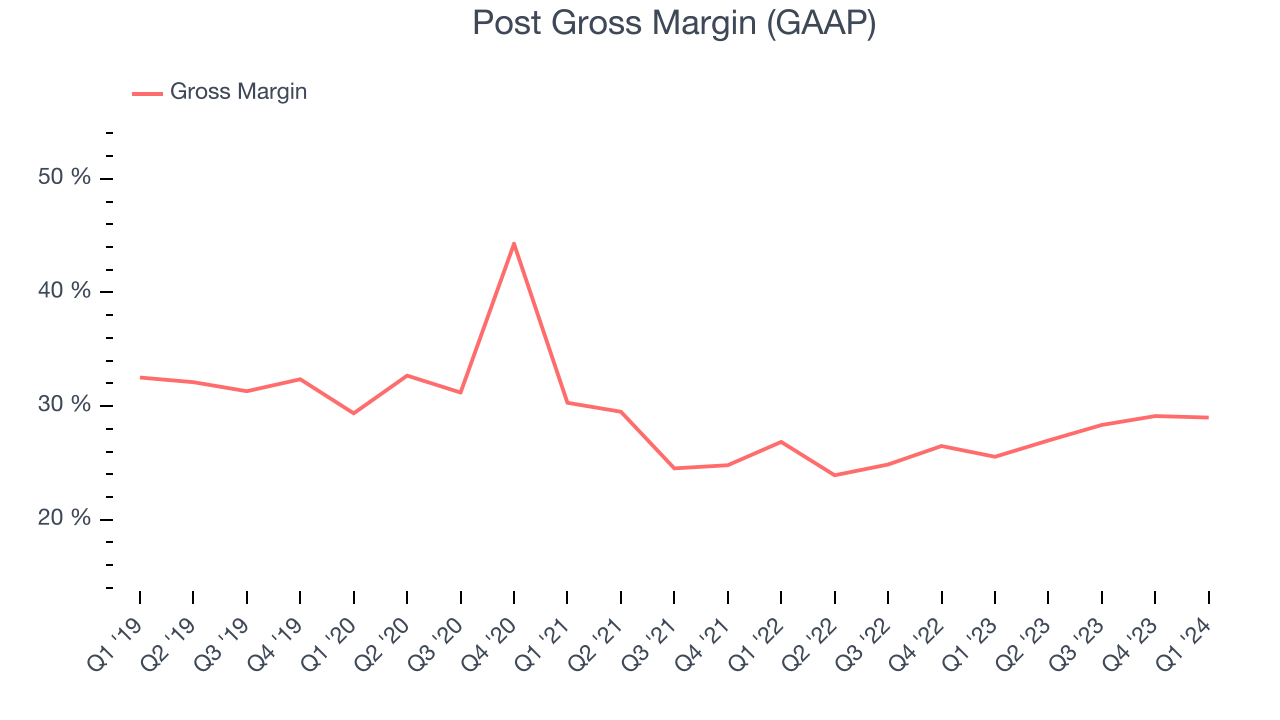
Post has subpar unit economics for a consumer staples company, making it difficult to invest in areas such as marketing and talent to grow its brand. As you can see above, it's averaged a 27% gross margin over the last two years. Its margin, however, has been trending up over the last 12 months, averaging 12.6% year-on-year increases each quarter. If this trend continues, it could suggest a less competitive environment.
Operating Margin
Operating margin is an important measure of profitability accounting for key expenses such as marketing and advertising, IT systems, wages, and other administrative costs.
In Q1, Post generated an operating profit margin of 9.5%, in line with the same quarter last year. This indicates the company's costs have been relatively stable.
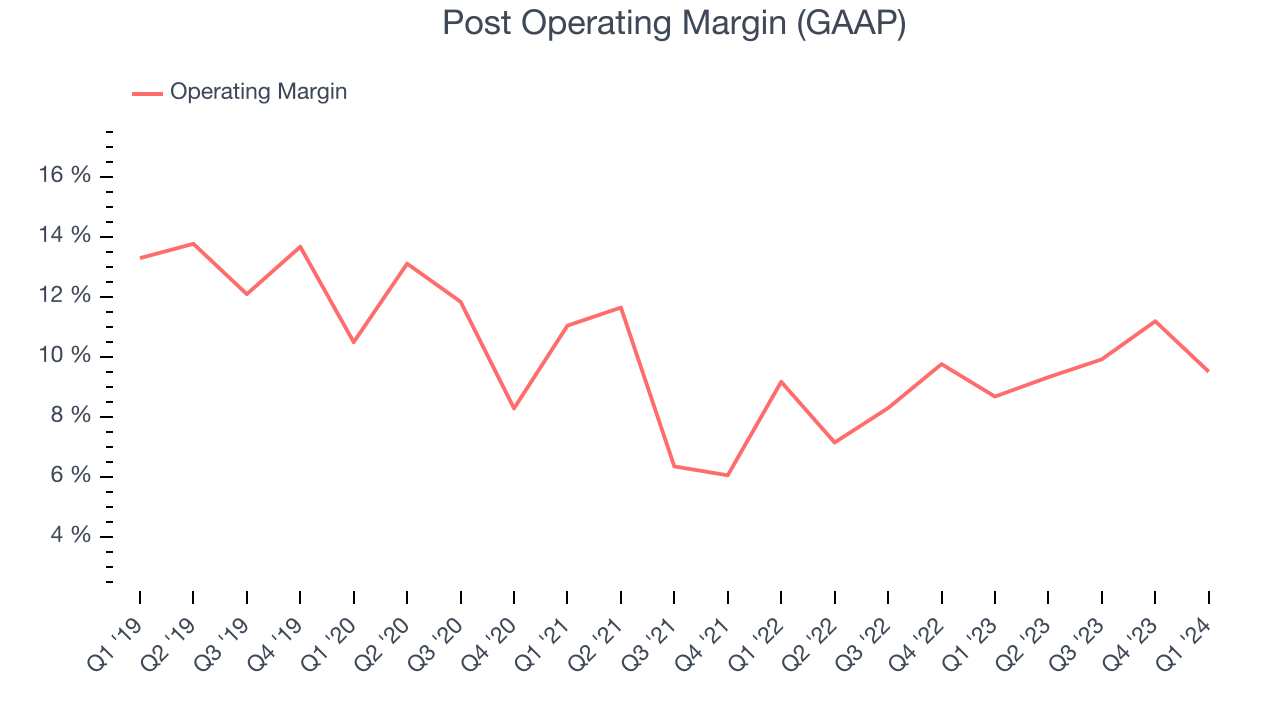 Zooming out, Post has done a decent job managing its expenses over the last eight quarters. The company has produced an average operating margin of 9.3%, higher than the broader consumer staples sector. On top of that, its margin has risen by 1.5 percentage points on average over the last year, showing the company is improving its fundamentals. The company's operating profitability was particularly impressive because of its low gross margin, which is mostly a factor of what it sells and takes tectonic shifts to move meaningfully. Companies have more control over their operating margins, and it signals strength if they're high when gross margins are low (like for Post).
EPS
Earnings growth is a critical metric to track, but for long-term shareholders, earnings per share (EPS) is more telling because it accounts for dilution and share repurchases.
In Q1, Post reported EPS at $1.51, up from $1.10 in the same quarter a year ago. This print beat Wall Street's estimates by 17.2%.
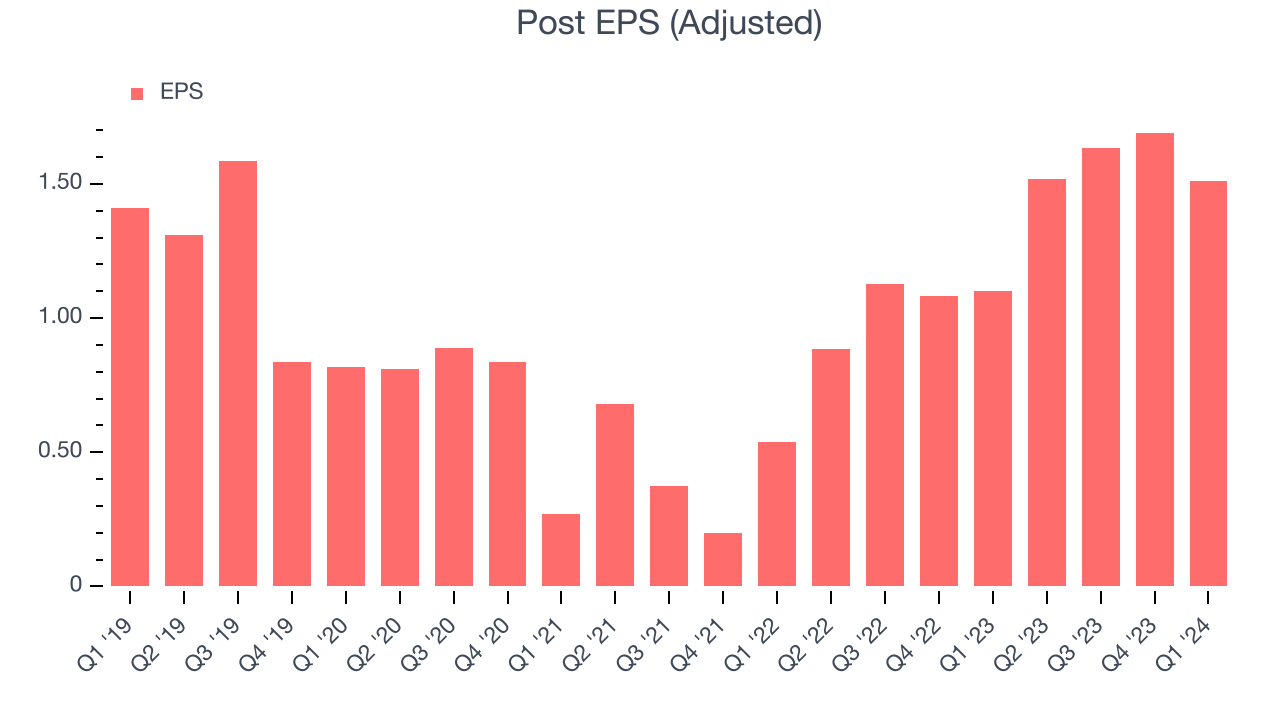
Between FY2021 and FY2024, Post's EPS grew 126%, translating into an astounding 31.3% compounded annual growth rate. This growth is materially higher than its revenue growth over the same period, showing that Post has excelled in managing its expenses.
Over the next 12 months, however, Wall Street is projecting an average 8.2% year-on-year decline in EPS.
Return on Invested Capital (ROIC)
EPS and free cash flow tell us whether a company was profitable while growing revenue. But was it capital-efficient? A company’s ROIC explains this by showing how much operating profit a company makes compared to how much money the business raised (debt and equity).
Post's five-year average ROIC was 6%, somewhat low compared to the best consumer staples companies that consistently pump out 20%+. Its returns suggest it historically did a subpar job investing in profitable business initiatives.
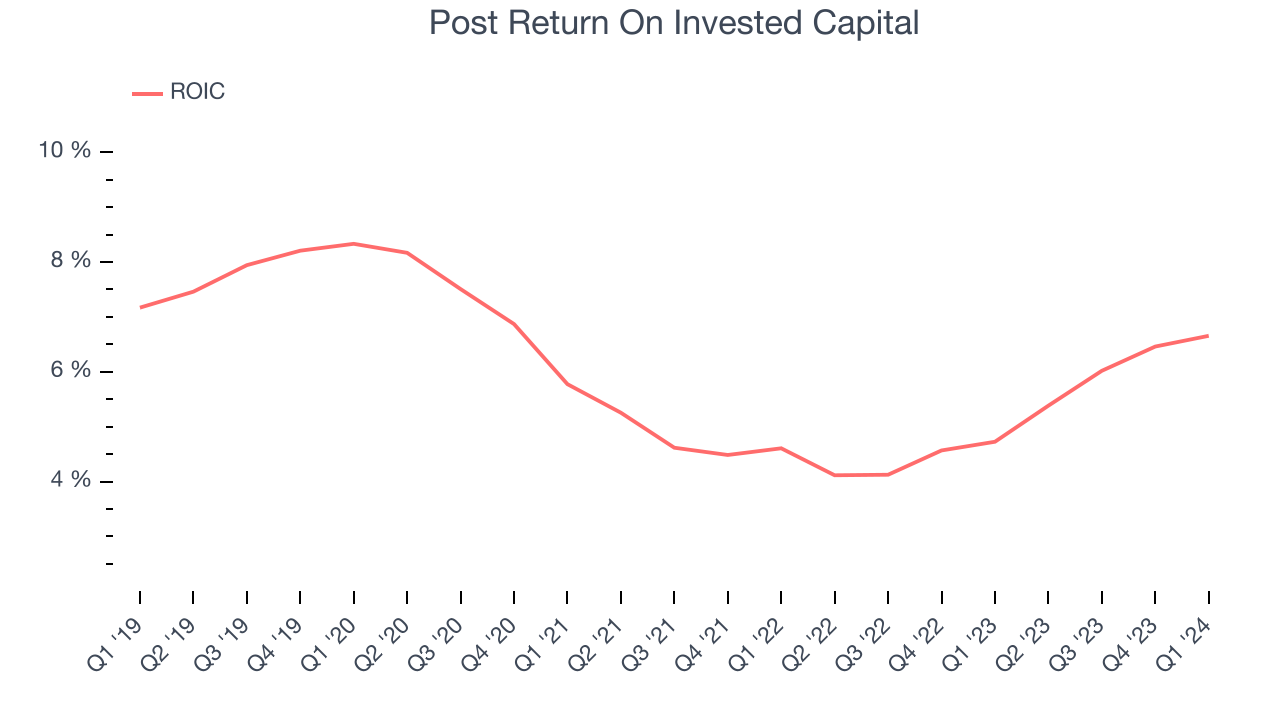
The trend in its ROIC, however, is often what surprises the market and drives the stock price. Unfortunately, Post's ROIC averaged 1.4 percentage point decreases over the last few years. Paired with its already low returns, these declines suggest the company's profitable business opportunities are few and far between.
Balance Sheet Risk
As long-term investors, the risk we care most about is the permanent loss of capital. This can happen when a company goes bankrupt or raises money from a disadvantaged position and is separate from short-term stock price volatility, which we are much less bothered by.
Post reported $333.4 million of cash and $6.42 billion of debt on its balance sheet in the most recent quarter. As investors in high-quality companies, we primarily focus on two things: 1) that a company's debt level isn't too high and 2) that its interest payments are not excessively burdening the business.
With $1.39 billion of EBITDA over the last 12 months, we view Post's 4.4x net-debt-to-EBITDA ratio as safe. We also see its $132 million of annual interest expenses as appropriate. The company's profits give it plenty of breathing room, allowing it to continue investing in new initiatives.
Key Takeaways from Post's Q1 Results
We were impressed by how significantly Post blew past analysts' gross margin and EPS expectations this quarter. On the other hand, its revenue unfortunately missed Wall Street's projections as its sales volumes declined 5.1%, driven by 16.6% and 10.7% volume declines in its egg and cheese products, respectively. Despite the weaker sales, this quarter's results seemed fairly positive thanks to the better-than-anticipated profitability. The stock is flat after reporting and currently trades at $104.9 per share.
Is Now The Time?
Post may have had a favorable quarter, but investors should also consider its valuation and business qualities when assessing the investment opportunity.
We cheer for all companies serving consumers, but in the case of Post, we'll be cheering from the sidelines. Although its revenue growth has been good over the last three years, its shrinking sales volumes suggest it'll need to change its strategy to succeed. And while its EPS growth over the last three years has been fantastic, the downside is its projected EPS for the next year is lacking.
Post's price-to-earnings ratio based on the next 12 months is 18.0x. While there are some things to like about Post and its valuation is reasonable, we think there are better opportunities elsewhere in the market right now.
Wall Street analysts covering the company had a one-year price target of $115.40 per share right before these results (compared to the current share price of $104.90).
To get the best start with StockStory, check out our most recent stock picks, and then sign up to our earnings alerts by adding companies to your watchlist here. We typically have the quarterly earnings results analyzed within seconds of the data being released, and especially for companies reporting pre-market, this often gives investors the chance to react to the results before the market has fully absorbed the information.