
Real estate franchise company RE/MAX (NYSE:RMAX) reported Q1 CY2024 results exceeding Wall Street analysts' expectations, with revenue down 8.3% year on year to $78.29 million. On the other hand, next quarter's revenue guidance of $77.5 million was less impressive, coming in 1.6% below analysts' estimates. It made a non-GAAP profit of $0.20 per share, down from its profit of $0.26 per share in the same quarter last year.
RE/MAX (RMAX) Q1 CY2024 Highlights:
- Revenue: $78.29 million vs analyst estimates of $77.26 million (1.3% beat)
- EPS (non-GAAP): $0.20 vs analyst expectations of $0.19 (in line)
- Revenue Guidance for Q2 CY2024 is $77.5 million at the midpoint, below analyst estimates of $78.76 million
- The company reconfirmed its revenue guidance for the full year of $310 million at the midpoint (also reconfirmed adjusted EBITDA guidance)
- Gross Margin (GAAP): 74.2%, down from 75% in the same quarter last year
- Free Cash Flow of $6.76 million, similar to the previous quarter
- Agents: 143,287
- Market Capitalization: $135.7 million
Short for Real Estate Maximums, RE/MAX (NYSE:RMAX) operates a real estate franchise network spanning over 100 countries and territories.
RE/MAX’s business model centers around its franchise system with independent agents who work under the RE/MAX brand. This model has allowed for rapid global expansion of RE/MAX and its offerings, which include residential and commercial real estate services (buying, selling, and leasing properties).
A strength of RE/MAX is its brand recognition and reputation for having experienced, productive agents. RE/MAX agents have access to continuous training, analytical resources, and a vast network of global listings, which enhances their ability to serve buyers and sellers effectively.
To maintain its relevance, RE/MAX invests in digital tools and platforms to streamline the real estate transaction process and improve the customer experience. These include proprietary software for lead management, transaction management, and marketing, as well as a global listing website.
Real Estate Services
Technology has been a double-edged sword in real estate services. On the one hand, internet listings are effective at disseminating information far and wide, casting a wide net for buyers and sellers to increase the chances of transactions. On the other hand, digitization in the real estate market could potentially disintermediate key players like agents who use information asymmetries to their advantage.
RE/MAX’s primary competitors are Realogy Holdings (NYSE:RLGY), Zillow (NASDAQ:ZG), Redfin (NASDAQ:RDFN), eXp World (NASDAQ:EXPI), and private companies Keller Williams Realty and Century 21 Real Estate.Sales Growth
A company’s long-term performance can give signals about its business quality. Any business can put up a good quarter or two, but many enduring ones muster years of growth. RE/MAX's annualized revenue growth rate of 6.6% over the last five years was weak for a consumer discretionary business. 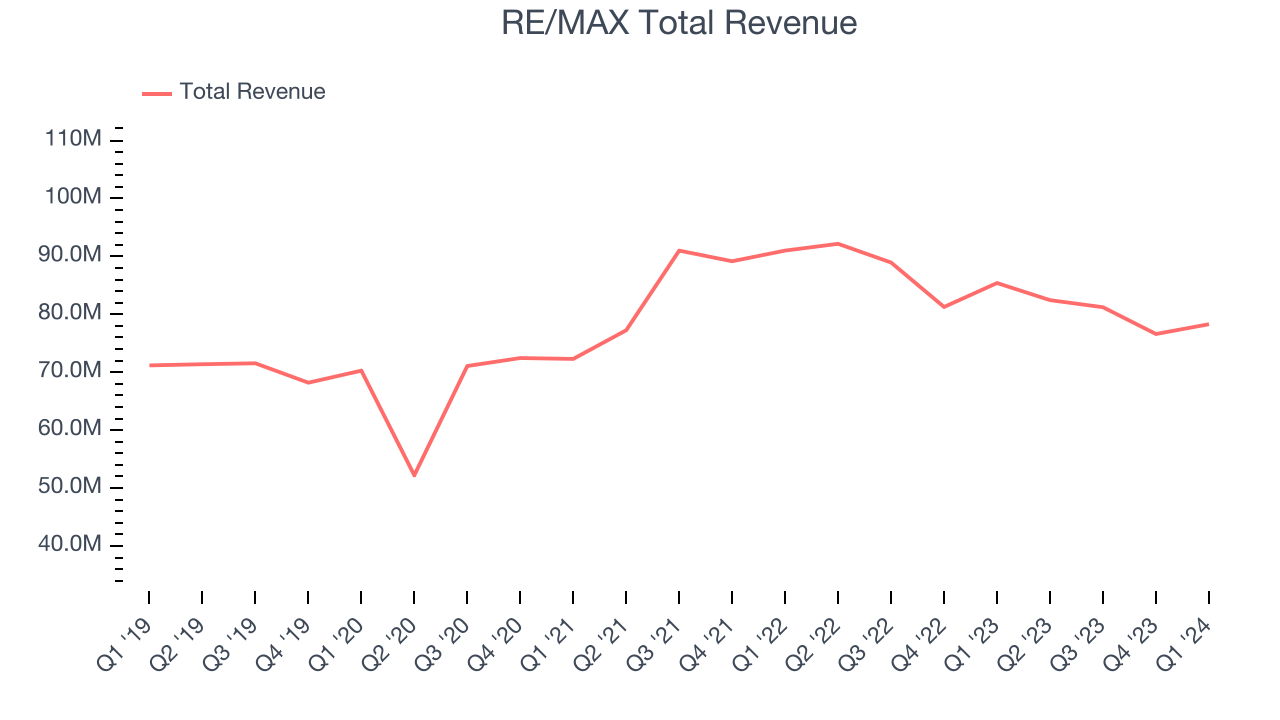 Within consumer discretionary, product cycles are short and revenue can be hit-driven due to rapidly changing trends. That's why we also follow short-term performance. RE/MAX's recent history shows a reversal from its already weak five-year trend as its revenue has shown annualized declines of 4.4% over the last two years.
We can better understand the company's revenue dynamics by analyzing its number of agents, which reached 143,287 in the latest quarter. Over the last two years, RE/MAX's agents averaged 1.1% year-on-year growth. Because this number is higher than its revenue growth during the same period, we can see the company's monetization of its consumers has fallen. 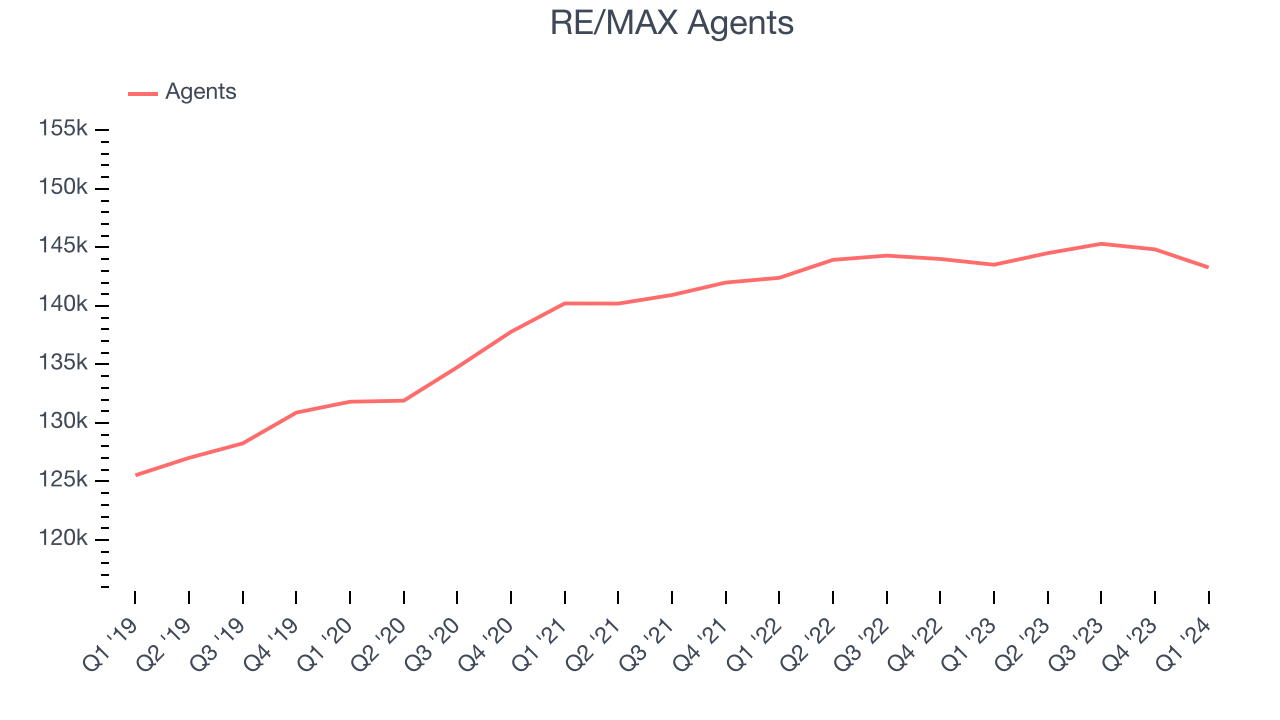
This quarter, RE/MAX's revenue fell 8.3% year on year to $78.29 million but beat Wall Street's estimates by 1.3%. The company is guiding for a 6% year-on-year revenue decline next quarter to $77.5 million, an improvement from the 10.6% year-on-year decrease it recorded in the same quarter last year. Looking ahead, Wall Street expects revenue to decline 2.6% over the next 12 months.
Operating Margin
Operating margin is a key measure of profitability. Think of it as net income–the bottom line–excluding the impact of taxes and interest on debt, which are less connected to business fundamentals.
RE/MAX was profitable over the last two years but held back by its large expense base. Its average operating margin of 3.7% has been paltry for a consumer discretionary business.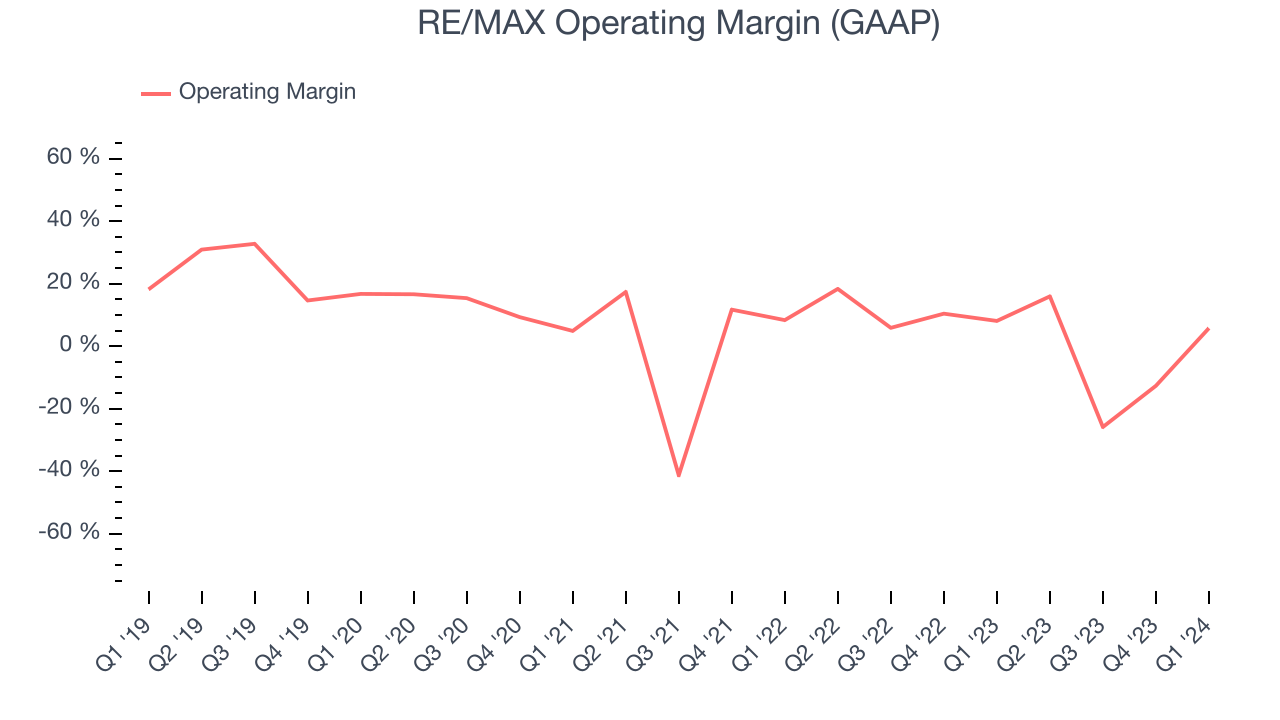
In Q1, RE/MAX generated an operating profit margin of 5.8%, down 2.3 percentage points year on year.
Over the next 12 months, Wall Street expects RE/MAX to become profitable. Analysts are expecting the company’s LTM operating margin of negative 4.1% to rise to positive 15.5%.EPS
Analyzing long-term revenue trends tells us about a company's historical growth, but the long-term change in its earnings per share (EPS) points to the profitability and efficiency of that growth–for example, a company could inflate its sales through excessive spending on advertising and promotions. 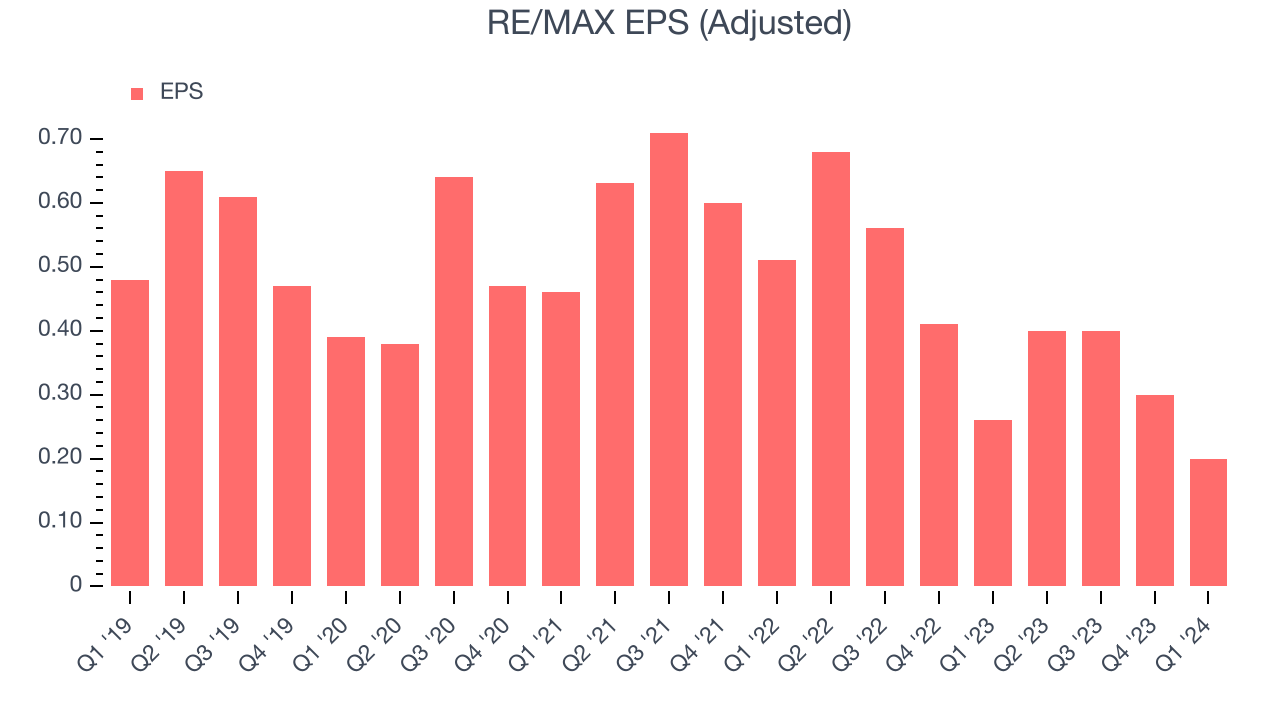
Over the last five years, RE/MAX's EPS dropped 63.3%, translating into 10.3% annualized declines. We tend to steer our readers away from companies with falling EPS, where diminishing earnings could imply changing secular trends or consumer preferences. Consumer discretionary companies are particularly exposed to this, leaving a low margin of safety around the company (making the stock susceptible to large downward swings).
In Q1, RE/MAX reported EPS at $0.20, down from $0.26 in the same quarter last year. Despite falling year on year, this print beat analysts' estimates by 3.5%. Over the next 12 months, Wall Street expects RE/MAX to perform poorly. Analysts are projecting its LTM EPS of $1.30 to shrink by 1.3% to $1.28.
Cash Is King
Although earnings are undoubtedly valuable for assessing company performance, we believe cash is king because you can't use accounting profits to pay the bills.
Over the last two years, RE/MAX has shown decent cash profitability, giving it some reinvestment opportunities. The company's free cash flow margin has averaged 11.9%, slightly better than the broader consumer discretionary sector.
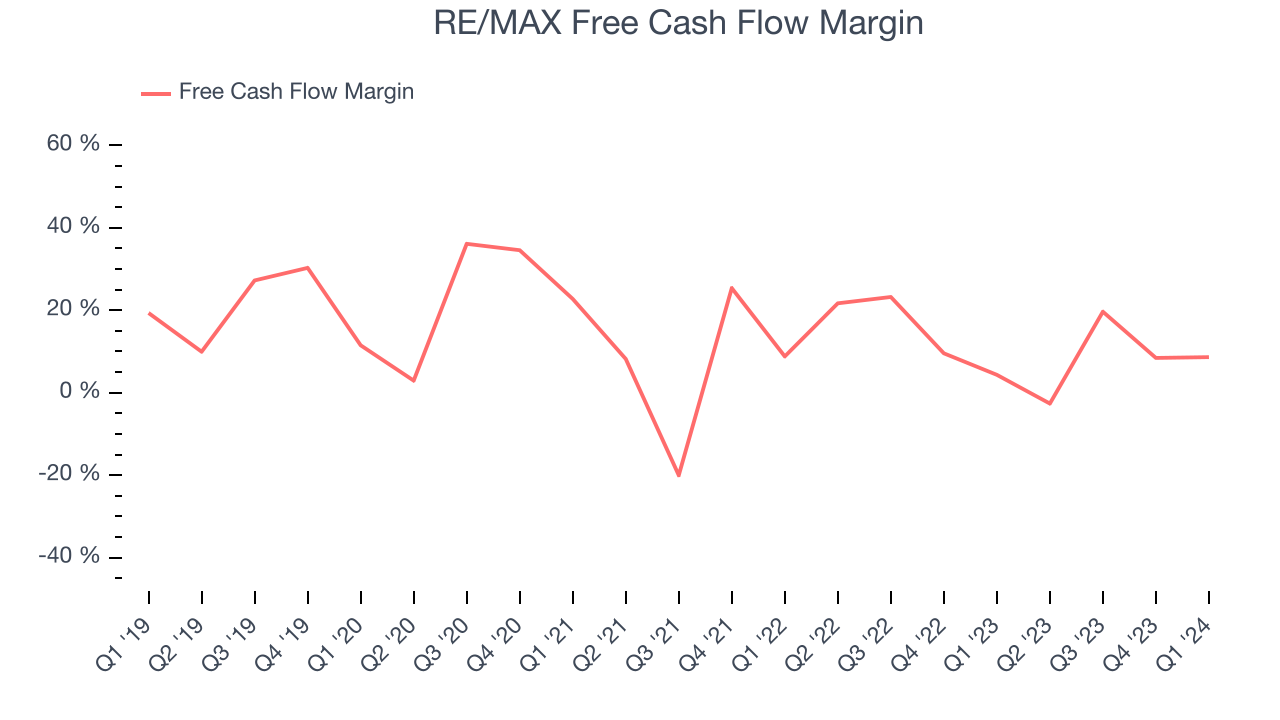
RE/MAX's free cash flow came in at $6.76 million in Q1, equivalent to a 8.6% margin and up 82.2% year on year.
Return on Invested Capital (ROIC)
EPS and free cash flow tell us whether a company was profitable while growing revenue. But was it capital-efficient? Enter ROIC, a metric showing how much operating profit a company generates relative to how much money the business raised (debt and equity).
RE/MAX's five-year average return on invested capital was 1%, somewhat low compared to the best consumer discretionary companies that pump out 25%+. Its returns suggest it historically did a subpar job investing in profitable business initiatives.
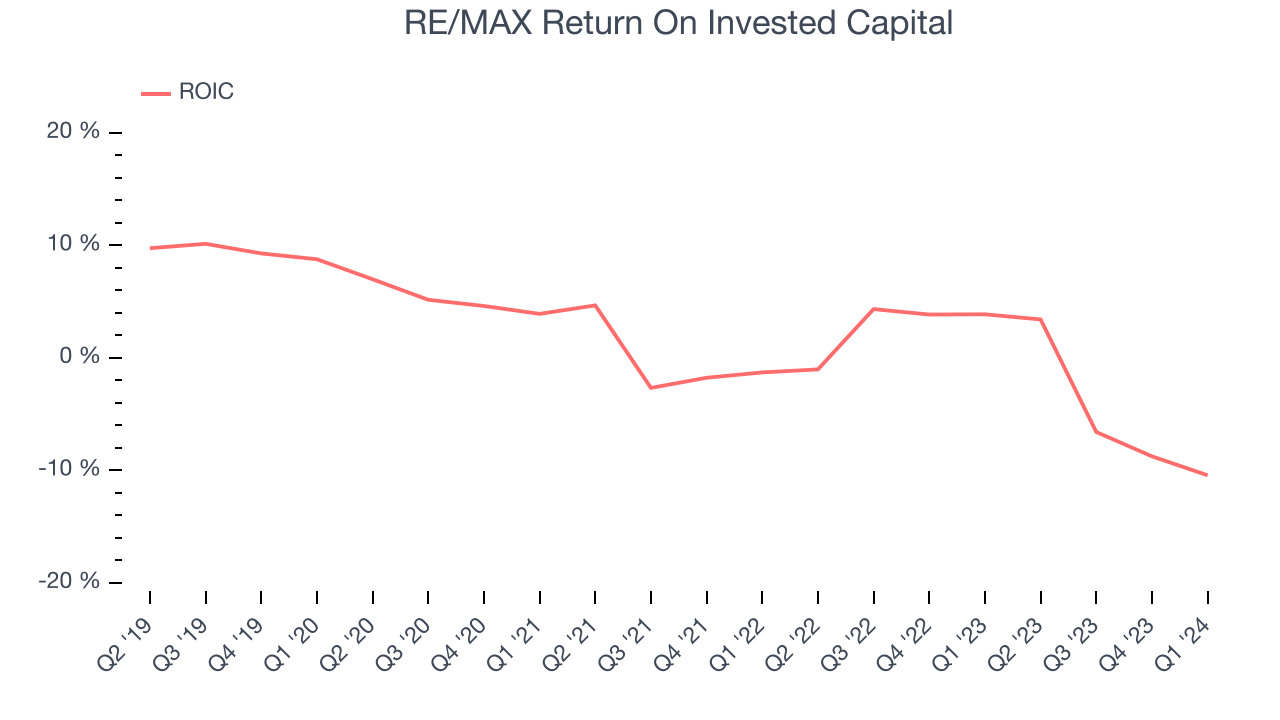
The trend in its ROIC, however, is often what surprises the market and drives the stock price. Unfortunately, RE/MAX's ROIC averaged 9.6 percentage point decreases over the last few years. Paired with its already low returns, these declines suggest the company's profitable business opportunities are few and far between.
Balance Sheet Risk
Debt is a tool that can boost company returns but presents risks if used irresponsibly.
RE/MAX reported $82.08 million of cash and $481 million of debt on its balance sheet in the most recent quarter. As investors in high-quality companies, we primarily focus on two things: 1) that a company's debt level isn't too high and 2) that its interest payments are not excessively burdening the business.
With $95.36 million of EBITDA over the last 12 months, we view RE/MAX's 4.2x net-debt-to-EBITDA ratio as safe. We also see its $15.83 million of annual interest expenses as appropriate. The company's profits give it plenty of breathing room, allowing it to continue investing in new initiatives.
Key Takeaways from RE/MAX's Q1 Results
It was encouraging to see RE/MAX narrowly top analysts' revenue expectations this quarter. We were also happy its EPS narrowly outperformed Wall Street's estimates. That the company reaffirmed full year revenue and adjusted EBITDA guidance means the company is on track. On the other hand, its operating margin missed and its number of agents fell short of Wall Street's estimates. Overall, this was a fine quarter for RE/MAX. The stock is up 5.3% after reporting and currently trades at $7.55 per share.
Is Now The Time?
RE/MAX may have had a fine quarter, but investors should also consider its valuation and business qualities when assessing the investment opportunity.
We cheer for all companies serving consumers, but in the case of RE/MAX, we'll be cheering from the sidelines. Its revenue growth has been uninspiring over the last five years, and analysts expect growth to deteriorate from here. And while its solid free cash flow generation gives it re-investment options, the downside is its declining EPS over the last five years makes it hard to trust. On top of that, its relatively low ROIC suggests it has historically struggled to find compelling business opportunities.
RE/MAX's price-to-earnings ratio based on the next 12 months is 5.6x. While there are some things to like about RE/MAX and its valuation is reasonable, we think there are better opportunities elsewhere in the market right now.
Wall Street analysts covering the company had a one-year price target of $9.25 per share right before these results (compared to the current share price of $7.55).
To get the best start with StockStory, check out our most recent stock picks, and then sign up for our earnings alerts by adding companies to your watchlist here. We typically have the quarterly earnings results analyzed within seconds of the data being released, and especially for companies reporting pre-market, this often gives investors the chance to react to the results before the market has fully absorbed the information.