
Online casino and sports betting company Rush Street Interactive (NYSE:RSI) reported Q1 CY2024 results topping analysts' expectations, with revenue up 33.9% year on year to $217.4 million. The company's full-year revenue guidance of $835 million at the midpoint also came in 4.4% above analysts' estimates. It made a non-GAAP profit of $0.03 per share, improving from its loss of $0.08 per share in the same quarter last year.
Rush Street Interactive (RSI) Q1 CY2024 Highlights:
- Revenue: $217.4 million vs analyst estimates of $198 million (9.8% beat)
- Adjusted EBITDA: $17.1 million vs analyst estimates of $5.7 million (large beat)
- EPS (non-GAAP): $0.03 vs analyst estimates of -$0.02 ($0.05 beat)
- The company lifted its revenue guidance for the full year from $800 million to $835 million at the midpoint, a 4.4% increase (above expectations)
- The company lifted its adjusted EBITDA guidance for the full year from $40 million to $55 million at the midpoint (above expectations)
- Gross Margin (GAAP): 33.5%, down from 34% in the same quarter last year
- Monthly Active Users: 176,000
- Market Capitalization: $508.3 million
Specializing in online casino gaming and sports betting, Rush Street Interactive (NYSE:RSI) is an operator of digital gaming platforms.
Rush Street Interactive recognized the burgeoning demand for mobile gaming and entered the market in 2012 to address the need for high-quality, user-friendly online games.
Today, the company provides a wide array of online casino games and sports betting options through its digital platforms. This lineup includes slot games, table games, and sportsbooks, appealing to both casual and serious players.
Rush Street Interactive generates revenue by acting as "the house" for its real-money gaming customers. In the company's social gaming business, which doesn't use real money, revenue is derived from in-game purchases for virtual currencies that can be used to play games.
Gaming Solutions
Gaming solution companies operate in a dynamic and evolving market, and the digital transformation of the gaming industry presents significant opportunities for innovation and growth, whether it be immersive slot machine terminals or mobile sports betting. However, the gaming solution industry is not without its challenges. Regulatory compliance is a crucial consideration as companies must navigate a complex and often fragmented regulatory landscape across different jurisdictions. Changes in regulations can impact product offerings, operational practices, and market access, requiring companies to maintain flexibility and adaptability in their business strategies. Additionally, the competitive nature of the industry necessitates continuous investment in research and development to stay ahead of competitors and meet evolving consumer demands.
Sales Growth
A company’s long-term performance can give signals about its business quality. Any business can put up a good quarter or two, but many enduring ones muster years of growth. Rush Street Interactive's annualized revenue growth rate of 71% over the last four years was incredible for a consumer discretionary business. 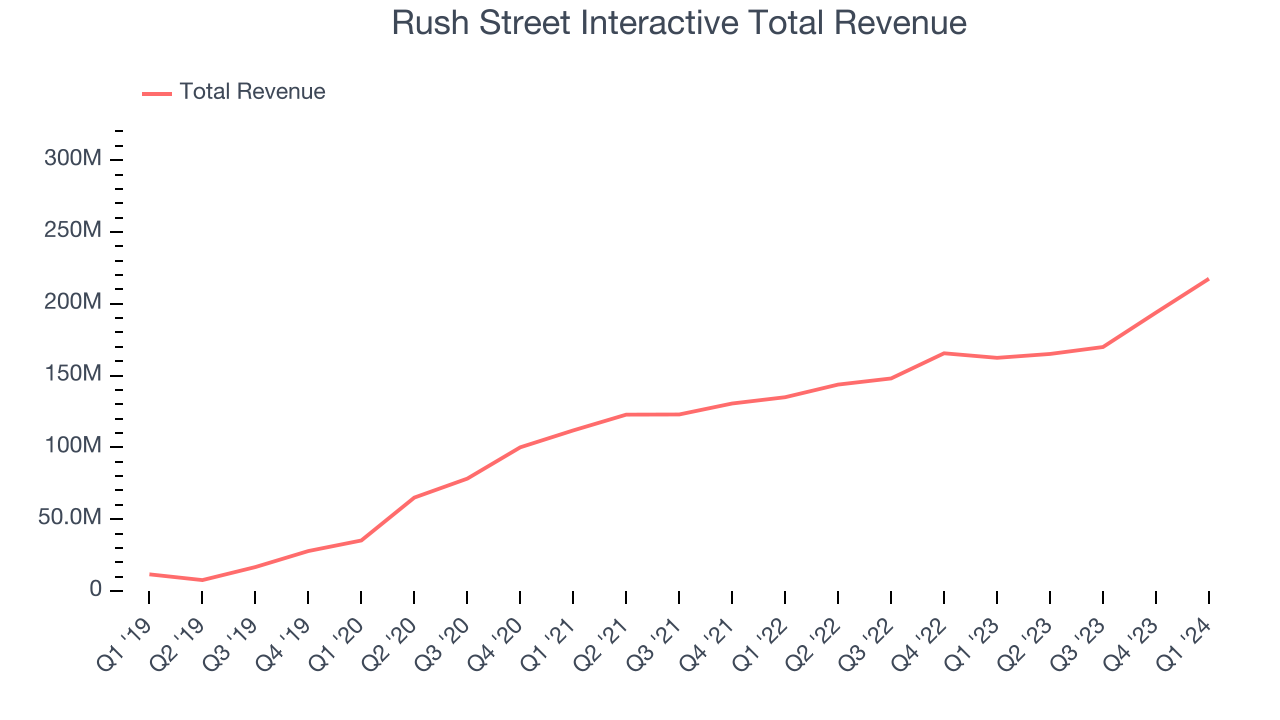 Within consumer discretionary, a long-term historical view may miss a company riding a successful new product or emerging trend. That's why we also follow short-term performance. Rush Street Interactive's recent history shows its momentum has slowed as its annualized revenue growth of 20.8% over the last two years is below its four-year trend.
This quarter, Rush Street Interactive reported wonderful year-on-year revenue growth of 33.9%, and its $217.4 million of revenue exceeded Wall Street's estimates by 9.8%. Looking ahead, Wall Street expects sales to grow 7.8% over the next 12 months, a deceleration from this quarter.
Operating Margin
Operating margin is a key measure of profitability. Think of it as net income–the bottom line–excluding the impact of taxes and interest on debt, which are less connected to business fundamentals.
Although Rush Street Interactive was profitable this quarter from an operational perspective, it's generally struggled when zooming out. Its high expenses have contributed to an average operating margin of negative 9.1% over the last two years. This performance isn't ideal as demand in the consumer discretionary sector is volatile. We prefer to invest in companies that can weather industry downturns through consistent profitability.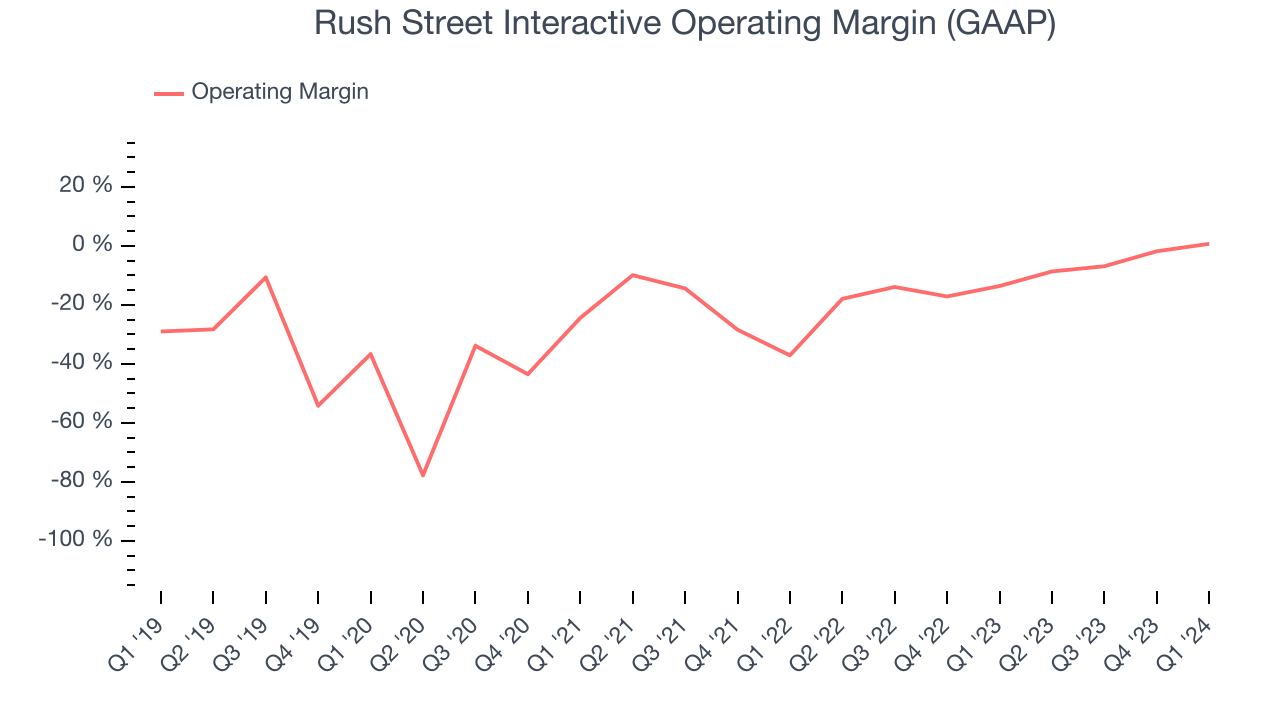
This quarter, Rush Street Interactive generated an operating profit margin of 0.7%, up 14.3 percentage points year on year.
Over the next 12 months, Wall Street expects Rush Street Interactive to shrink its losses but remain unprofitable. Analysts are expecting the company’s LTM operating margin of negative 3.8% to rise to negative 1.7%.EPS
We track long-term historical earnings per share (EPS) growth for the same reason as long-term revenue growth. Compared to revenue, however, EPS highlights whether a company's growth was profitable. 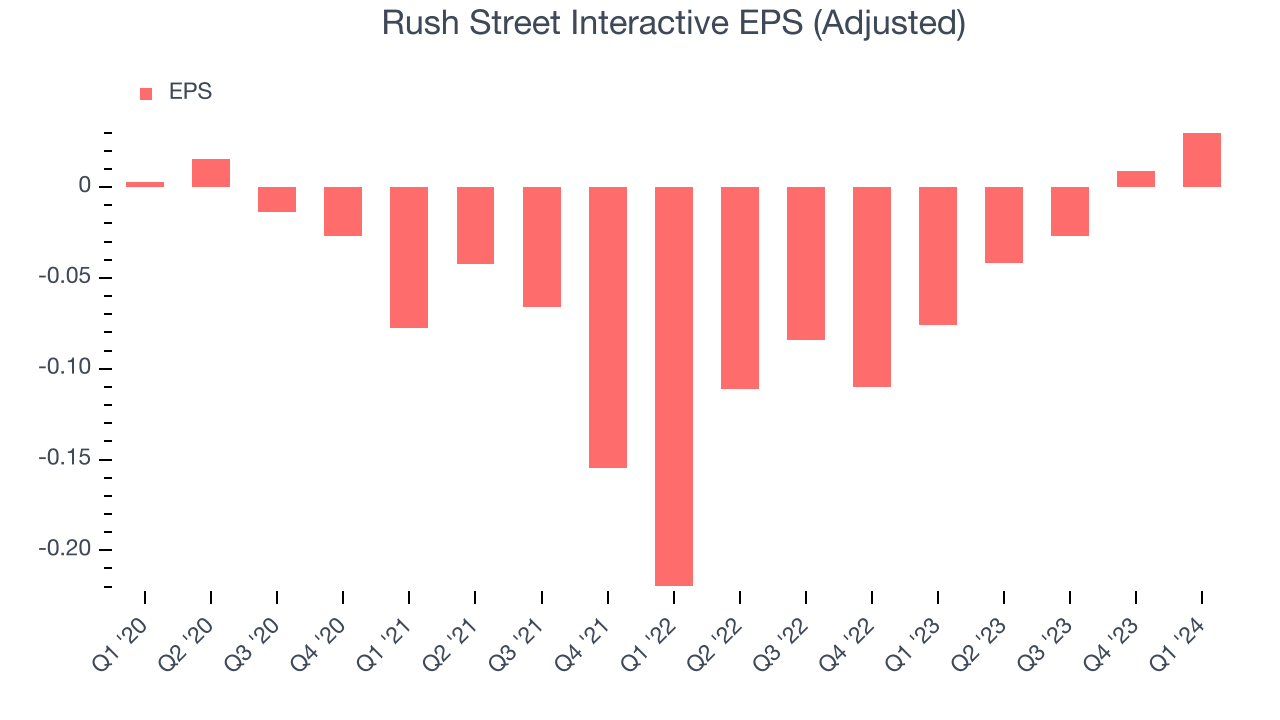
Over the last three years, Rush Street Interactive cut its earnings losses and improved its EPS by 33.7% each year.
In Q1, Rush Street Interactive reported EPS at $0.03, up from negative $0.08 in the same quarter last year. This print easily cleared analysts' estimates, and shareholders should be content with the results. Over the next 12 months, Wall Street is optimistic. Analysts are projecting Rush Street Interactive's LTM EPS of negative $0.03 to reach break even.
Return on Invested Capital (ROIC)
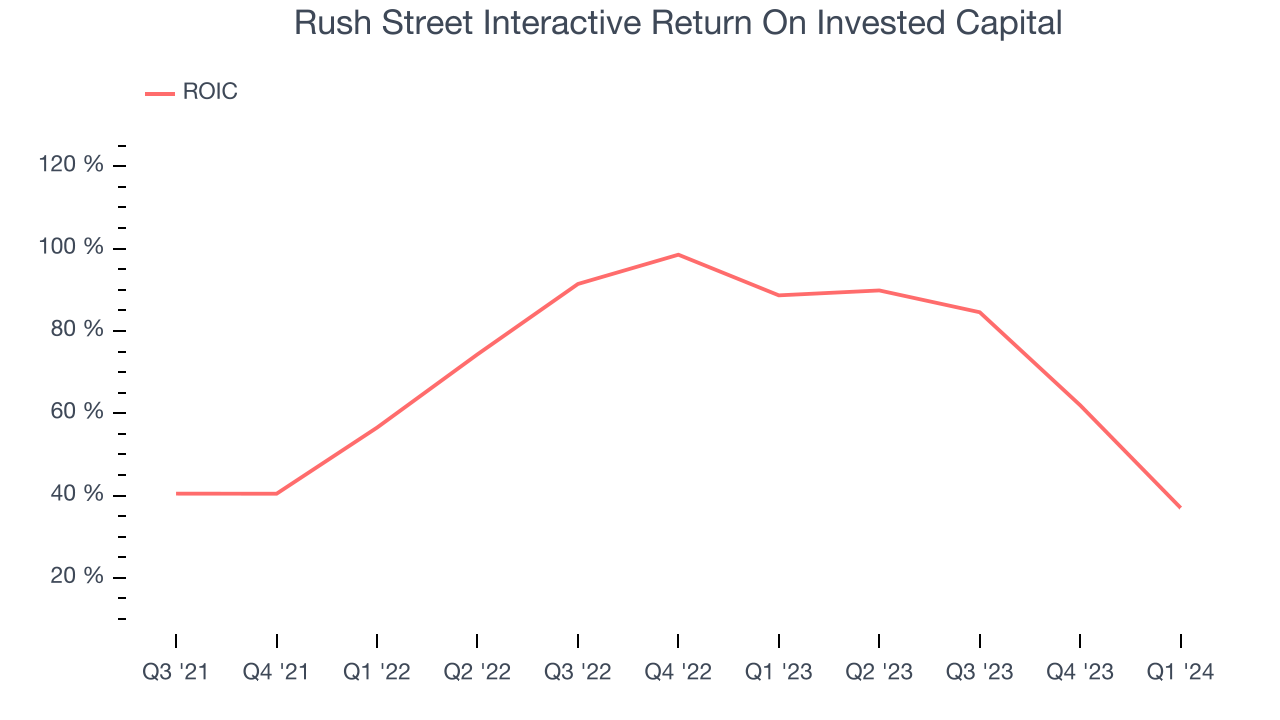
EPS and free cash flow tell us whether a company was profitable while growing revenue. But was it capital-efficient? Enter ROIC, a metric showing how much operating profit a company generates relative to how much money the business raised (debt and equity).
Although Rush Street Interactive hasn't been the highest-quality company lately, it historically did a wonderful job investing in profitable business initiatives. Its five-year average return on invested capital was 60.7%, splendid for a consumer discretionary business.
Balance Sheet Risk
As long-term investors, the risk we care most about is the permanent loss of capital. This can happen when a company goes bankrupt or raises money from a disadvantaged position and is separate from short-term stock price volatility, which we are much less bothered by.
Rush Street Interactive is a well-capitalized company with $191 million of cash and no debt. This position gives Rush Street Interactive the freedom to borrow money, return capital to shareholders, or invest in growth initiatives.
Key Takeaways from Rush Street Interactive's Q1 Results
This was a 'beat and raise' quarter. We were impressed that Rush Street Interactive beat revenue, adjusted EBITDA, and EPS expectations this quarter. We were also that the company lifted full year guidance, which is above expectations for key line items. Zooming out, we think this was a great quarter that shareholders will appreciate. The stock is up 10.9% after reporting and currently trades at $7.1 per share.
Is Now The Time?
Rush Street Interactive may have had a good quarter, but investors should also consider its valuation and business qualities when assessing the investment opportunity.
We cheer for all companies serving consumers, but in the case of Rush Street Interactive, we'll be cheering from the sidelines. Although its revenue growth has been exceptional over the last four years, its projected EPS for the next year is lacking. And while its stellar ROIC suggests it has been a well-run company historically, the downside is its cash burn raises the question of whether it can sustainably maintain growth.
While we've no doubt one can find things to like about Rush Street Interactive, we think there are better opportunities elsewhere in the market. We don't see many reasons to get involved at the moment.
Wall Street analysts covering the company had a one-year price target of $8.25 per share right before these results (compared to the current share price of $7.10).
To get the best start with StockStory, check out our most recent stock picks, and then sign up for our earnings alerts by adding companies to your watchlist here. We typically have the quarterly earnings results analyzed within seconds of the data being released, and especially for companies reporting pre-market, this often gives investors the chance to react to the results before the market has fully absorbed the information.