
Aerospace and defense company Raytheon (NYSE:RTX) beat Wall Street’s revenue expectations in Q3 CY2024, with sales up 6% year on year to $20.09 billion. The company’s full-year revenue guidance of $79.5 billion at the midpoint also came in 2,165,191,884,924% above analysts’ estimates. Its non-GAAP profit of $1.45 per share was also 8.3% above analysts’ consensus estimates.
Is now the time to buy RTX? Find out by accessing our full research report, it’s free.
RTX (RTX) Q3 CY2024 Highlights:
- Revenue: $20.09 billion vs analyst estimates of $19.82 billion (1.4% beat)
- Adjusted EPS: $1.45 vs analyst estimates of $1.34 (8.3% beat)
- EBITDA: $3.12 billion vs analyst estimates of $3.13 billion (small miss)
- The company slightly lifted its revenue guidance for the full year to $79.5 billion at the midpoint from $79.13 billion
- Management raised its full-year Adjusted EPS guidance to $5.54 at the midpoint, a 2.6% increase
- Gross Margin (GAAP): 20.1%, down from 32.7% in the same quarter last year
- Free Cash Flow Margin: 9.8%, down from 14.5% in the same quarter last year
- Market Capitalization: $167.2 billion
Company Overview
Originally focused on refrigeration technology, Raytheon (NSYE:RTX) provides a a variety of products and services to the aerospace and defense industries.
Defense Contractors
Defense contractors typically require technical expertise and government clearance. Companies in this sector can also enjoy long-term contracts with government bodies, leading to more predictable revenues. Combined, these factors create high barriers to entry and can lead to limited competition. Lately, geopolitical tensions–whether it be Russia’s invasion of Ukraine or China’s aggression towards Taiwan–highlight the need for defense spending. On the other hand, demand for these products can ebb and flow with defense budgets and even who is president, as different administrations can have vastly different ideas of how to allocate federal funds.
Sales Growth
A company’s long-term performance can indicate its business quality. Any business can put up a good quarter or two, but many enduring ones grow for years. Over the last five years, RTX grew its sales at a sluggish 4.5% compounded annual growth rate. This shows it failed to expand in any major way and is a rough starting point for our analysis.
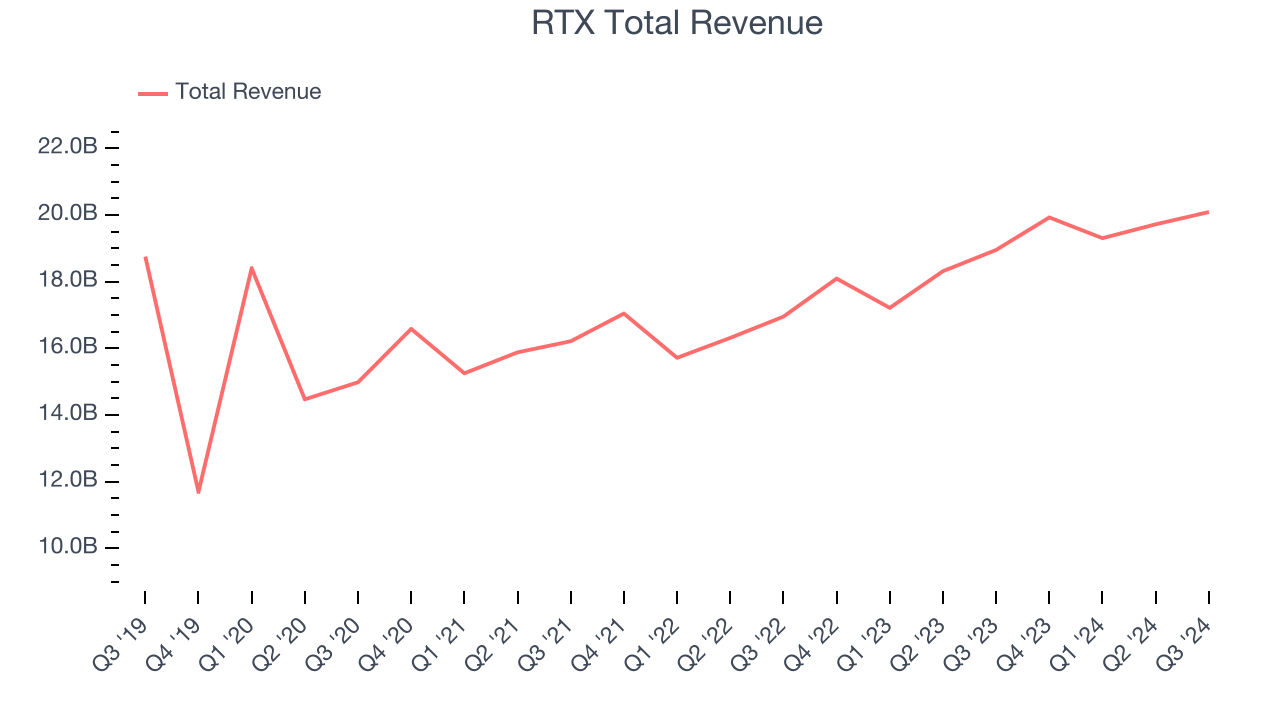
We at StockStory place the most emphasis on long-term growth, but within industrials, a half-decade historical view may miss cycles, industry trends, or a company capitalizing on catalysts such as a new contract win or a successful product line. RTX’s annualized revenue growth of 9.4% over the last two years is above its five-year trend, suggesting its demand recently accelerated.
This quarter, RTX reported year-on-year revenue growth of 6%, and its $20.09 billion of revenue exceeded Wall Street’s estimates by 1.4%.
Looking ahead, sell-side analysts expect revenue to grow 4.4% over the next 12 months, a deceleration versus the last two years. This projection is underwhelming and indicates the market believes its products and services will face some demand challenges.
Today’s young investors won’t have read the timeless lessons in Gorilla Game: Picking Winners In High Technology because it was written more than 20 years ago when Microsoft and Apple were first establishing their supremacy. But if we apply the same principles, then enterprise software stocks leveraging their own generative AI capabilities may well be the Gorillas of the future. So, in that spirit, we are excited to present our Special Free Report on a profitable, fast-growing enterprise software stock that is already riding the automation wave and looking to catch the generative AI next.
Operating Margin
RTX was profitable over the last five years but held back by its large cost base. Its average operating margin of 5.1% was weak for an industrials business.
On the bright side, RTX’s annual operating margin rose by 9.7 percentage points over the last five years.
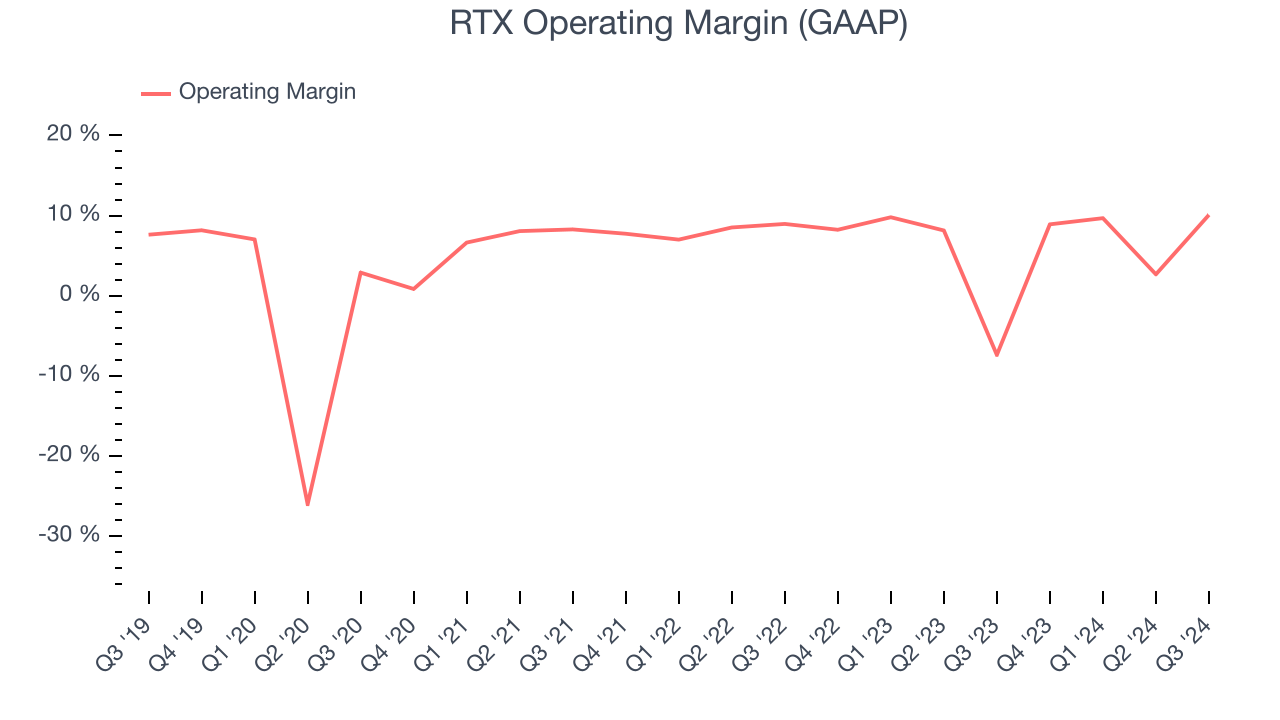
In Q3, RTX generated an operating profit margin of 10.1%, up 17.5 percentage points year on year. This increase was a welcome development and shows it was recently more efficient because its expenses grew slower than its revenue.
Earnings Per Share
Analyzing long-term revenue trends tells us about a company’s historical growth, but the long-term change in its earnings per share (EPS) points to the profitability of that growth – for example, a company could inflate its sales through excessive spending on advertising and promotions.
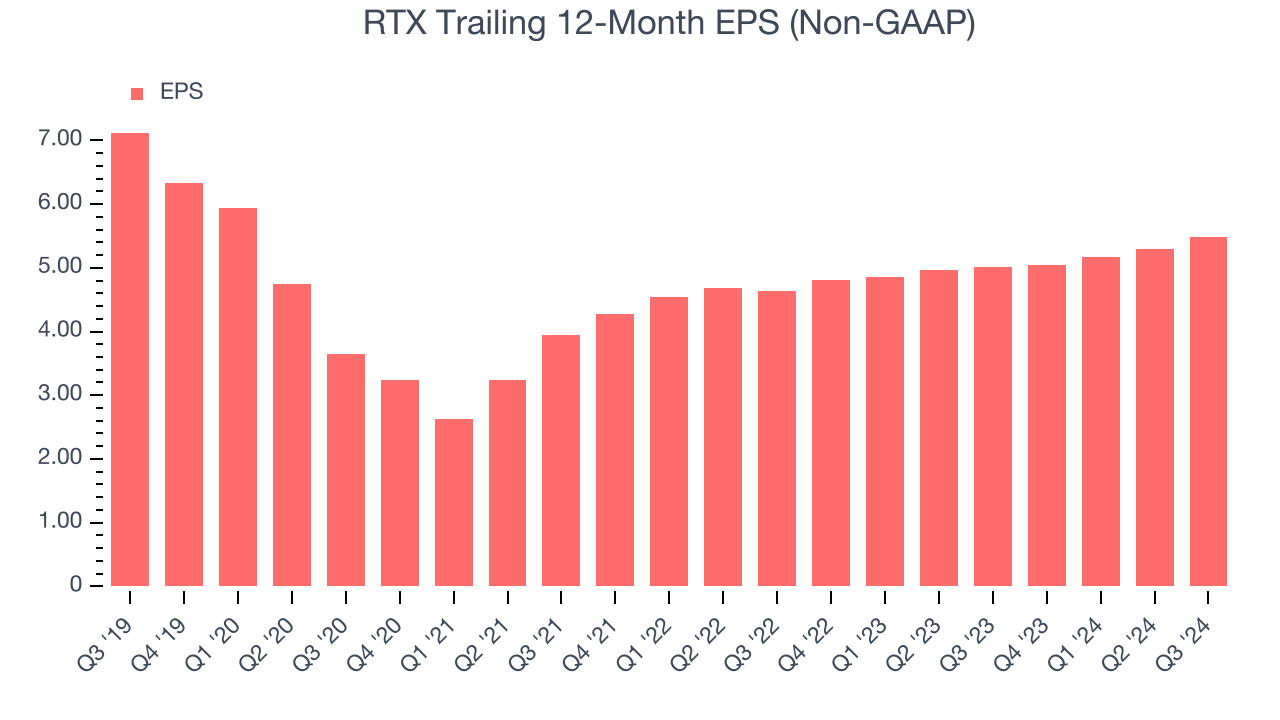
Sadly for RTX, its EPS declined by 5.1% annually over the last five years while its revenue grew by 4.5%. However, its operating margin actually expanded during this timeframe, telling us non-fundamental factors affected its ultimate earnings.
Diving into the nuances of RTX’s earnings can give us a better understanding of its performance. A five-year view shows RTX has diluted its shareholders, growing its share count by 55.8%. This dilution overshadowed its increased operating efficiency and has led to lower per share earnings. Taxes and interest expenses can also affect EPS but don’t tell us as much about a company’s fundamentals. 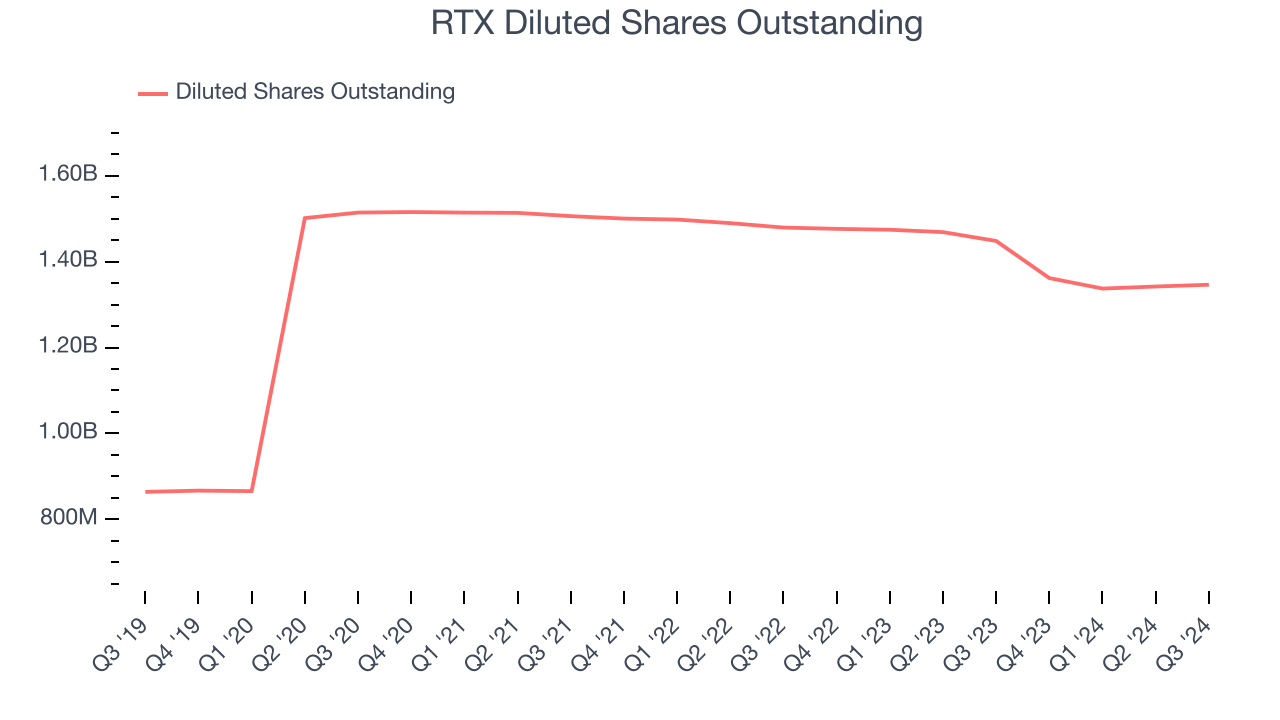
Like with revenue, we analyze EPS over a more recent period because it can give insight into an emerging theme or development for the business. For RTX, its two-year annual EPS growth of 8.9% was higher than its five-year trend. Accelerating earnings growth is almost always an encouraging data point.
In Q3, RTX reported EPS at $1.45, up from $1.25 in the same quarter last year. This print beat analysts’ estimates by 8.3%. Over the next 12 months, Wall Street expects RTX’s full-year EPS of $5.49 to grow by 7.1%.
Key Takeaways from RTX’s Q3 Results
We were impressed by RTX’s optimistic full-year revenue guidance, which blew past analysts’ expectations. We were also glad its full-year EPS guidance exceeded Wall Street’s estimates. Overall, we think this was a decent quarter with some key metrics above expectations. The stock remained flat at $126.92 immediately after reporting.
RTX may have had a good quarter, but does that mean you should invest right now?When making that decision, it’s important to consider its valuation, business qualities, as well as what has happened in the latest quarter. We cover that in our actionable full research report which you can read here, it’s free.