Beauty supply retailer Sally Beauty (NYSE:SBH) reported results in line with analysts' expectations in Q1 CY2024, with revenue down 1.1% year on year to $908.4 million. It made a non-GAAP profit of $0.35 per share, down from its profit of $0.41 per share in the same quarter last year.
Sally Beauty (SBH) Q1 CY2024 Highlights:
- Revenue: $908.4 million vs analyst estimates of $910.8 million (small miss)
- EPS (non-GAAP): $0.35 vs analyst expectations of $0.39 (11.2% miss)
- Gross Margin (GAAP): 51%, in line with the same quarter last year
- Free Cash Flow of $22.83 million, up from $7.52 million in the same quarter last year
- Same-Store Sales were down 1.5% year on year
- Store Locations: 4,468 at quarter end, decreasing by 16 over the last 12 months
- Market Capitalization: $1.13 billion
Catering to both everyday consumers as well as salon professionals, Sally Beauty (NYSE:SBH) is a retailer that sells salon-quality beauty products such as makeup and haircare products.
With regards to the merchandise selection, the company has a strong focus on hair color, hair care, skin care, and nail products. Brands such as Wella, Clairol Professional, and Conair can be found in stores. A Sally Beauty store tends to be small, roughly 2,500 square feet, and located in urban and suburban shopping centers. The company also has an e-commerce platform, launched in 1999, that supplements its brick and mortar operations.
The company operates two banners: Sally Beauty Supply and Beauty Systems Group. Sally Beauty Supply serves the everyday consumer while Beauty Systems serves the salon professional and requires certain credentials and identification to enter. Beauty Systems burnishes the company’s reputation, showing the everyday consumer that Sally Beauty products are used in salons, while Sally Beauty Supply addresses the much larger market of consumer beauty aficionados.
The core customer of Sally Beauty Supply is typically a woman between 18 and 35 years old who considers herself a beauty enthusiast. She has specific preferences with regards to her beauty products and desires more professional-grade offerings which may not be available in the average department store or general merchandise retailer.
Beauty and Cosmetics Retailer
Beauty and cosmetics retailers understand that beauty is in the eye of the beholder, but a little lipstick, nail polish, and glowing skin also help the cause. These stores—which mostly cater to consumers but can also garner the attention of salon pros—aim to be a one-stop personal care and beauty products shop with many brands across many categories. E-commerce is changing how consumers buy cosmetics, so these retailers are constantly evolving to meet the customer where and how they want to shop.
Retailers specializing in beauty products include Ulta Beauty (NASDAQ:ULTA) and Bath & Body Works while department stores such as Kohl’s (NYSE:KSS) and Macy’s (NYSE:M) typically feature large cosmetics and fragrance sections.Sales Growth
Sally Beauty is a mid-sized retailer, which sometimes brings disadvantages compared to larger competitors benefiting from better economies of scale. On the other hand, it has an edge over smaller competitors with fewer resources and can still flex high growth rates because it's growing off a smaller base than its larger counterparts.
As you can see below, the company's revenue has declined over the last four years, dropping 1.1% annually as its store count and sales at existing, established stores have both shrunk.
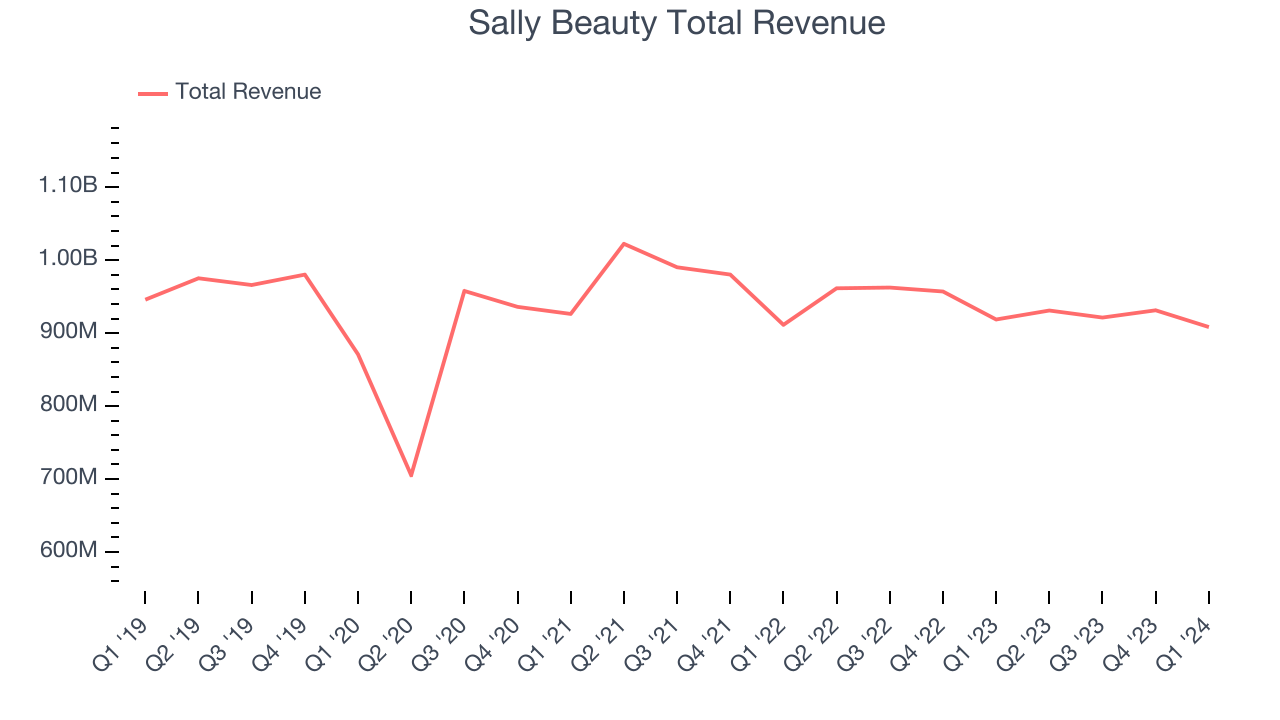
This quarter, Sally Beauty missed Wall Street's estimates and reported a rather uninspiring 1.1% year-on-year revenue decline, generating $908.4 million in revenue. Looking ahead, Wall Street expects sales to grow 1.3% over the next 12 months, an acceleration from this quarter.
Same-Store Sales
Sally Beauty's demand has been shrinking over the last eight quarters, and on average, its same-store sales have declined by 0% year on year. The company has been reducing its store count as fewer locations sometimes lead to higher same-store sales, but that hasn't been the case here.
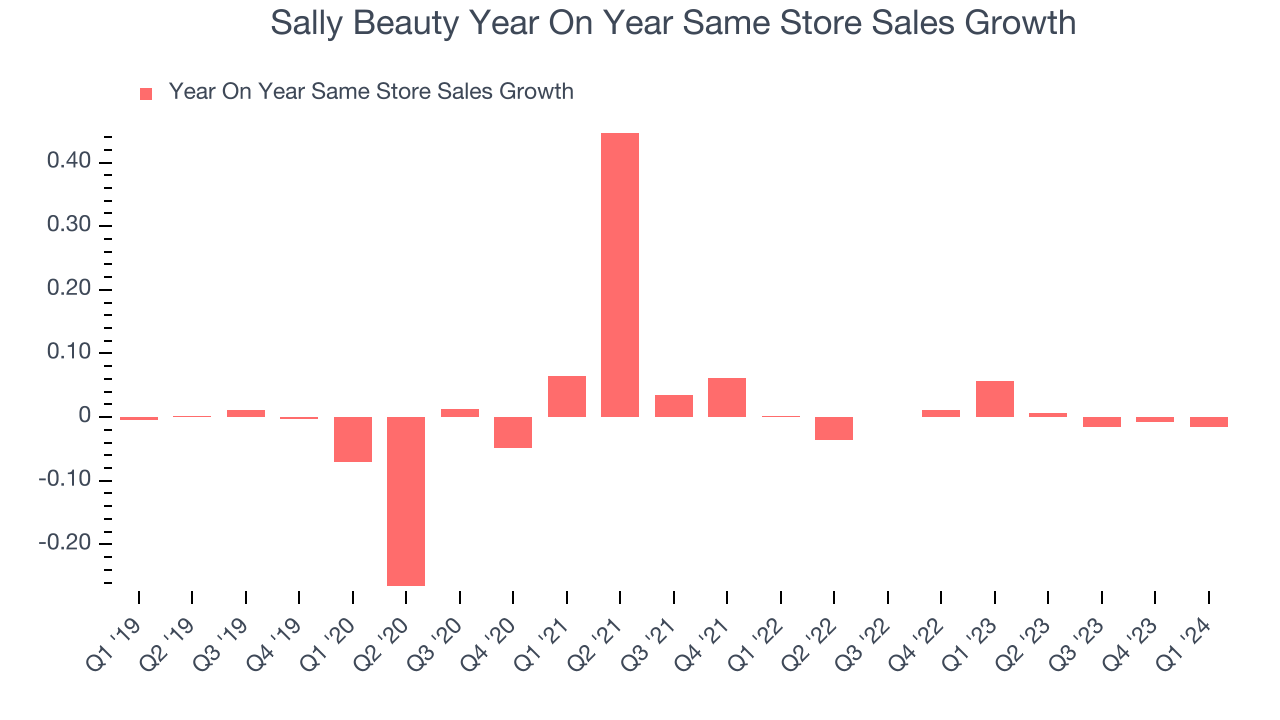
In the latest quarter, Sally Beauty's same-store sales fell 1.5% year on year. This decline was a reversal from the 5.7% year-on-year increase it posted 12 months ago. We'll be keeping a close eye on the company to see if this turns into a longer-term trend.
Number of Stores
When a retailer like Sally Beauty is shuttering stores, it usually means that brick-and-mortar demand is less than supply, and the company is responding by closing underperforming locations and possibly shifting sales online. At the end of this quarter, Sally Beauty operated 4,468 total retail locations, in line with its store count 12 months ago.
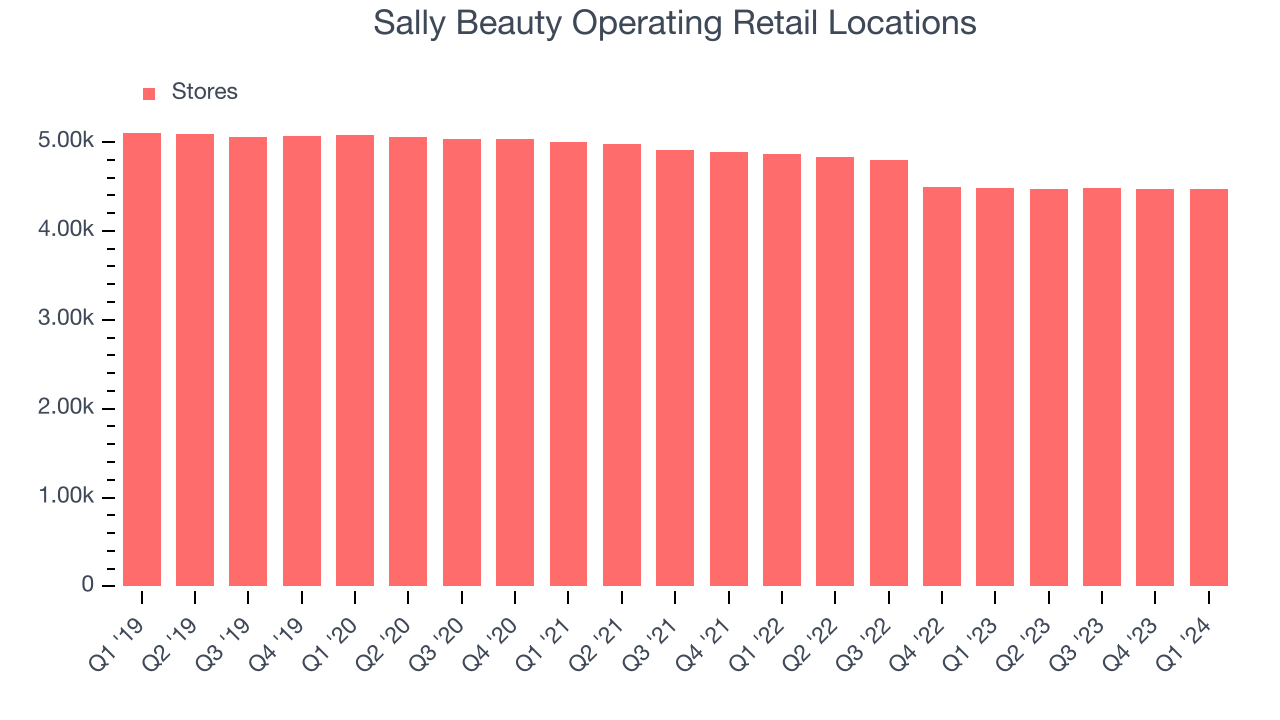
Taking a step back, the company has generally closed its stores over the last two years, averaging a 4.5% annual decline in its physical footprint. A smaller store base means that the company must rely on higher foot traffic and sales per customer at its remaining stores as well as e-commerce sales to fuel revenue growth.
Gross Margin & Pricing Power
Sally Beauty has best-in-class unit economics for a retailer, enabling it to invest in areas such as marketing and talent to stay one step ahead of the competition. As you can see below, it's averaged an exceptional 50.7% gross margin over the last two years. This means the company makes $0.51 for every $1 in revenue before accounting for its operating expenses.
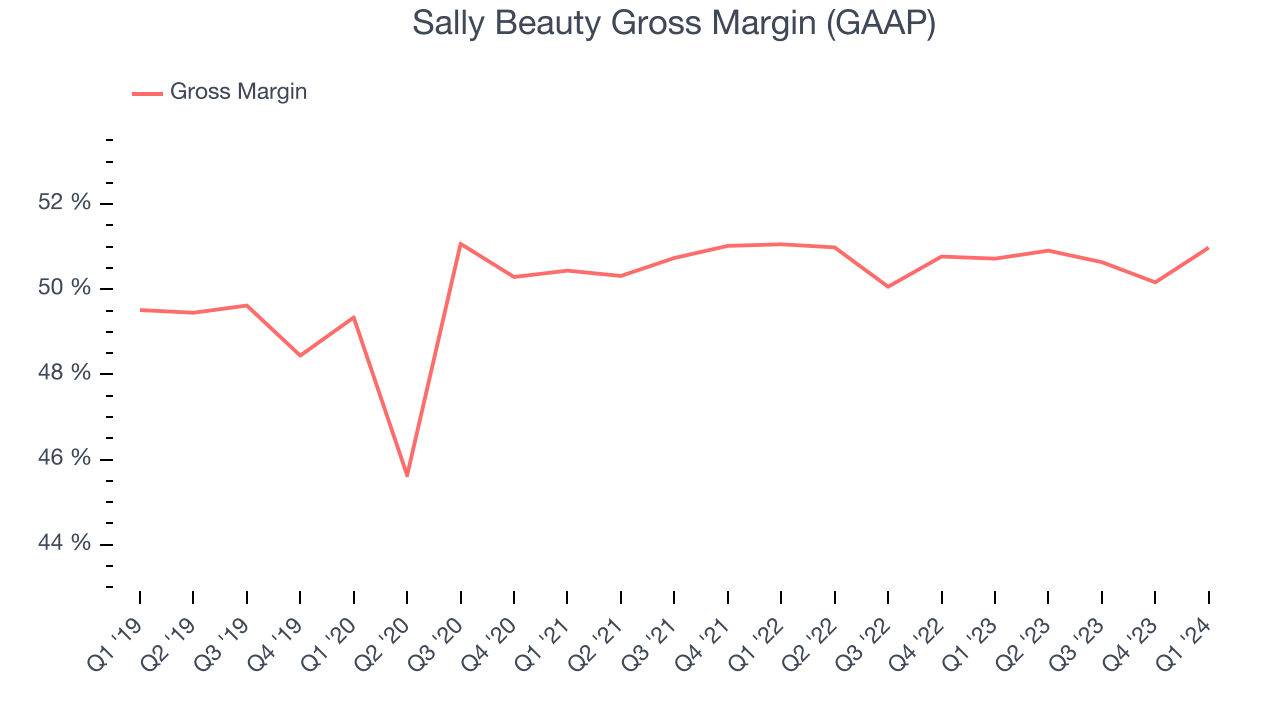
Sally Beauty's gross profit margin came in at 51% this quarter, flat with the same quarter last year. This steady margin stems from its efforts to keep prices low for consumers and signals that it has stable input costs (such as freight expenses to transport goods).
Operating Margin
Operating margin is an important measure of profitability for retailers as it accounts for all expenses keeping the lights on, including wages, rent, advertising, and other administrative costs.
In Q1, Sally Beauty generated an operating profit margin of 6.6%, down 1.2 percentage points year on year. Conversely, the company's gross margin actually increased, so we can assume the reduction was driven by weaker cost controls or operating leverage on fixed costs.
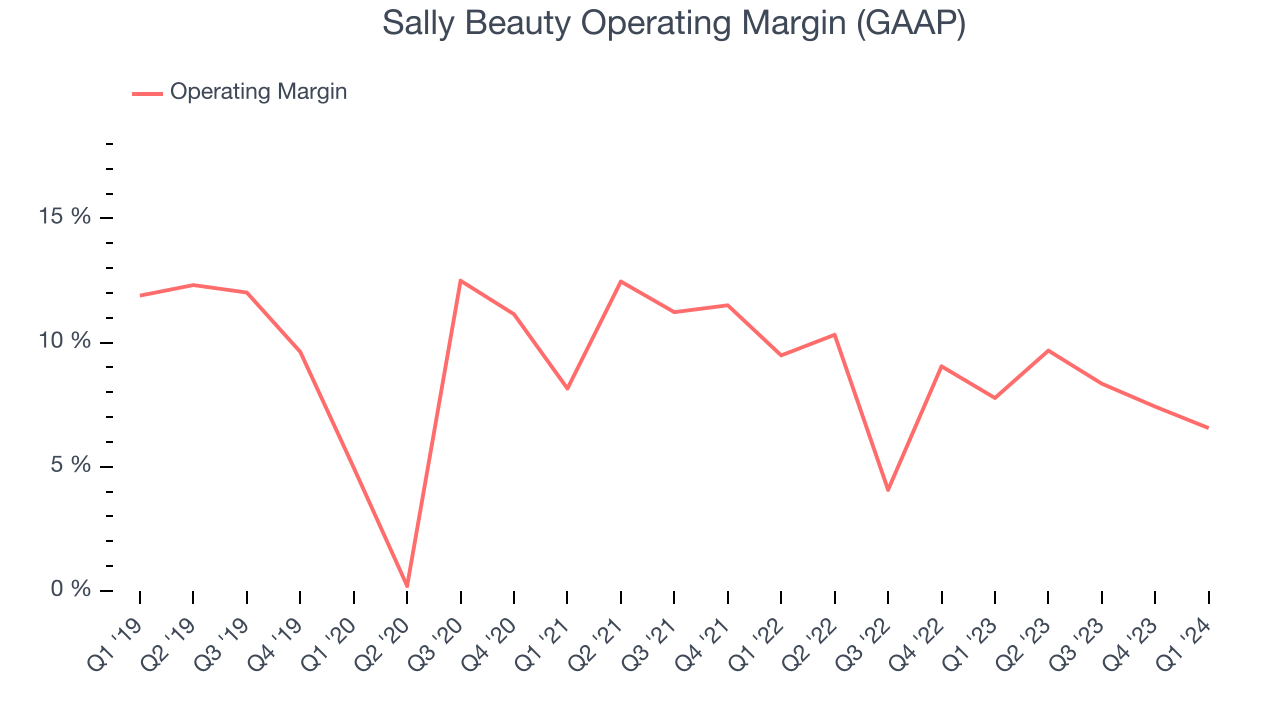 Zooming out, Sally Beauty was profitable over the last two years but held back by its large expense base. It's demonstrated mediocre profitability for a consumer retail business, producing an average operating margin of 7.9%. Its margin has also seen few fluctuations, meaning it will take a big change to improve profitability.
EPS
These days, some companies issue new shares like there's no tomorrow. That's why we like to track earnings per share (EPS) because it accounts for shareholder dilution and share buybacks.
In Q1, Sally Beauty reported EPS at $0.35, down from $0.41 in the same quarter a year ago. This print unfortunately missed Wall Street's estimates, but we care more about long-term EPS growth rather than short-term movements.
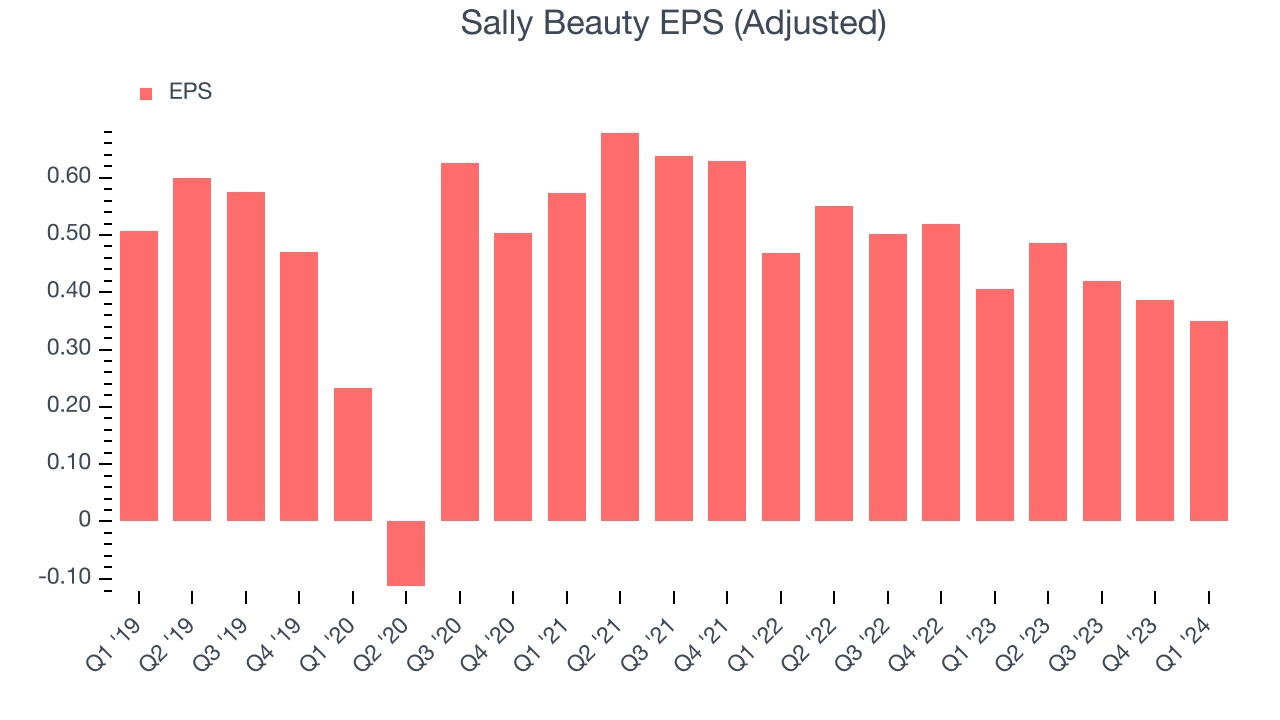
On the bright side, Wall Street expects the company's earnings to grow over the next 12 months, with analysts projecting an average 17.5% year-on-year increase in EPS.
Cash Is King
If you've followed StockStory for a while, you know that we emphasize free cash flow. Why, you ask? We believe in the end, cash is king, and you can't use accounting profits to pay the bills.
Sally Beauty's free cash flow came in at $22.83 million in Q1, up 203% year on year. This result represents a 2.5% margin.
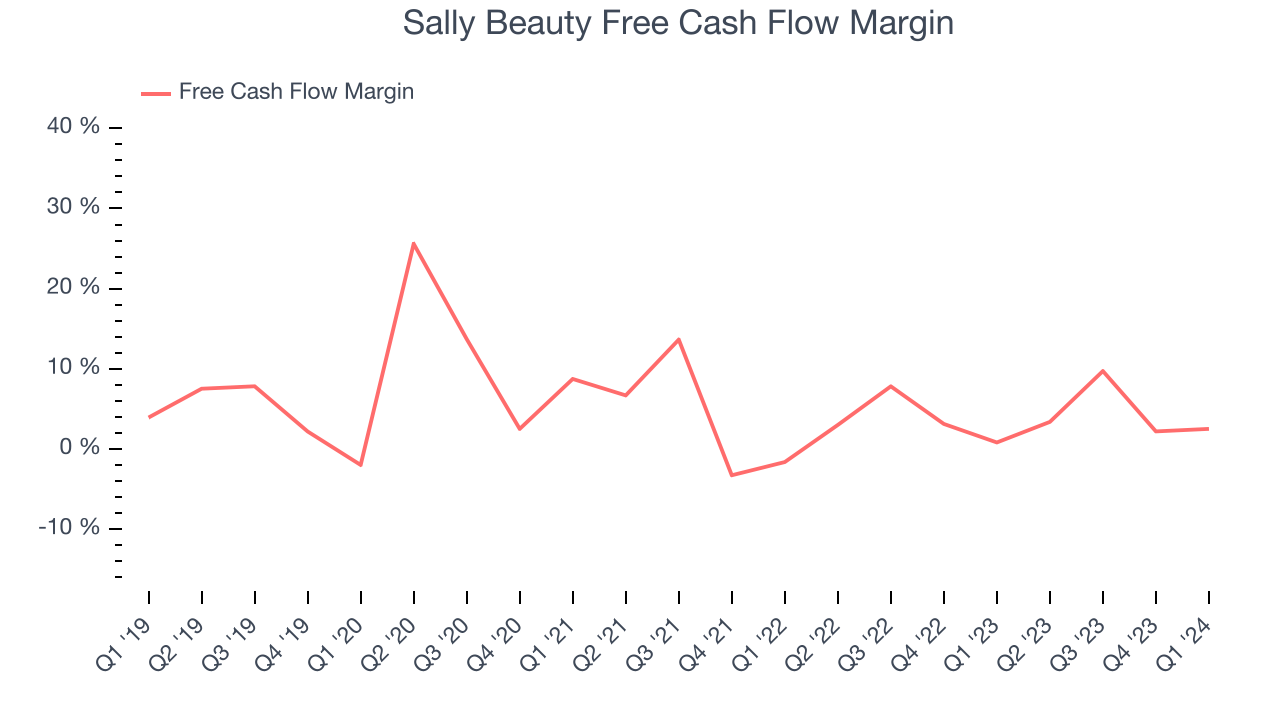
Over the last eight quarters, Sally Beauty has shown solid cash profitability, giving it the flexibility to reinvest or return capital to investors. The company's free cash flow margin has averaged 4.1%, well above the broader consumer retail sector. Furthermore, its margin has been flat, showing that the company's cash flows are relatively stable.
Return on Invested Capital (ROIC)
EPS and free cash flow tell us whether a company was profitable while growing revenue. But was it capital-efficient? A company’s ROIC explains this by showing how much operating profit a company makes compared to how much money the business raised (debt and equity).
Sally Beauty's five-year average ROIC was 13.9%, somewhat low compared to the best retail companies that consistently pump out 25%+. Its returns suggest it historically did a subpar job investing in profitable business initiatives.
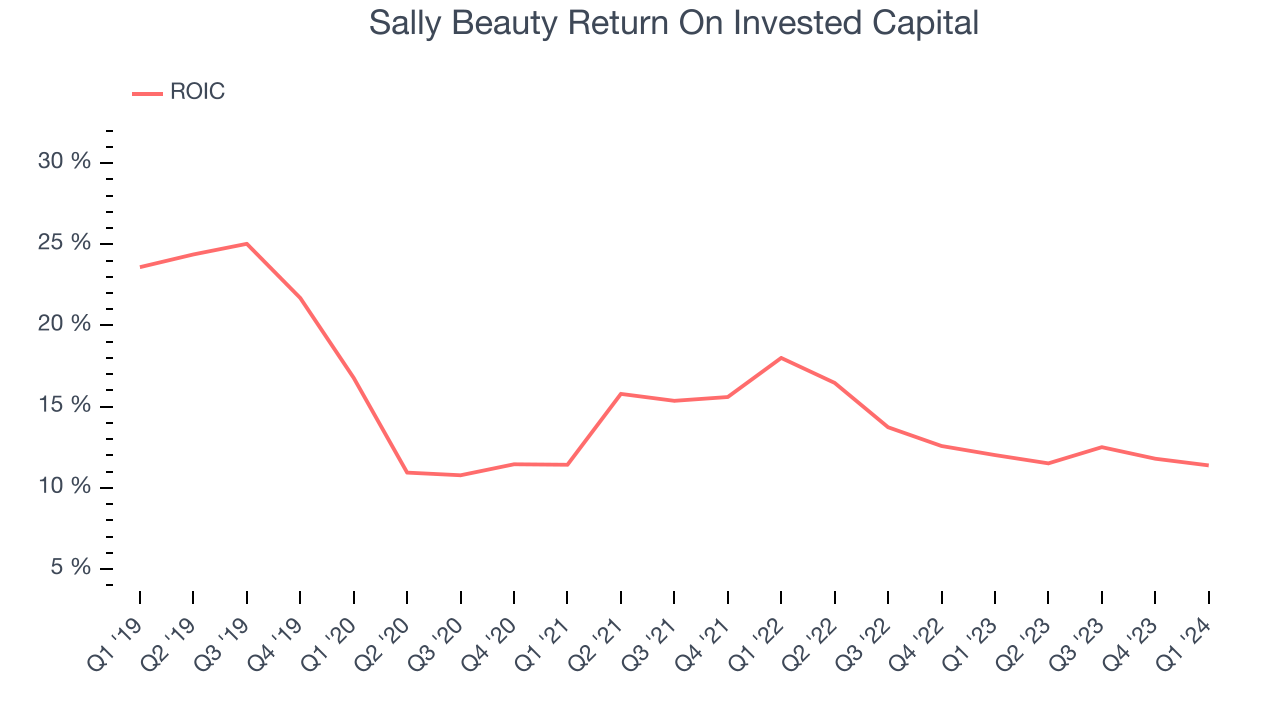
The trend in its ROIC, however, is often what surprises the market and drives the stock price. Unfortunately, Sally Beauty's ROIC averaged 2.4 percentage point decreases over the last few years. Paired with its already low returns, these declines suggest the company's profitable business opportunities are few and far between.
Balance Sheet Risk
Debt is a tool that can boost company returns but presents risks if used irresponsibly.
Sally Beauty reported $97.17 million of cash and $1.64 billion of debt on its balance sheet in the most recent quarter. As investors in high-quality companies, we primarily focus on two things: 1) that a company's debt level isn't too high and 2) that its interest payments are not excessively burdening the business.
With $434.6 million of EBITDA over the last 12 months, we view Sally Beauty's 3.6x net-debt-to-EBITDA ratio as safe. We also see its $35.16 million of annual interest expenses as appropriate. The company's profits give it plenty of breathing room, allowing it to continue investing in new initiatives.
Key Takeaways from Sally Beauty's Q1 Results
We struggled to find many strong positives in these results. Its revenue and EPS missed analysts' expectations. Overall, this was a bad quarter for Sally Beauty. The company is down 4.5% on the results and currently trades at $10.33 per share.
Is Now The Time?
Sally Beauty may have had a tough quarter, but investors should also consider its valuation and business qualities when assessing the investment opportunity.
We cheer for all companies serving consumers, but in the case of Sally Beauty, we'll be cheering from the sidelines. Its revenue has declined over the last five years, but at least growth is expected to increase in the short term. And while its impressive gross margins are a wonderful starting point for the overall profitability of the business, the downside is its declining physical locations suggests its demand is falling. On top of that, its shrinking same-store sales suggests it'll need to change its strategy to succeed.
Sally Beauty's price-to-earnings ratio based on the next 12 months is 5.6x. While there are some things to like about Sally Beauty and its valuation is reasonable, we think there are better opportunities elsewhere in the market right now.
Wall Street analysts covering the company had a one-year price target of $12 per share right before these results (compared to the current share price of $10.33).
To get the best start with StockStory, check out our most recent stock picks, and then sign up to our earnings alerts by adding companies to your watchlist here. We typically have the quarterly earnings results analyzed within seconds of the data being released, and especially for companies reporting pre-market, this often gives investors the chance to react to the results before the market has fully absorbed the information.