
Paint and coating manufacturer Sherwin-Williams (NYSE:SHW) met Wall Street’s revenue expectations in Q3 CY2024, but sales were flat year on year at $6.16 billion. Its non-GAAP profit of $3.37 per share was 4.8% below analysts’ consensus estimates.
Is now the time to buy Sherwin-Williams? Find out by accessing our full research report, it’s free.
Sherwin-Williams (SHW) Q3 CY2024 Highlights:
- Revenue: $6.16 billion vs analyst estimates of $6.20 billion (in line)
- Adjusted EPS: $3.37 vs analyst expectations of $3.54 (4.8% miss)
- EBITDA: $1.28 billion vs analyst estimates of $1.37 billion (6.1% miss)
- Management reiterated its full-year Adjusted EPS guidance of $11.25 at the midpoint
- Gross Margin (GAAP): 49.1%, up from 47.7% in the same quarter last year
- Locations: 5,063 at quarter end, up from 4,978 in the same quarter last year
- Market Capitalization: $96.3 billion
"Sherwin-Williams grew sales, expanded gross margin, and increased EBITDA and adjusted diluted net income per share despite continued choppiness in the demand environment," said President and Chief Executive Officer, Heidi G. Petz.
Company Overview
Widely known for its success in the paint industry, Sherwin-Williams (NYSE:SHW) is a manufacturer of paints, coatings, and related products.
Building Materials
Traditionally, building materials companies have built competitive advantages with economies of scale, brand recognition, and strong relationships with builders and contractors. More recently, advances to address labor availability and job site productivity have spurred innovation. Additionally, companies in the space that can produce more energy-efficient materials have opportunities to take share. However, these companies are at the whim of construction volumes, which tend to be cyclical and can be impacted heavily by economic factors such as interest rates. Additionally, the costs of raw materials can be driven by a myriad of worldwide factors and greatly influence the profitability of building materials companies.
Sales Growth
A company’s long-term performance is an indicator of its overall business quality. While any business can experience short-term success, top-performing ones enjoy sustained growth for multiple years. Unfortunately, Sherwin-Williams’s 5.2% annualized revenue growth over the last five years was tepid. This shows it failed to expand in any major way and is a rough starting point for our analysis.
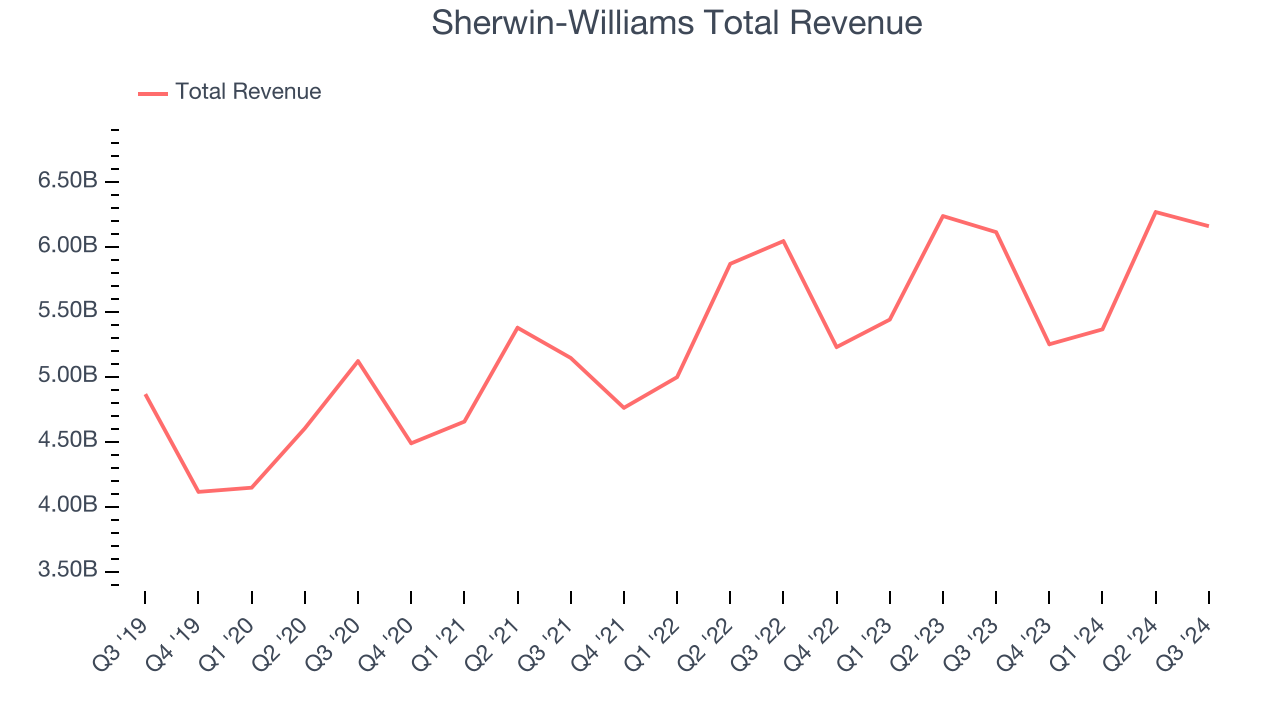
We at StockStory place the most emphasis on long-term growth, but within industrials, a half-decade historical view may miss cycles, industry trends, or a company capitalizing on catalysts such as a new contract win or a successful product line. Sherwin-Williams’s recent history shows its demand slowed as its annualized revenue growth of 3.1% over the last two years is below its five-year trend.
This quarter, Sherwin-Williams’s $6.16 billion of revenue was flat year on year and in line with Wall Street’s estimates.
Looking ahead, sell-side analysts expect revenue to grow 3.8% over the next 12 months, similar to its two-year rate. This projection is underwhelming and indicates the market thinks its newer products and services will not catalyze better top-line performance yet.
Today’s young investors won’t have read the timeless lessons in Gorilla Game: Picking Winners In High Technology because it was written more than 20 years ago when Microsoft and Apple were first establishing their supremacy. But if we apply the same principles, then enterprise software stocks leveraging their own generative AI capabilities may well be the Gorillas of the future. So, in that spirit, we are excited to present our Special Free Report on a profitable, fast-growing enterprise software stock that is already riding the automation wave and looking to catch the generative AI next.
Operating Margin
Sherwin-Williams has been an optimally-run company over the last five years. It was one of the more profitable businesses in the industrials sector, boasting an average operating margin of 14.7%. This result isn’t surprising as its high gross margin gives it a favorable starting point.
Looking at the trend in its profitability, Sherwin-Williams’s annual operating margin rose by 1.1 percentage points over the last five years, showing its efficiency has improved.
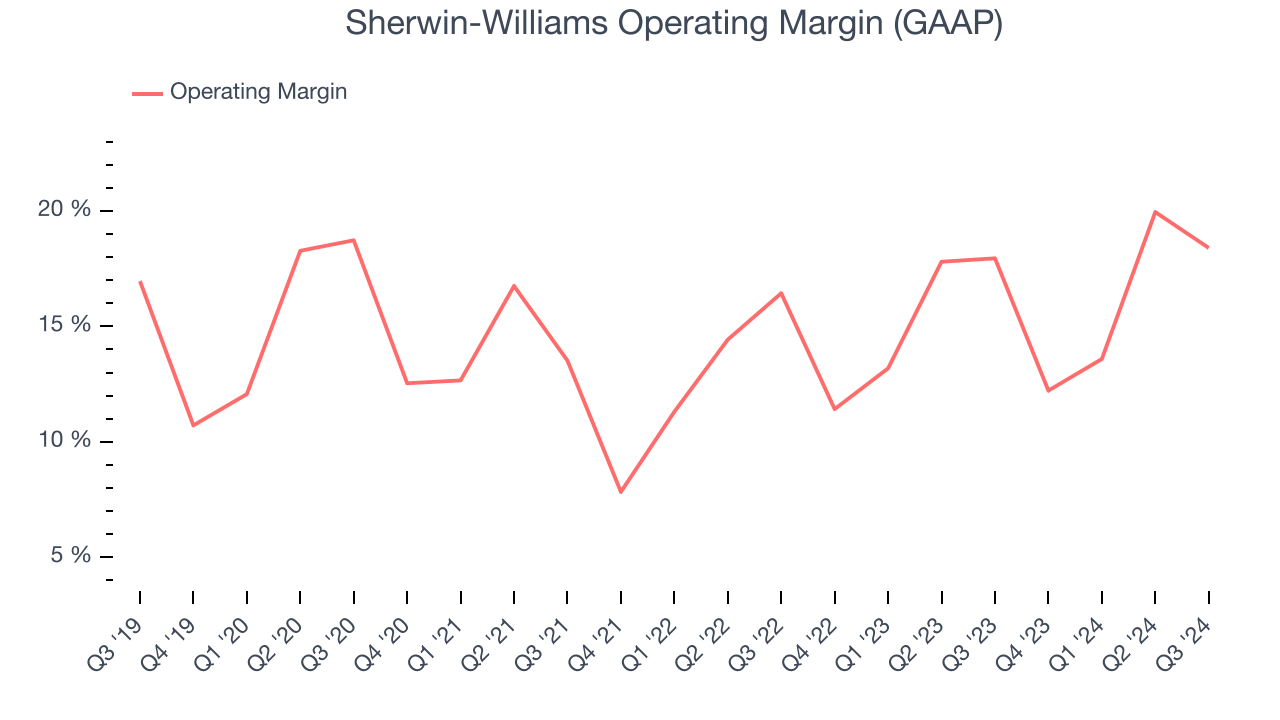
In Q3, Sherwin-Williams generated an operating profit margin of 18.4%, in line with the same quarter last year. This indicates the company’s cost structure has recently been stable.
Earnings Per Share
Analyzing long-term revenue trends tells us about a company’s historical growth, but the long-term change in its earnings per share (EPS) points to the profitability of that growth – for example, a company could inflate its sales through excessive spending on advertising and promotions.
Sherwin-Williams’s EPS grew at a solid 10.2% compounded annual growth rate over the last five years, higher than its 5.2% annualized revenue growth. This tells us the company became more profitable as it expanded.
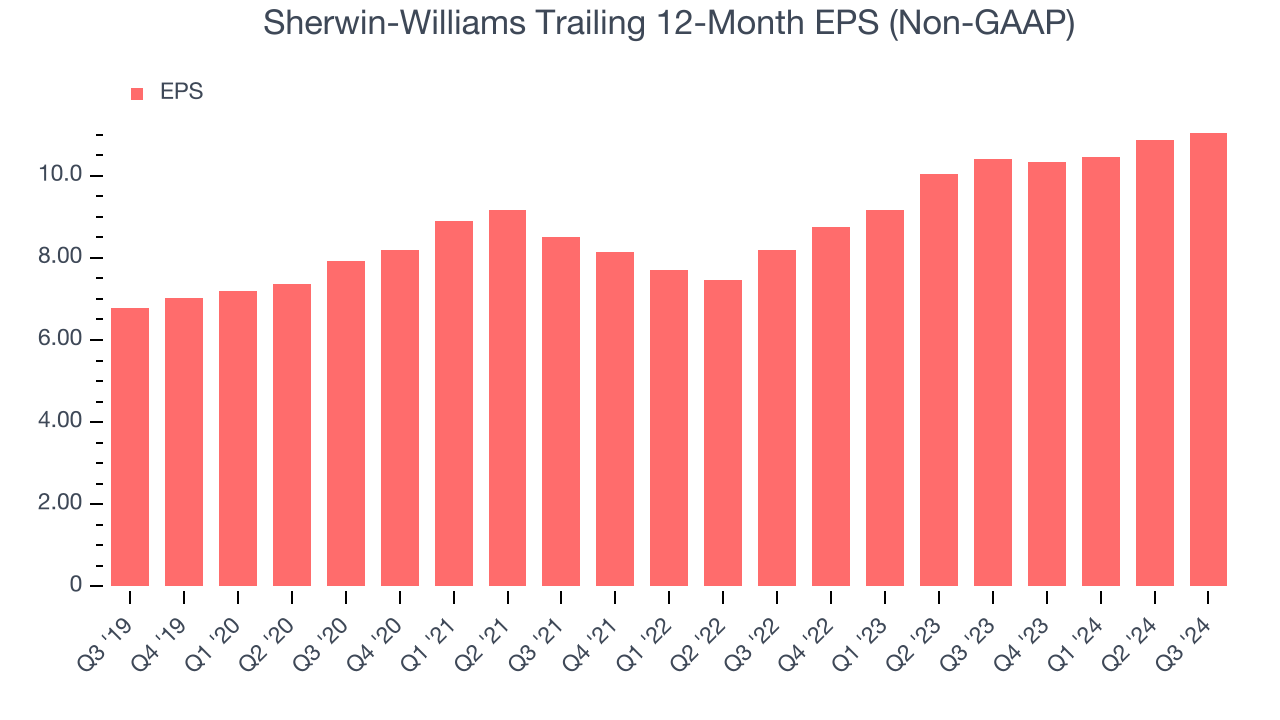
Diving into the nuances of Sherwin-Williams’s earnings can give us a better understanding of its performance. As we mentioned earlier, Sherwin-Williams’s operating margin was flat this quarter but expanded by 1.1 percentage points over the last five years. On top of that, its share count shrank by 9.6%. These are positive signs for shareholders because improving profitability and share buybacks turbocharge EPS growth relative to revenue growth. 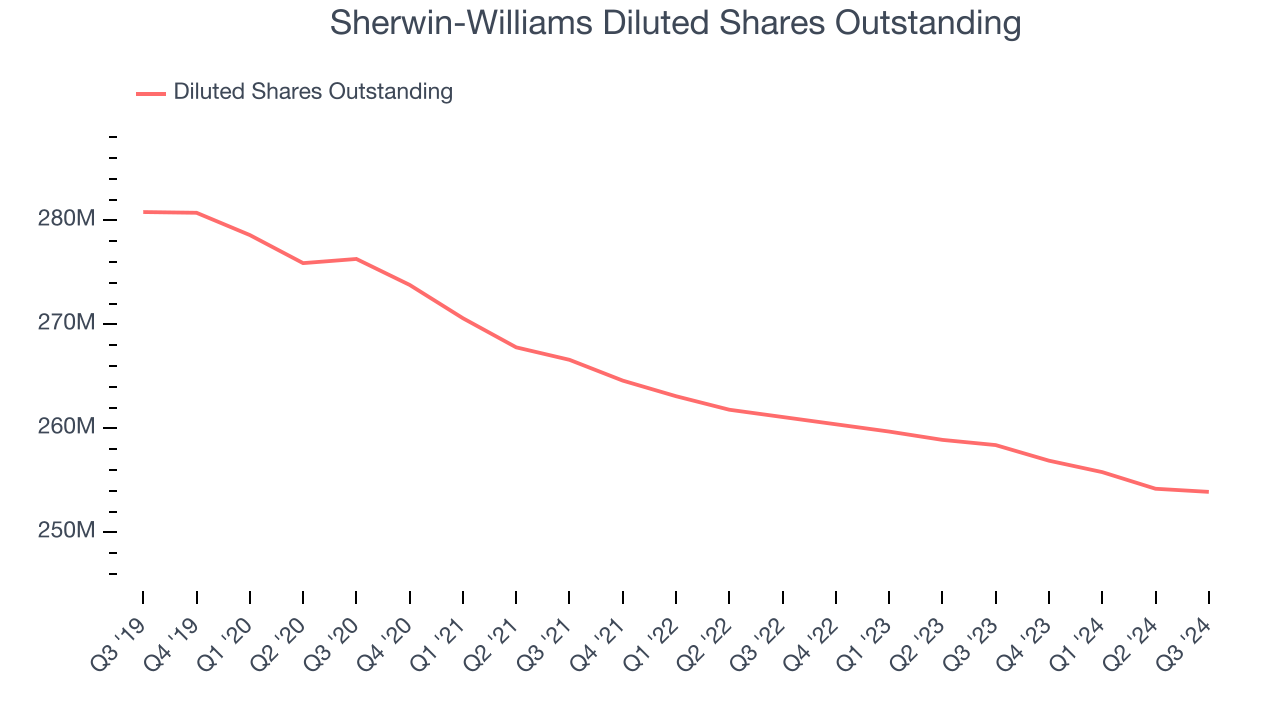
Like with revenue, we analyze EPS over a more recent period because it can give insight into an emerging theme or development for the business. For Sherwin-Williams, its two-year annual EPS growth of 16.1% was higher than its five-year trend. We love it when earnings growth accelerates, especially when it accelerates off an already high base.
In Q3, Sherwin-Williams reported EPS at $3.37, up from $3.20 in the same quarter last year. Despite growing year on year, this print missed analysts’ estimates, but we care more about long-term EPS growth than short-term movements. Over the next 12 months, Wall Street expects Sherwin-Williams’s full-year EPS of $11.05 to grow by 13.9%.
Key Takeaways from Sherwin-Williams’s Q3 Results
We struggled to find many strong positives in these results. Its EBITDA missed and its EPS fell short of Wall Street’s estimates. Overall, this quarter could have been better. The stock traded down 7.8% to $351.99 immediately after reporting.
Sherwin-Williams may have had a tough quarter, but does that actually create an opportunity to invest right now?What happened in the latest quarter matters, but not as much as longer-term business quality and valuation, when deciding whether to invest in this stock.We cover that in our actionable full research report which you can read here, it’s free.