
Amusement park operator Six Flags (NYSE:SIX) fell short of analysts' expectations in Q1 CY2024, with revenue down 6.3% year on year to $133.3 million. It made a GAAP loss of $0.98 per share, down from its loss of $0.84 per share in the same quarter last year.
Six Flags (SIX) Q1 CY2024 Highlights:
- Revenue: $133.3 million vs analyst estimates of $136.7 million (2.5% miss)
- EPS: -$0.98 vs analyst expectations of -$0.91 (7.2% miss)
- Gross Margin (GAAP): 6.2%, down from 16.6% in the same quarter last year
- Visitors: 1.7 million
- Market Capitalization: $2.11 billion
Sporting the fastest rollercoaster in the United States, Six Flags (NYSE:SIX) is a regional theme park operator offering thrilling rides, entertainment, and family-friendly attractions.
Six Flags's first location was in Texas, and its name was inspired by the state's six different flags that flew over its history. Its founders envisioned a venue that seamlessly blends historical education with vibrant entertainment.
In addition to its roller coasters and water slides, each park offers a blend of live performances, themed areas, seasonal events, and interactive attractions. This range ensures visitors of all ages can find something fun to do.
Six Flags's revenue is derived from ticket sales, season passes, and in-park purchases for food, beverages, and other amenities. Management has especially focused on season passes as they provide recurring revenue, and more visits typically lead to more purchases of in-park goods that command premium prices.
In November 2023, Six Flags announced it would merge with Cedar Fair (NYSE:FUN), another scaled theme park operator. According to the press release, Six Flags shareholders will own ~48.8% of the combined company while Cedar Fair shareholders will own ~51.2%. The combined entity will be renamed to Six Flags and will trade under the ticker symbol NYSE:FUN. The deal is expected to close in June 2024 and was valued at $8 billion.
Leisure Facilities
Leisure facilities companies often sell experiences rather than tangible products, and in the last decade-plus, consumers have slowly shifted their spending from "things" to "experiences". Leisure facilities seek to benefit but must innovate to do so because of the industry's high competition and capital intensity.
Competitors of Six Flags (NYSE:SIX) offering amusement park experiences include SeaWorld (NYSE:SEAS) and Disney (NYSE:DIS).Sales Growth
Reviewing a company's long-term performance can reveal insights into its business quality. Any business can have short-term success, but a top-tier one sustains growth for years. Six Flags's revenue was flat over the last five years.
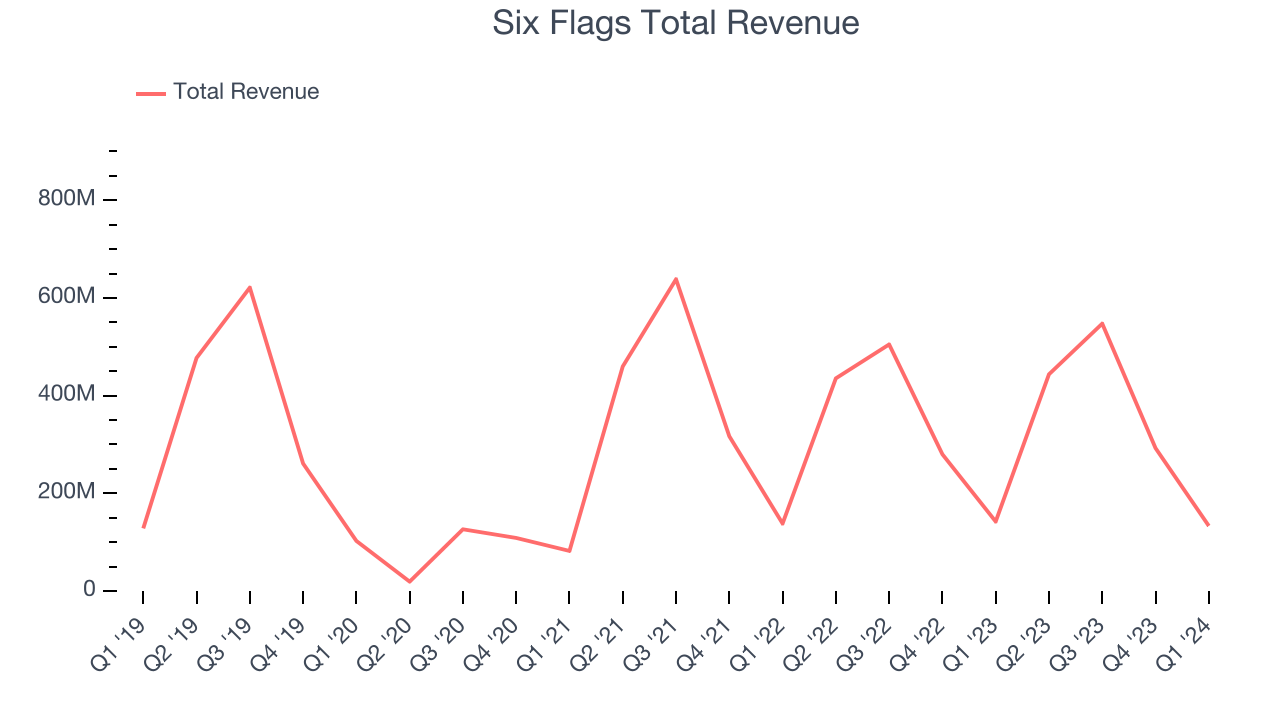
Within consumer discretionary, a long-term historical view may miss a company riding a successful new product or emerging trend. That's why we also follow short-term performance. Six Flags's recent history shows a reversal from its five-year trend as its revenue has shown annualized declines of 4.5% over the last two years.
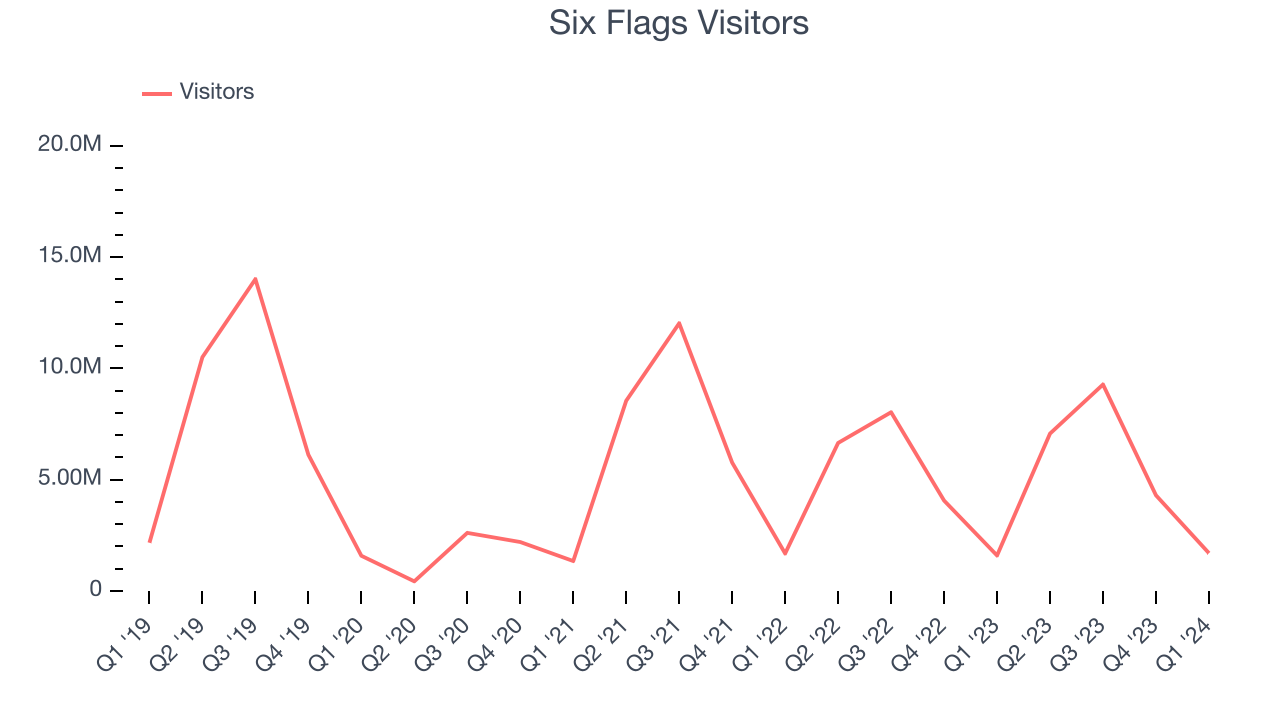
We can better understand the company's revenue dynamics by analyzing its number of visitors, which reached 1.7 million in the latest quarter. Over the last two years, Six Flags's visitors averaged 7% year-on-year declines. Because this number is lower than its revenue growth during the same period, we can see the company's monetization of its consumers has risen.
This quarter, Six Flags missed Wall Street's estimates and reported a rather uninspiring 6.3% year-on-year revenue decline, generating $133.3 million of revenue. Looking ahead, Wall Street expects sales to grow 6.3% over the next 12 months, an acceleration from this quarter.
Operating Margin
Operating margin is an important measure of profitability. It’s the portion of revenue left after accounting for all core expenses–everything from the cost of goods sold to advertising and wages. Operating margin is also useful for comparing profitability across companies with different levels of debt and tax rates because it excludes interest and taxes.
Six Flags has been a well-oiled machine over the last two years. It's demonstrated elite profitability for a consumer discretionary business, boasting an average operating margin of 22.7%.
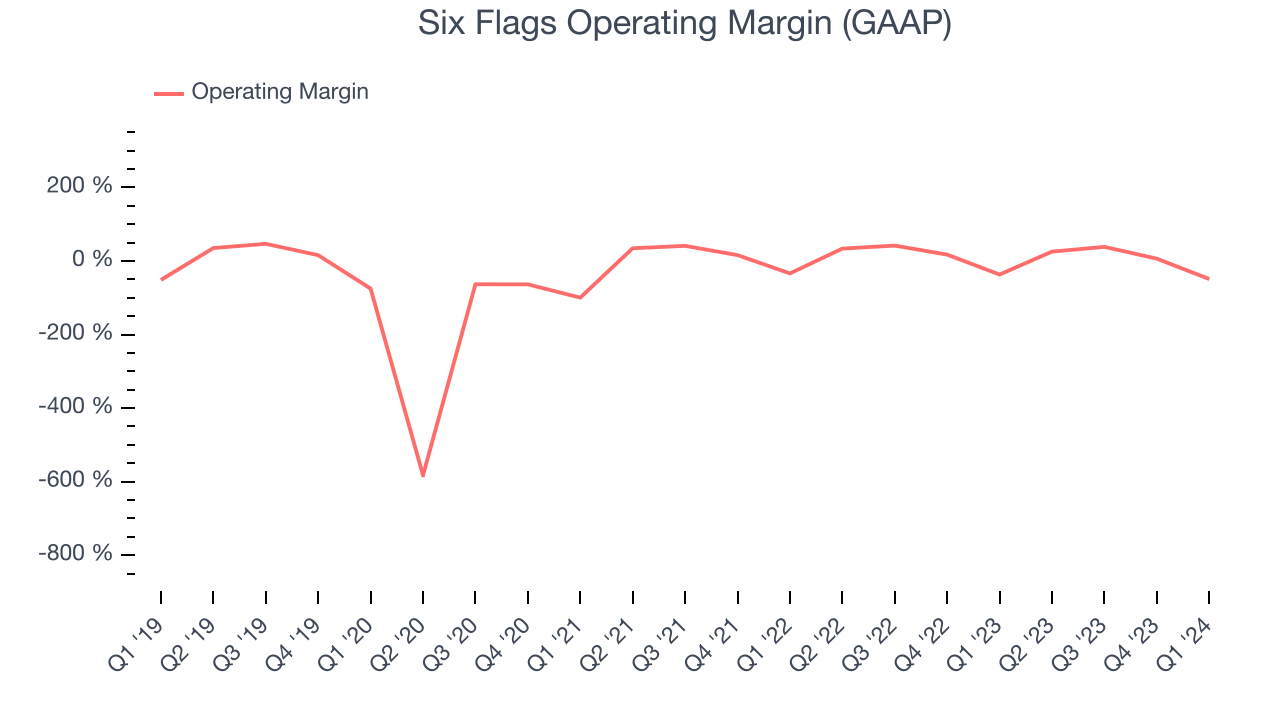
In Q1, Six Flags generated an operating profit margin of negative 48.9%, down 12.2 percentage points year on year.
Over the next 12 months, Wall Street expects Six Flags to become more profitable. Analysts are expecting the company’s LTM operating margin of 19.6% to rise to 26.9%.
EPS
Analyzing long-term revenue trends tells us about a company's historical growth, but the long-term change in its earnings per share (EPS) points to the profitability and efficiency of that growth–for example, a company could inflate its sales through excessive spending on advertising and promotions. 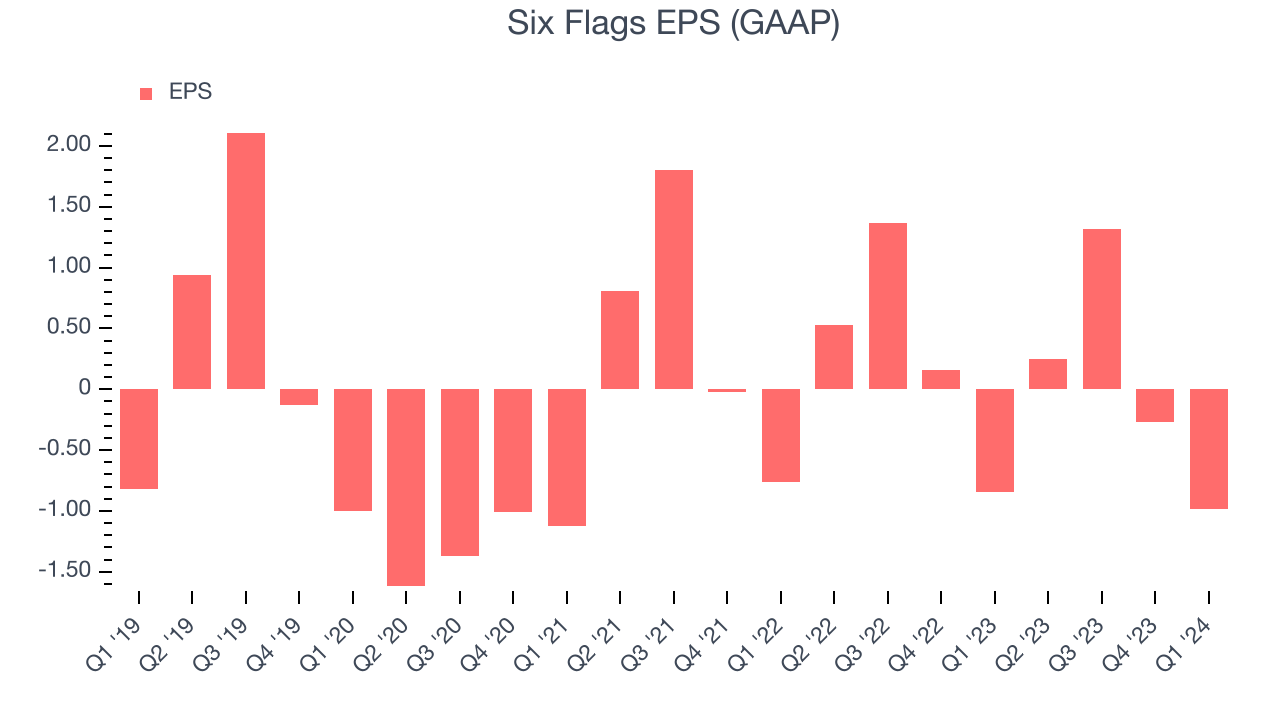
Over the last five years, Six Flags's EPS dropped 377%, translating into 36.7% annualized declines. Thankfully, Six Flags has bucked its trend as of late, growing its EPS over the last three years. We'll see if the company's growth is sustainable.
In Q1, Six Flags reported EPS at negative $0.98, down from negative $0.84 in the same quarter last year. This print unfortunately missed analysts' estimates. Over the next 12 months, Wall Street expects Six Flags to grow its earnings. Analysts are projecting its LTM EPS of $0.32 to climb by 459% to $1.79.
Return on Invested Capital (ROIC)
EPS and free cash flow tell us whether a company was profitable while growing revenue. But was it capital-efficient? Enter ROIC, a metric showing how much operating profit a company generates relative to how much money the business raised (debt and equity).
Six Flags's five-year average return on invested capital was 15.5%, slightly better than the broader sector. Just as you’d like your investment dollars to generate returns, Six Flags's invested capital has produced decent profits.
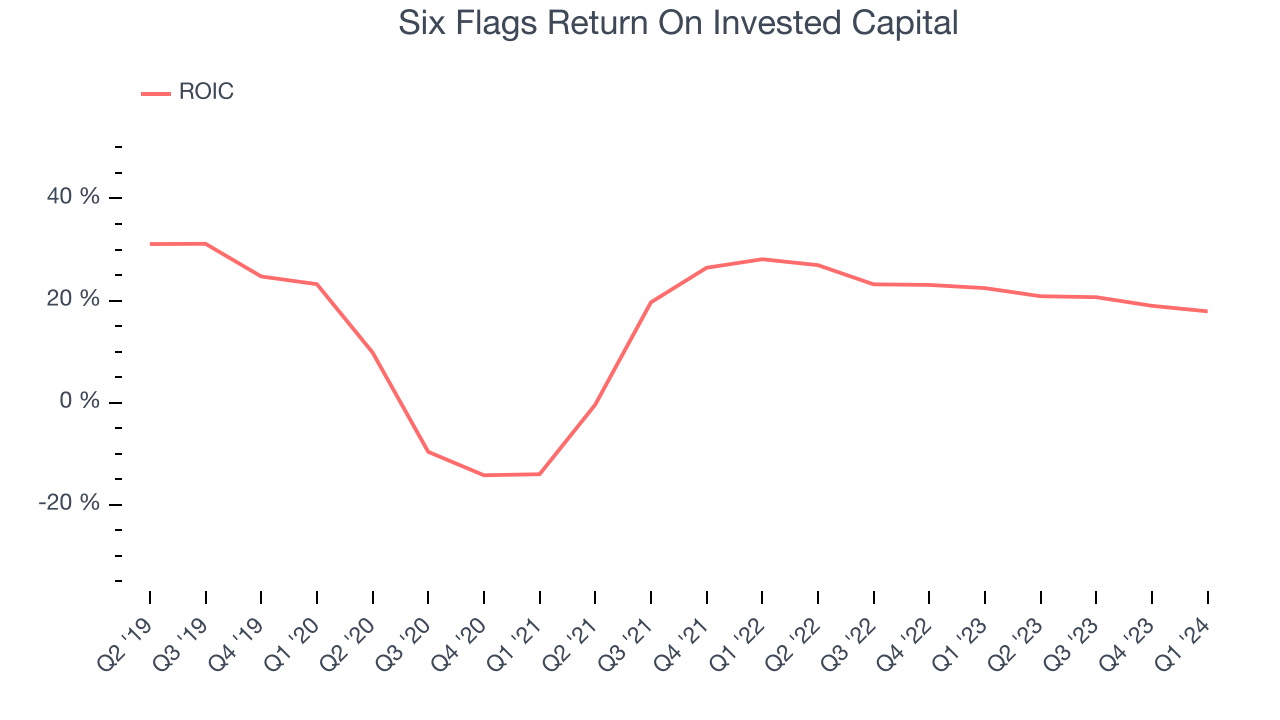
The trend in its ROIC, however, is often what surprises the market and drives the stock price. Over the last few years, Six Flags's ROIC has significantly increased. This is a good sign, and we hope the company can continue improving.
Balance Sheet Risk
Debt is a tool that can boost company returns but presents risks if used irresponsibly.
Six Flags's $2.60 billion of debt exceeds the $60.7 million of cash on its balance sheet. Furthermore, its 6x net-debt-to-EBITDA ratio (based on its EBITDA of $452.9 million over the last 12 months) shows the company is overleveraged.
At this level of debt, incremental borrowing becomes increasingly expensive and credit agencies could downgrade the company’s rating if profitability falls. Six Flags could also be backed into a corner if the market turns unexpectedly – a situation we seek to avoid as investors in high-quality companies.
We hope Six Flags can improve its balance sheet and remain cautious until it increases its profitability or reduces its debt.
Key Takeaways from Six Flags's Q1 Results
It encouraging to see Six Flags narrowly top analysts' visitor expectations this quarter. On the other hand, its revenue and EPS fell short of Wall Street's estimates. Overall, this was a mediocre quarter for Six Flags. The stock is flat after reporting and currently trades at $24.98 per share.
Is Now The Time?
Six Flags may have had a tough quarter, but investors should also consider its valuation and business qualities when assessing the investment opportunity.
We cheer for all companies serving consumers, but in the case of Six Flags, we'll be cheering from the sidelines. Its revenue has declined over the last five years, but at least growth is expected to increase in the short term. And while its projected EPS for the next year implies the company's fundamentals will improve, the downside is its number of visitors has been disappointing. On top of that, its declining EPS over the last five years makes it hard to trust.
Six Flags's price-to-earnings ratio based on the next 12 months is 14.4x. While there are some things to like about Six Flags and its valuation is reasonable, we think there are better opportunities elsewhere in the market right now.
Wall Street analysts covering the company had a one-year price target of $31.09 per share right before these results (compared to the current share price of $24.98).
To get the best start with StockStory, check out our most recent stock picks, and then sign up for our earnings alerts by adding companies to your watchlist here. We typically have the quarterly earnings results analyzed within seconds of the data being released, and especially for companies reporting pre-market, this often gives investors the chance to react to the results before the market has fully absorbed the information.