
Amusement park operator Six Flags (NYSE:SIX) missed analysts' expectations in Q4 FY2023, with revenue up 4.5% year on year to $292.6 million. It made a GAAP loss of $0.27 per share, down from its profit of $0.16 per share in the same quarter last year.
Six Flags (SIX) Q4 FY2023 Highlights:
- Revenue: $292.6 million vs analyst estimates of $297.5 million (1.7% miss)
- EPS: -$0.27 vs analyst estimates of $0.27 (-$0.54 miss)
- Free Cash Flow was -$51.23 million, down from $120.4 million in the previous quarter
- Gross Margin (GAAP): 46.4%, down from 48.7% in the same quarter last year
- Visitors: 4.3 million
- Market Capitalization: $2.06 billion
Sporting the fastest rollercoaster in the United States, Six Flags (NYSE:SIX) is a regional theme park operator offering thrilling rides, entertainment, and family-friendly attractions.
Six Flags's first location was in Texas, and its name was inspired by the state's six different flags that flew over its history. Its founders envisioned a venue that seamlessly blends historical education with vibrant entertainment.
In addition to its roller coasters and water slides, each park offers a blend of live performances, themed areas, seasonal events, and interactive attractions. This range ensures visitors of all ages can find something fun to do.
Six Flags's revenue is derived from ticket sales, season passes, and in-park purchases for food, beverages, and other amenities. Management has especially focused on season passes as they provide recurring revenue, and more visits typically lead to more purchases of in-park goods that command premium prices.
Leisure Facilities
Leisure facilities companies often sell experiences rather than tangible products, and in the last decade-plus, consumers have slowly shifted their spending from "things" to "experiences". Leisure facilities seek to benefit but must innovate to do so because of the industry's high competition and capital intensity.
Competitors of Six Flags (NYSE:SIX) offering amusement park experiences include SeaWorld (NYSE:SEAS) and Disney (NYSE:DIS).
Sales Growth
Reviewing a company's long-term performance can reveal insights into its business quality. Any business can have short-term success, but a top-tier one sustains growth for years. Six Flags's revenue was flat over the last five years. 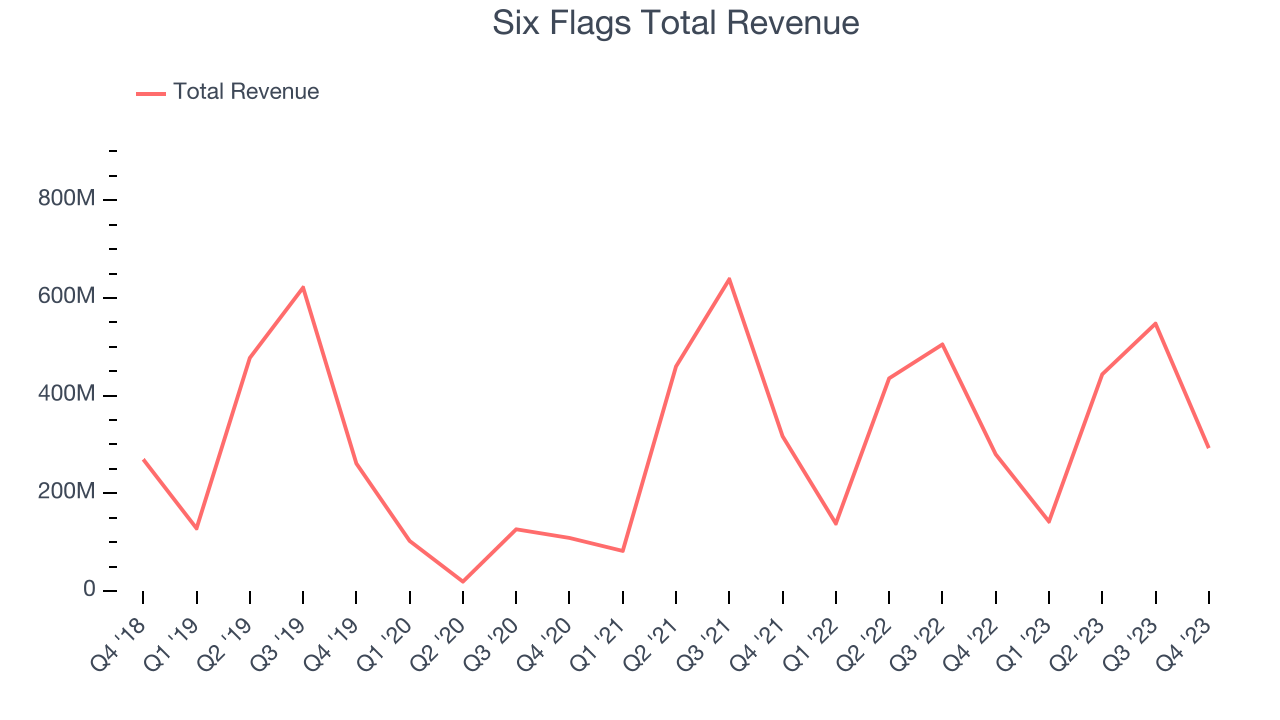 Within consumer discretionary, product cycles are short and revenue can be hit-driven due to rapidly changing trends. That's why we also follow short-term performance. Six Flags's recent history shows a reversal from its five-year trend as its revenue has shown annualized declines of 2.4% over the last two years.
We can better understand the company's revenue dynamics by analyzing its number of visitors, which reached 4.3 million in the latest quarter. Over the last two years, Six Flags's visitors averaged 4.7% year-on-year declines. Because this number is lower than its revenue growth during the same period, we can see the company's monetization has risen. 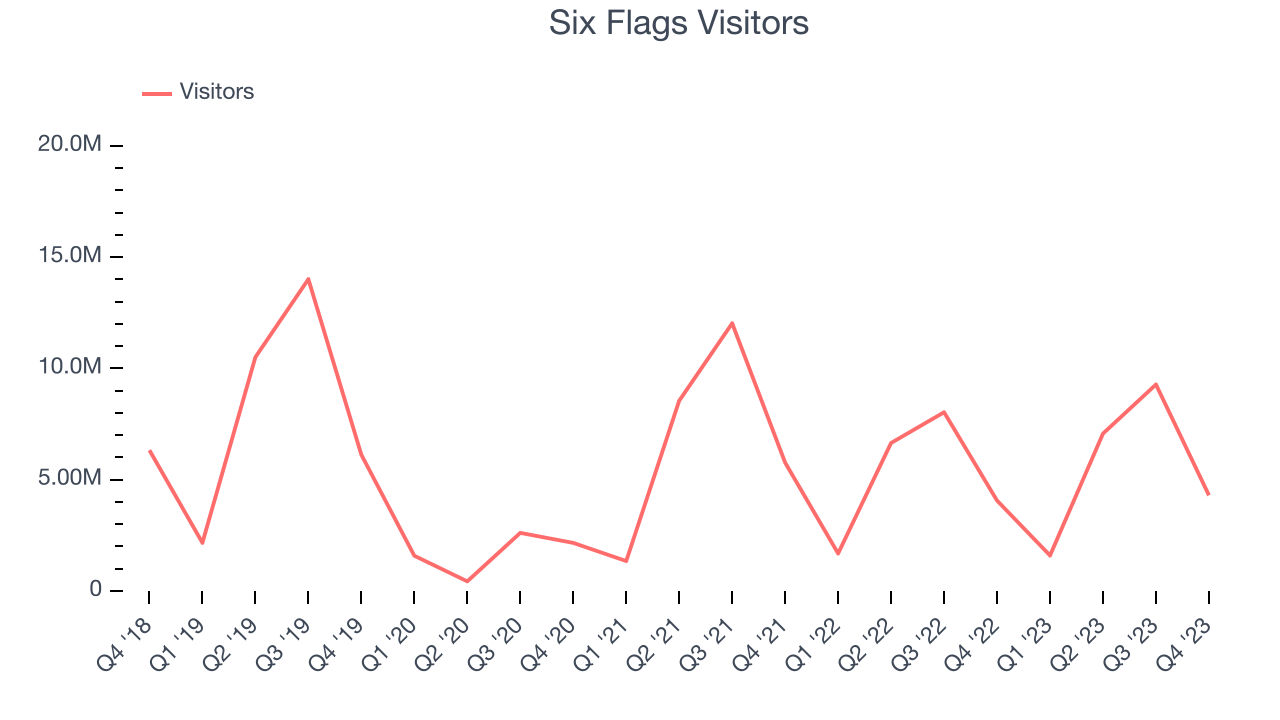
This quarter, Six Flags's revenue grew 4.5% year on year to $292.6 million, falling short of Wall Street's estimates. Looking ahead, Wall Street expects sales to grow 6.1% over the next 12 months, an acceleration from this quarter.
Operating Margin
Operating margin is a key measure of profitability. Think of it as net income–the bottom line–excluding the impact of taxes and interest on debt, which are less connected to business fundamentals.
Six Flags has been a well-oiled machine over the last two years. It's demonstrated elite profitability for a consumer discretionary business, boasting an average operating margin of 23.5%.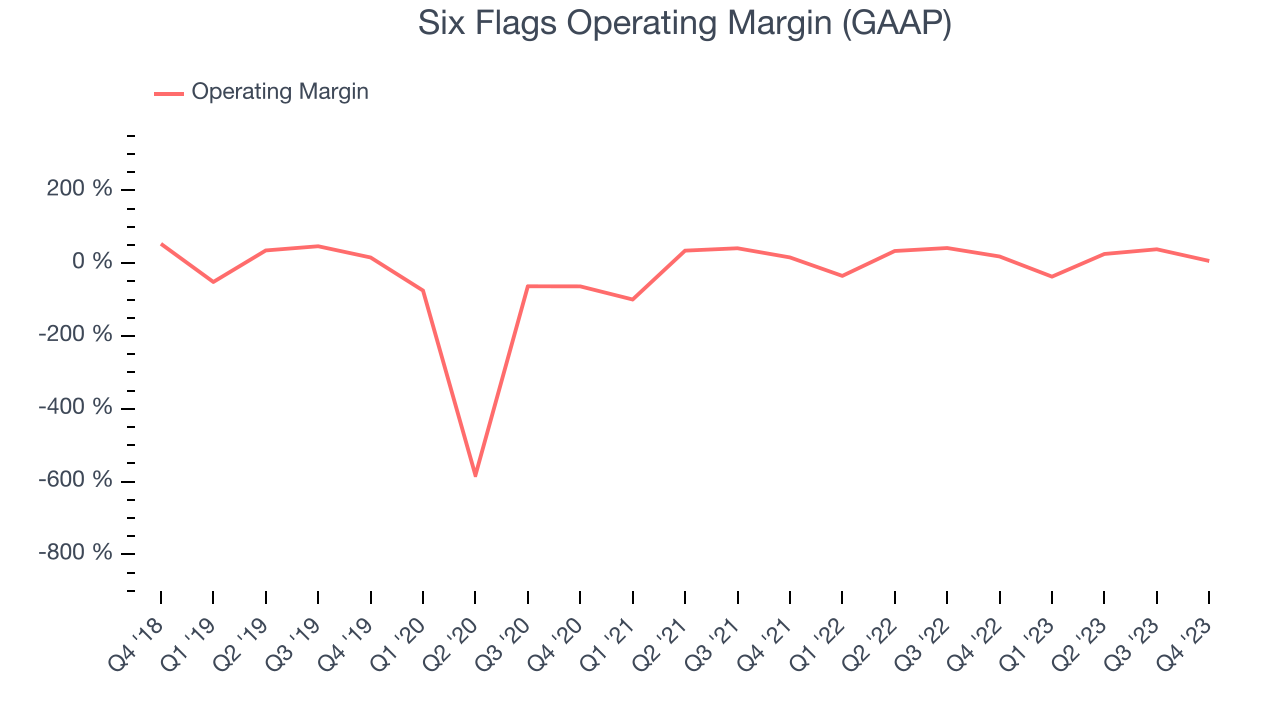
This quarter, Six Flags generated an operating profit margin of 6.4%, down 12.3 percentage points year on year.
Over the next 12 months, Wall Street expects Six Flags to become more profitable. Analysts are expecting the company’s LTM operating margin of 20.4% to rise to 27.7%.EPS
Analyzing long-term revenue trends tells us about a company's historical growth, but the long-term change in its earnings per share (EPS) points to the profitability and efficiency of that growth–for example, a company could inflate its sales through excessive spending on advertising and promotions. 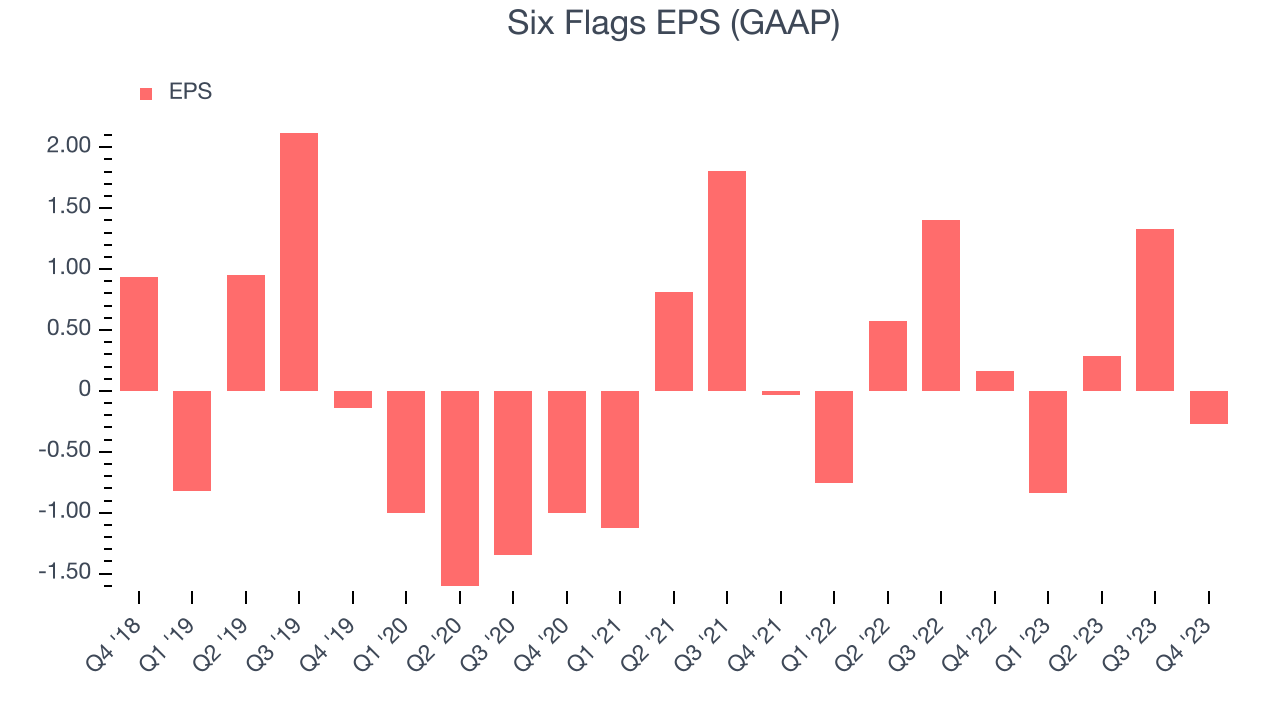
Over the last five years, Six Flags's EPS dropped 143%, translating into 19.4% annualized declines. Thankfully, Six Flags has bucked its trend as of late, growing its EPS over the last three years. We'll see if the company's growth is sustainable.
In Q4, Six Flags reported EPS at negative $0.27, down from $0.16 in the same quarter a year ago. This print unfortunately missed analysts' estimates. Over the next 12 months, Wall Street expects Six Flags to grow its earnings. Analysts are projecting its LTM EPS of $0.50 to climb by 313% to $1.88.
Cash Is King
Although earnings are undoubtedly valuable for assessing company performance, we believe cash is king because you can't use accounting profits to pay the bills.
Over the last two years, Six Flags has shown mediocre cash profitability, putting it in a pinch as it gives the company limited opportunities to reinvest, pay down debt, or return capital to shareholders. Its free cash flow margin has averaged 8.6%, subpar for a consumer discretionary business.
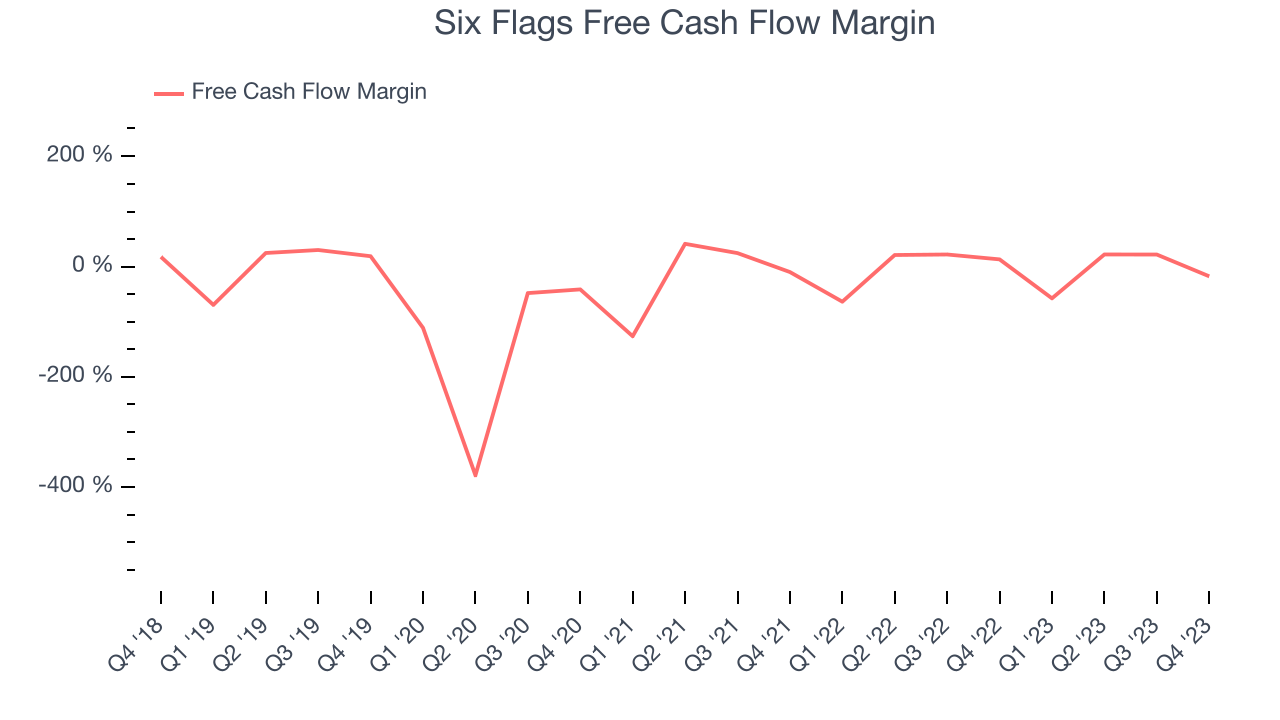
Six Flags burned through $51.23 million of cash in Q4, equivalent to a negative 17.5% margin. This caught our eye as the company shifted from cash flow positive in the same quarter last year to cash flow negative this quarter. Over the next year, analysts predict Six Flags's cash profitability will improve. Their consensus estimates imply its LTM free cash flow margin of 6% will increase to 11.6%.
Return on Invested Capital (ROIC)
EPS and free cash flow tell us whether a company was profitable while growing revenue. But was it capital-efficient? A company’s ROIC explains this by showing how much operating profit a company makes compared to how much money the business raised (debt and equity).
Six Flags's five-year average return on invested capital was 15.8%, slightly better than the broader sector. Just as you’d like your investment dollars to generate returns, Six Flags's invested capital has produced decent profits.
The trend in its ROIC, however, is often what surprises the market and drives the stock price. Over the last two years, Six Flags's ROIC averaged 15.8 percentage point increases each year. This is a good sign and we hope the company can continue improving.
Key Takeaways from Six Flags's Q4 Results
We struggled to find many strong positives in these results. Its revenue, operating margin, and EPS fell short of Wall Street's estimates as it brought in fewer visitors into its parks than expected.
On a side note, Six Flags merged with Cedar Fair (NYSE:FUN), another large regional theme park operator, on November 6th. This is quite exciting as there are only a few public theme park companies, so this is a blockbuster deal in the space.
Despite the flair around the merger, this quarter's results could have been better. The stock is up 1.1% after reporting and currently trades at $24.84 per share.
Is Now The Time?
Six Flags may have had a tough quarter, but investors should also consider its valuation and business qualities when assessing the investment opportunity.
We cheer for all companies serving consumers, but in the case of Six Flags, we'll be cheering from the sidelines. Its revenue has declined over the last five years, but at least growth is expected to increase in the short term. And while its projected EPS for the next year implies the company's fundamentals will improve, the downside is its number of visitors has been disappointing. On top of that, its declining EPS over the last five years makes it hard to trust.
Six Flags's price-to-earnings ratio based on the next 12 months is 13.4x. While the price is reasonable and there are some things to like about Six Flags, we think there are better opportunities elsewhere in the market right now.
Wall Street analysts covering the company had a one-year price target of $30.33 per share right before these results (compared to the current share price of $24.84).
To get the best start with StockStory, check out our most recent stock picks, and then sign up for our earnings alerts by adding companies to your watchlist here. We typically have the quarterly earnings results analyzed within seconds of the data being released, and especially for companies reporting pre-market, this often gives investors the chance to react to the results before the market has fully absorbed the information.