
Beer company Molson Coors (NYSE:TAP) reported results ahead of analysts' expectations in Q1 CY2024, with revenue up 10.7% year on year to $2.60 billion. It made a non-GAAP profit of $0.95 per share, improving from its profit of $0.54 per share in the same quarter last year.
Molson Coors (TAP) Q1 CY2024 Highlights:
- Revenue: $2.60 billion vs analyst estimates of $2.50 billion (3.7% beat)
- EPS (non-GAAP): $0.95 vs analyst estimates of $0.75 (27.3% beat)
- Maintained previously-provided full year guidance for a low single-digit net sales increase and a mid single-digit EPS (non-GAAP) increase compared to 2023
- Gross Margin (GAAP): 37.1%, up from 32.8% in the same quarter last year
- Free Cash Flow was -$189.3 million, down from $300.7 million in the previous quarter
- Sales Volumes were up 5.7% year on year
- Market Capitalization: $13.48 billion
Sporting an impressive roster of iconic beer brands, Molson Coors (NYSE:TAP) is a global brewing giant with a rich history dating back more than two centuries.
The company was founded as “Molson” in 1786, and Molson Coors was established in 2005 when it merged with the Adolph Coors Company, another famous brewer.
Molson Coors combines both companies’ deep legacies of brewing excellence and innovation to form a diverse portfolio of beer brands, including Coors Light, Miller Lite, Blue Moon, and Peroni. These brands span various beer styles, from light lagers to craft-style ales, and appeal to a wide range of consumer preferences.
In recent years, Molson Coors has expanded beyond its core beer business to include non-alcoholic and alternative beverage options. This growth reflects the company's commitment to meeting the changing needs of its customers while maintaining the same dedication to quality and craftsmanship.
With a global presence, Molson Coors serves customers in North America, Europe, Asia, and beyond. It leverages its distribution networks and partnerships to ensure its products reach consumers in various countries, and its global reach helps diversify its revenue streams and reduce dependence on specific markets.
Molson Coors’s products are available in various retail channels, including supermarkets, convenience stores, bars, and restaurants. This widespread distribution enables the company to reach consumers where and how they prefer to purchase beverages.
Beverages and Alcohol
These companies' performance is influenced by brand strength, marketing strategies, and shifts in consumer preferences. Changing consumption patterns are particularly relevant and can be seen in the explosion of alcoholic craft beer drinks or the steady decline of non-alcoholic sugary sodas. Companies that spend on innovation to meet consumers where they are with regards to trends can reap huge demand benefits while those who ignore trends can see stagnant volumes. Finally, with the advent of the social media, the cost of starting a brand from scratch is much lower, meaning that new entrants can chip away at the market shares of established players.
Competitors include Anheuser-Busch Inbev (NYSE:BUD), Boston Beer (NYSE:SAM), and Constellation Brands (NYSE:STZ) along with international companies such as Asahi, Carlsberg, and Heineken.Sales Growth
Molson Coors is one of the larger consumer staples companies and benefits from a well-known brand, giving it customer mindshare and influence over purchasing decisions.
As you can see below, the company's annualized revenue growth rate of 8.2% over the last three years was decent for a consumer staples business.
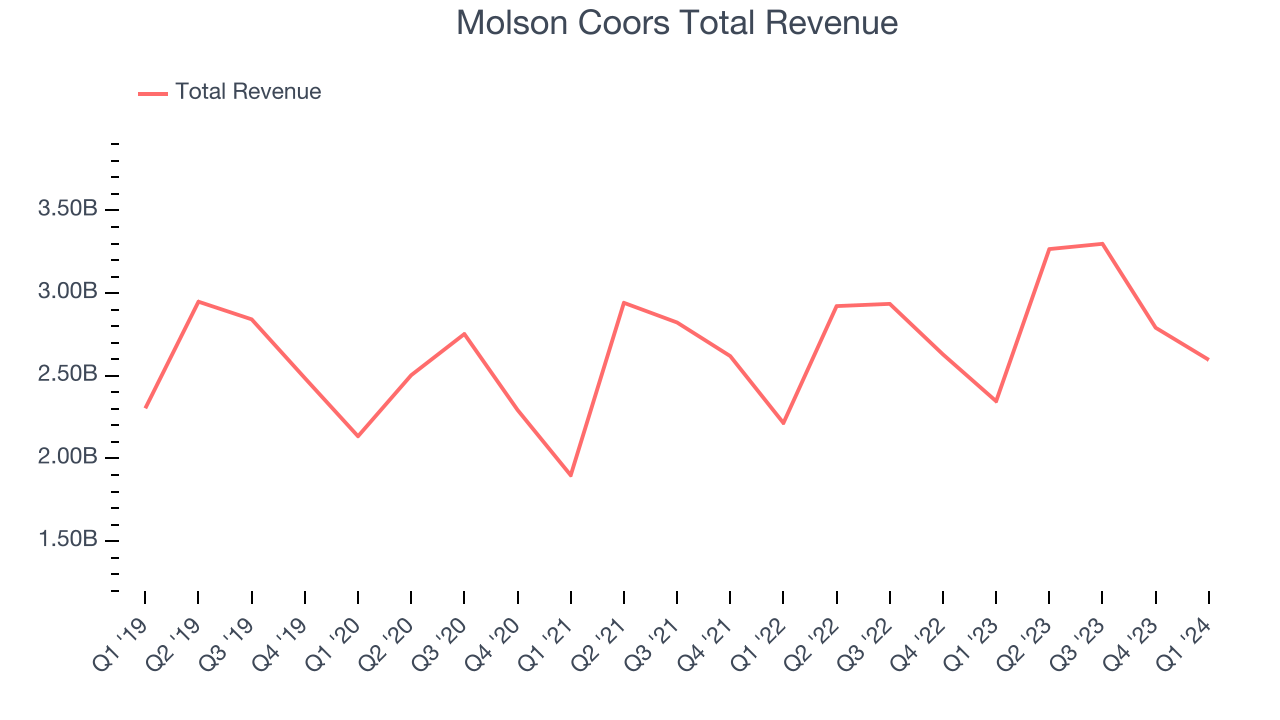
This quarter, Molson Coors reported robust year-on-year revenue growth of 10.7%, and its $2.60 billion in revenue exceeded Wall Street's estimates by 3.7%. Looking ahead, Wall Street expects revenue to remain flat over the next 12 months, a deceleration from this quarter.
Volume Growth
Revenue growth can be broken down into changes in price and volume (the number of units sold). While both are important, volume is the lifeblood of a successful staples business as there’s a ceiling to what consumers will pay for everyday goods; they can always trade down to non-branded products if the branded versions are too expensive.
Molson Coors's quarterly sales volumes have, on average, stayed about the same over the last two years. This stability is normal because the quantity demanded for consumer staples products typically doesn't see much volatility.
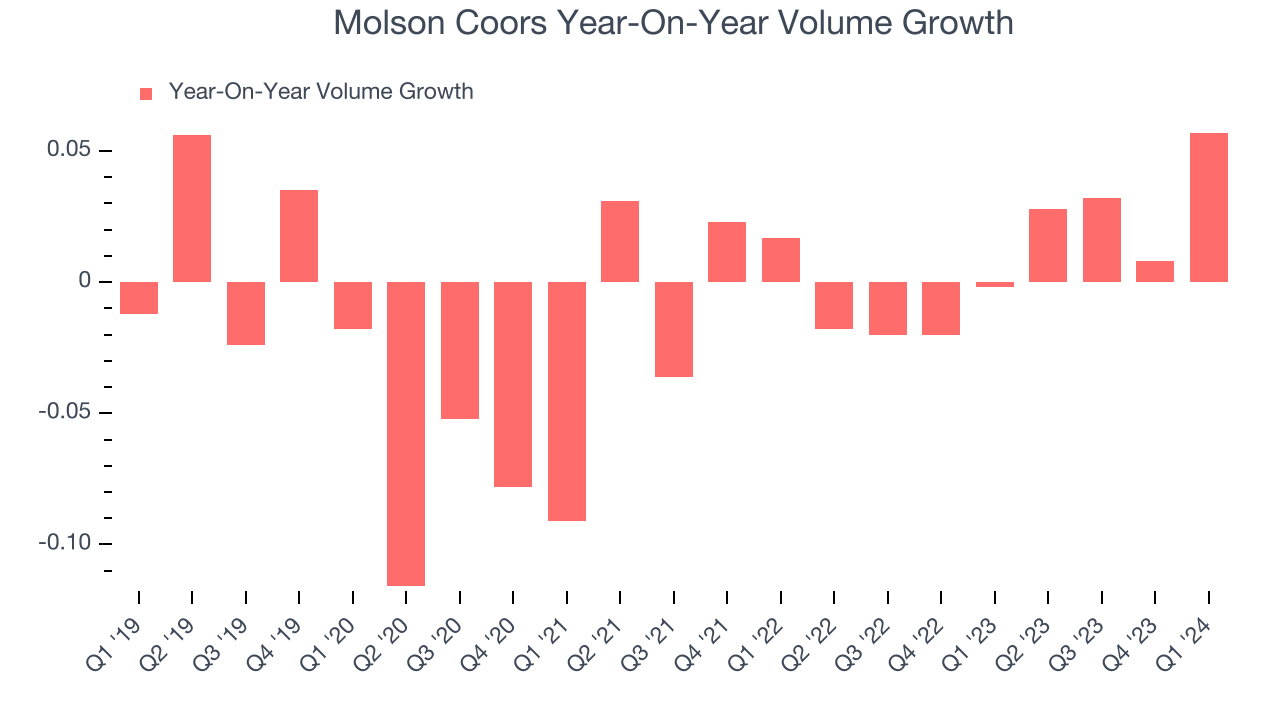
In Molson Coors's Q1 2024, sales volumes jumped 5.7% year on year. This result was a well-appreciated turnaround from the 0.2% year-on-year decline it posted 12 months ago, showing the company is heading in the right direction.
Gross Margin & Pricing Power
All else equal, we prefer higher gross margins. They usually indicate that a company sells more differentiated products and commands stronger pricing power.
Molson Coors's gross profit margin came in at 37.1% this quarter, up 4.3 percentage points year on year. That means for every $1 in revenue, $0.63 went towards paying for raw materials, production of goods, and distribution expenses.
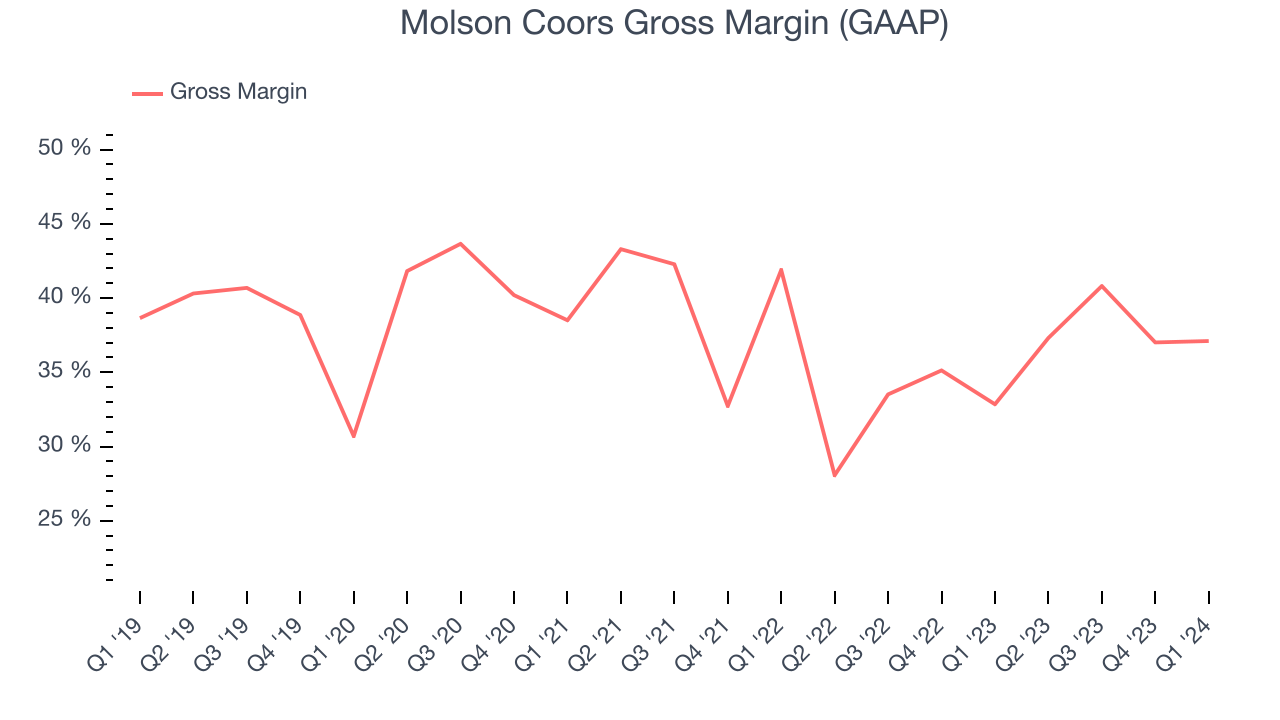
Molson Coors's unit economics are higher than the typical consumer staples company, giving it the flexibility to invest in areas such as marketing and talent to reach more consumers. As you can see above, it's averaged a decent 35.4% gross margin over the last eight quarters. Its margin has also been trending up over the last 12 months, averaging 18.3% year-on-year increases each quarter. If this trend continues, it could suggest a less competitive environment where the company has better pricing power and more favorable input costs (such as raw materials).
Operating Margin
Operating margin is an important measure of profitability accounting for key expenses such as marketing and advertising, IT systems, wages, and other administrative costs.
In Q1, Molson Coors generated an operating profit margin of 12.1%, up 5.4 percentage points year on year. This increase was encouraging, and we can infer Molson Coors was more efficient with its expenses because its operating margin expanded more than its gross margin.
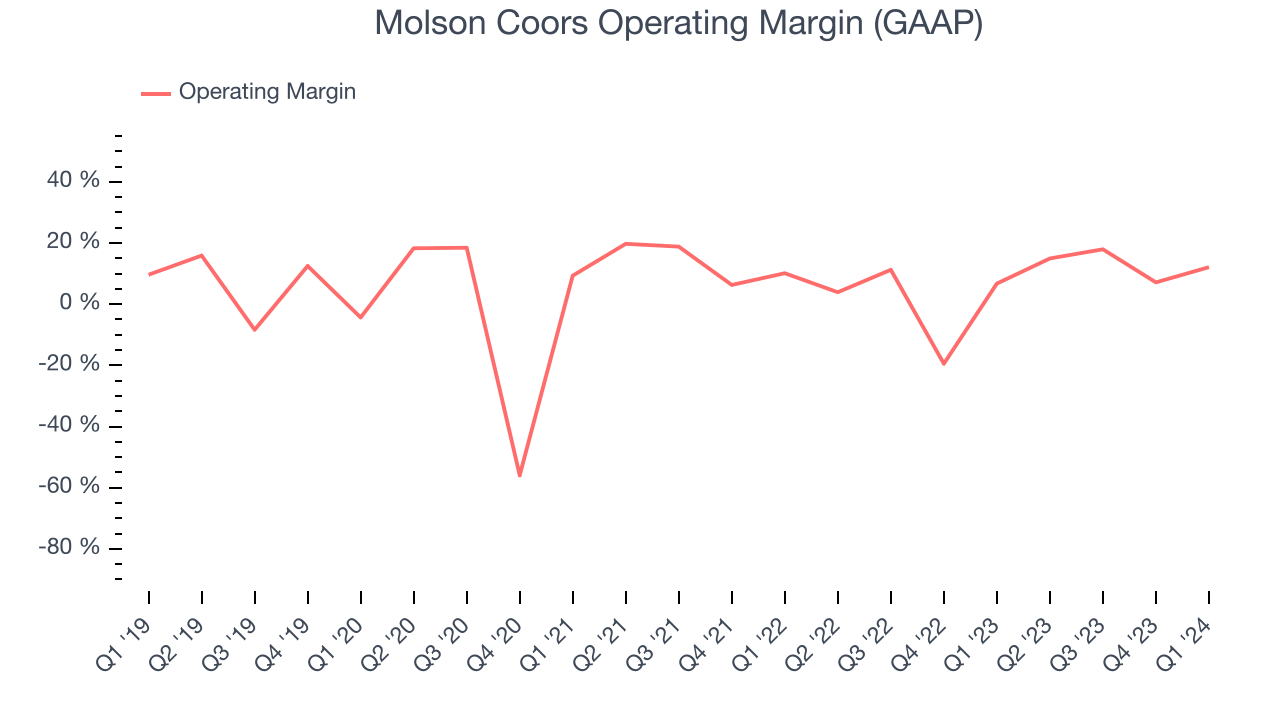 Zooming out, Molson Coors was profitable over the last two years but held back by its large expense base. It's demonstrated mediocre profitability for a consumer staples business, producing an average operating margin of 7.4%. However, Molson Coors's margin has improved by 12.5 percentage points on average over the last year, an encouraging sign for shareholders. The tide could be turning.
EPS
Earnings growth is a critical metric to track, but for long-term shareholders, earnings per share (EPS) is more telling because it accounts for dilution and share repurchases.
In Q1, Molson Coors reported EPS at $0.95, up from $0.54 in the same quarter a year ago. This print beat Wall Street's estimates by 27.3%.
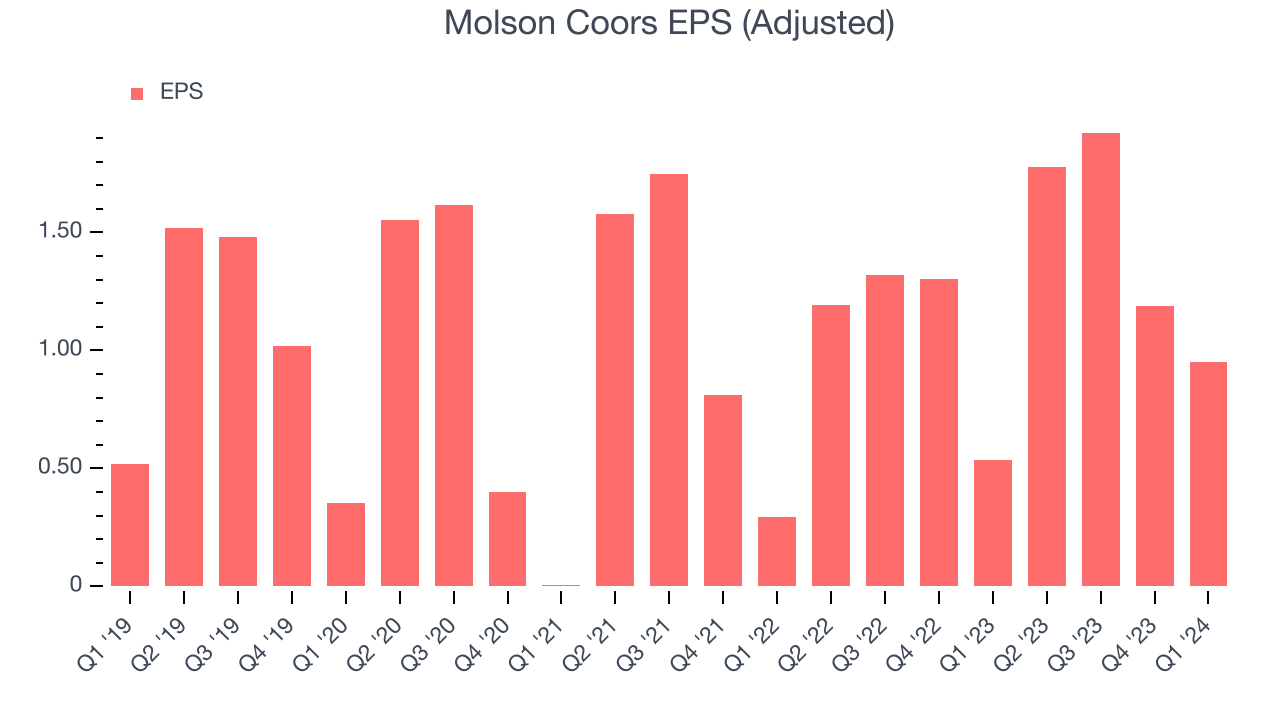
Between FY2021 and FY2024, Molson Coors's EPS grew 63.2%, translating into a remarkable 17.7% compounded annual growth rate. This growth is materially higher than its revenue growth over the same period and was driven by excellent expense management (leading to higher profitability) and share repurchases (leading to higher PER share earnings).
Over the next 12 months, however, Wall Street is projecting an average 2.7% year-on-year decline in EPS.
Cash Is King
Although earnings are undoubtedly valuable for assessing company performance, we believe cash is king because you can't use accounting profits to pay the bills.
Molson Coors burned through $189.3 million of cash in Q1, representing a negative 7.3% free cash flow margin. The company reduced its cash burn by 9.2% year on year.
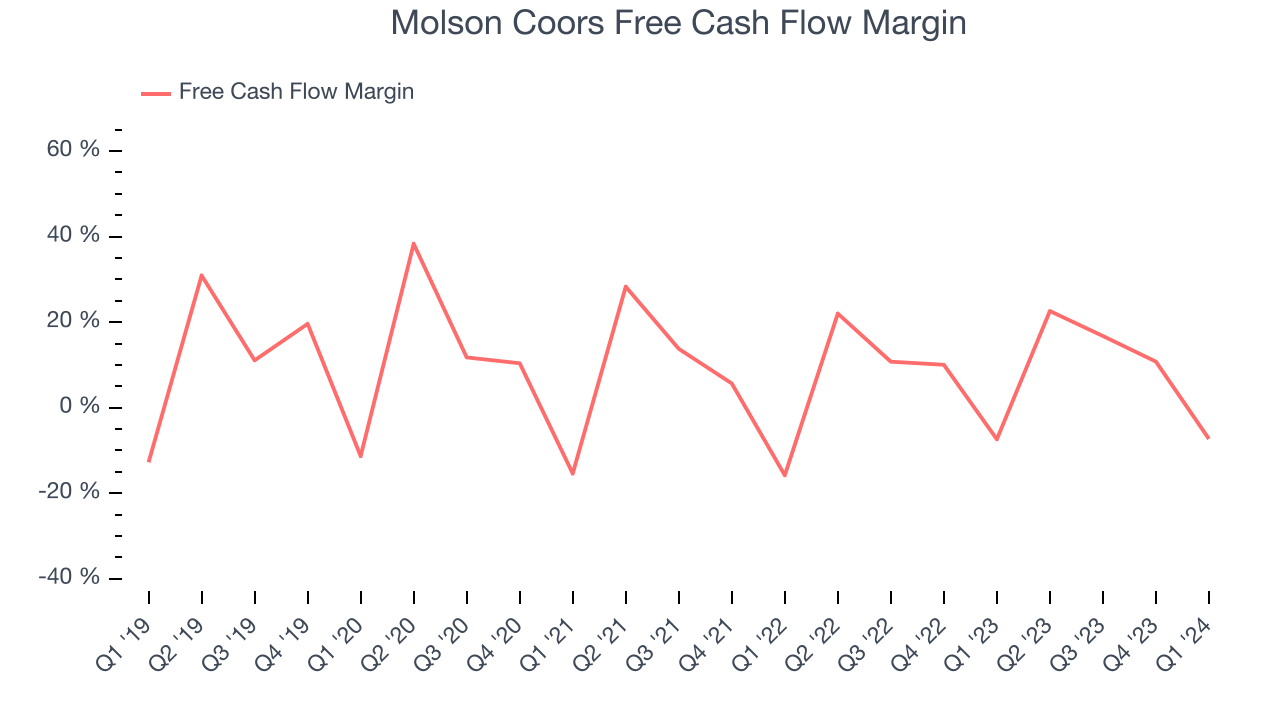
Over the last two years, Molson Coors has shown strong cash profitability, giving it an edge over its competitors and the option to reinvest or return capital to investors while keeping cash on hand for emergencies. The company's free cash flow margin has averaged 10.8%, quite impressive for a consumer staples business. Furthermore, its margin has averaged year-on-year increases of 2 percentage points over the last 12 months. This likely pleases the company's investors.
Return on Invested Capital (ROIC)
EPS and free cash flow tell us whether a company was profitable while growing revenue. But was it capital-efficient? Enter ROIC, a metric showing how much operating profit a company generates relative to how much money the business raised (debt and equity).
Molson Coors's five-year average ROIC was 2.6%, somewhat low compared to the best consumer staples companies that consistently pump out 20%+. Its returns suggest it historically did a subpar job investing in profitable business initiatives.
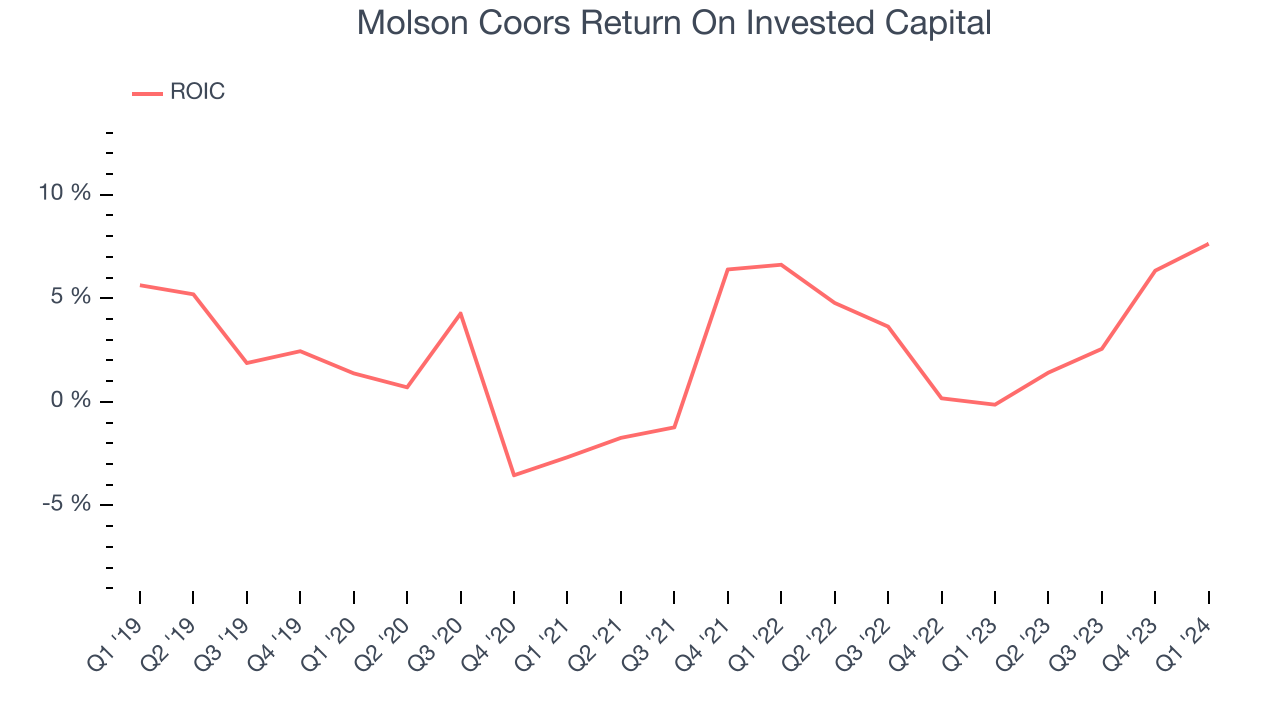
The trend in its ROIC, however, is often what surprises the market and drives the stock price. Over the last few years, Molson Coors's ROIC averaged 4.4 percentage point increases. This is a good sign, and we hope the company can continue improving.
Balance Sheet Risk
As long-term investors, the risk we care most about is the permanent loss of capital. This can happen when a company goes bankrupt or raises money from a disadvantaged position and is separate from short-term stock price volatility, which we are much less bothered by.
Molson Coors reported $458.4 million of cash and $6.22 billion of debt on its balance sheet in the most recent quarter. As investors in high-quality companies, we primarily focus on two things: 1) that a company's debt level isn't too high and 2) that its interest payments are not excessively burdening the business.
With $2.51 billion of EBITDA over the last 12 months, we view Molson Coors's 2.3x net-debt-to-EBITDA ratio as safe. We also see its $197.9 million of annual interest expenses as appropriate. The company's profits give it plenty of breathing room, allowing it to continue investing in new initiatives.
Key Takeaways from Molson Coors's Q1 Results
We enjoyed seeing Molson Coors exceed analysts' revenue, operating margin, and EPS expectations this quarter. That the company maintained its previously-provided full year guidance shows that it is staying on track and that the macro environment in which it operates hasn't changed too drastically since roughly three months ago. Zooming out, we think this was a great quarter that shareholders will appreciate. The stock is up 1.9% after reporting and currently trades at $64.75 per share.
Is Now The Time?
Molson Coors may have had a good quarter, but investors should also consider its valuation and business qualities when assessing the investment opportunity.
We cheer for all companies serving consumers, but in the case of Molson Coors, we'll be cheering from the sidelines. Although its revenue growth has been decent over the last three years, its relatively low ROIC suggests it has struggled to grow profits historically. And while its EPS growth over the last three years has significantly beat its peer group average, the downside is its projected EPS for the next year is lacking.
Molson Coors's price-to-earnings ratio based on the next 12 months is 11.2x. While there are some things to like about Molson Coors and its valuation is reasonable, we think there are better opportunities elsewhere in the market right now.
Wall Street analysts covering the company had a one-year price target of $68.60 per share right before these results (compared to the current share price of $64.75).
To get the best start with StockStory, check out our most recent stock picks, and then sign up to our earnings alerts by adding companies to your watchlist here. We typically have the quarterly earnings results analyzed within seconds of the data being released, and especially for companies reporting pre-market, this often gives investors the chance to react to the results before the market has fully absorbed the information.