
Bedding manufacturer Tempur Sealy (NYSE:TPX) fell short of analysts' expectations in Q1 CY2024, with revenue down 1.5% year on year to $1.19 billion. It made a non-GAAP profit of $0.50 per share, down from its profit of $0.53 per share in the same quarter last year.
Tempur Sealy (TPX) Q1 CY2024 Highlights:
- Revenue: $1.19 billion vs analyst estimates of $1.21 billion (1.3% miss)
- EPS (non-GAAP): $0.50 vs analyst estimates of $0.48 (3.6% beat)
- Full year EPS (non-GAAP) guidance: $2.75 at the midpoint, in line with expectations
- Gross Margin (GAAP): 43.1%, up from 41.4% in the same quarter last year
- Free Cash Flow of $98.7 million, up 67.3% from the previous quarter
- Market Capitalization: $8.70 billion
Established through the merger of Tempur-Pedic and Sealy in 2012, Tempur Sealy (NYSE:TPX) is a bedding manufacturer known for its innovative memory foam mattresses and sleep products
This company offers a wide range of mattresses, adjustable bases, pillows, and other sleep and relaxation products. As one of the largest bedding manufacturers in the world, Tempur Sealy has a presence in over 80 countries, with its products sold through various channels including third-party retailers, company-owned stores, and direct-to-consumer online platforms.
At the core of Tempur Sealy’s Tempur-Pedic product line is its innovative TEMPUR material, a proprietary, pressure-relieving memory foam. The TEMPUR material, originally developed by NASA to cushion astronauts during lift-off, provides exceptional support and comfort, adapting to the user’s body shape, weight, and temperature.
Sealy, on the other hand, is known for its innerspring mattresses. These products use spring coils, cooling technology, and hybrid foam/spring designs. The Tempur-Pedic and Sealy brands synergize to cater to a wide range of customer preferences.
Home Furnishings
A healthy housing market is good for furniture demand as more consumers are buying, renting, moving, and renovating. On the other hand, periods of economic weakness or high interest rates discourage home sales and can squelch demand. In addition, home furnishing companies must contend with shifting consumer preferences such as the growing propensity to buy goods online, including big things like mattresses and sofas that were once thought to be immune from e-commerce competition.
Tempur Sealy's primary competitors include Sleep Number (NASDAQ:SNBR), Purple (NASDAQ:PRPL), and private company Casper Sleep.Sales Growth
Reviewing a company's long-term performance can reveal insights into its business quality. Any business can have short-term success, but a top-tier one sustains growth for years. Tempur Sealy's annualized revenue growth rate of 12.2% over the last five years was mediocre for a consumer discretionary business. 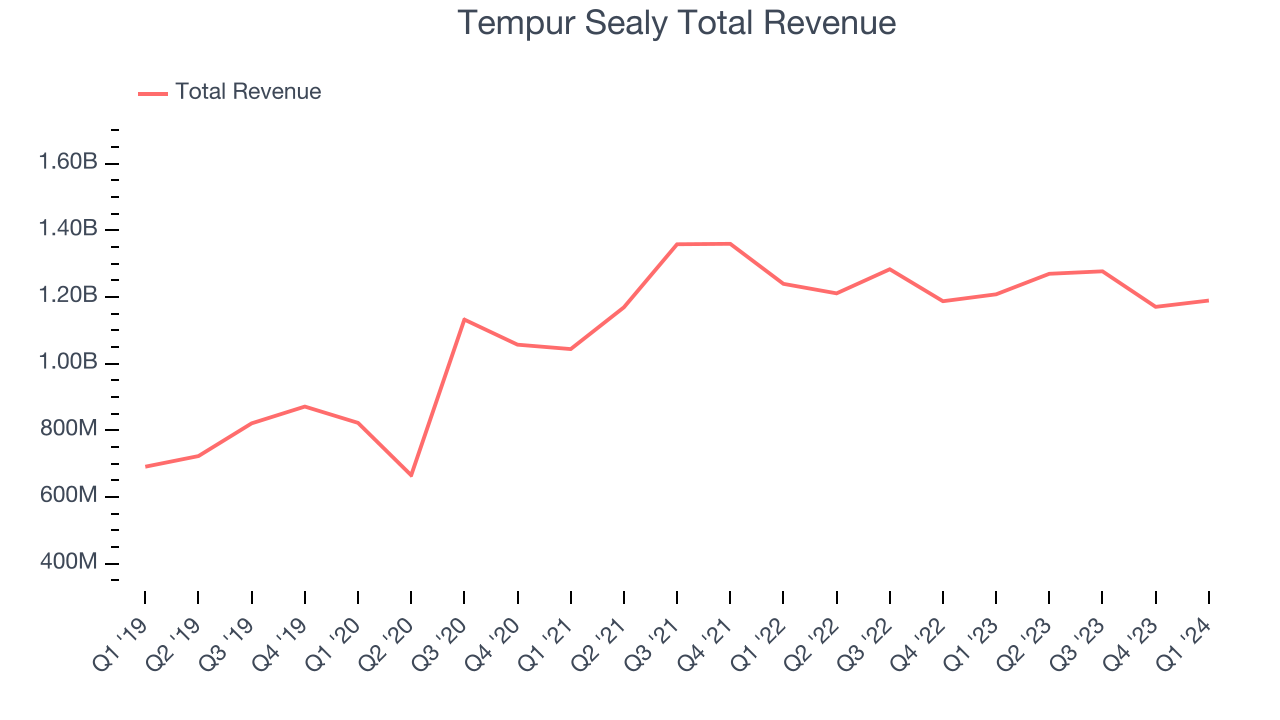 Within consumer discretionary, product cycles are short and revenue can be hit-driven due to rapidly changing trends. That's why we also follow short-term performance. Tempur Sealy's recent history shows a reversal from its already weak five-year trend as its revenue has shown annualized declines of 2.2% over the last two years.
We can dig even further into the company's revenue dynamics by analyzing its most important segments, Wholesale and Direct, which are 74.5% and 25.5% of revenue. Over the last two years, Tempur Sealy's Wholesale revenue (sales to retailers) averaged 4.3% year-on-year declines. On the other hand, its Direct revenue (sales made directly to consumers) averaged 9.9% growth.
This quarter, Tempur Sealy missed Wall Street's estimates and reported a rather uninspiring 1.5% year-on-year revenue decline, generating $1.19 billion of revenue. Looking ahead, Wall Street expects sales to grow 5.6% over the next 12 months, an acceleration from this quarter.
Operating Margin
Operating margin is an important measure of profitability. It’s the portion of revenue left after accounting for all core expenses–everything from the cost of goods sold to advertising and wages. Operating margin is also useful for comparing profitability across companies with different levels of debt and tax rates because it excludes interest and taxes.
Tempur Sealy has done a decent job managing its expenses over the last eight quarters. The company has produced an average operating margin of 12.6%, higher than the broader consumer discretionary sector.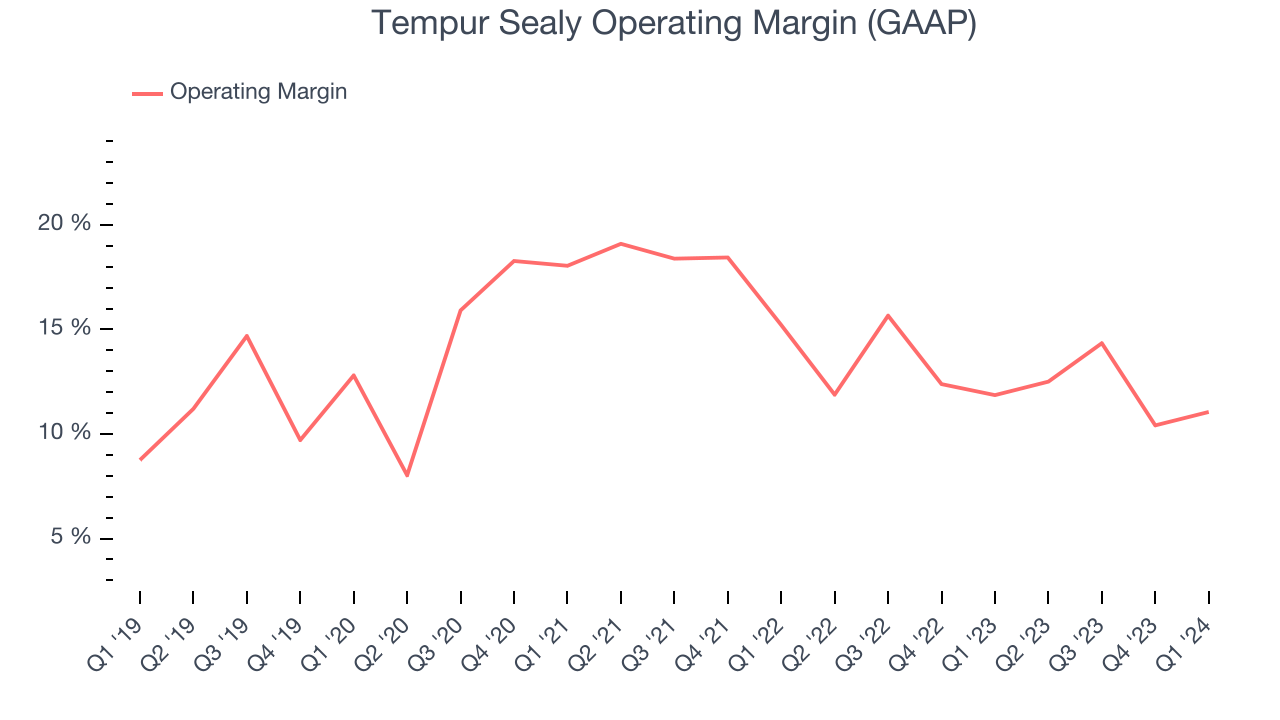
In Q1, Tempur Sealy generated an operating profit margin of 11.1%, in line with the same quarter last year. This indicates the company's costs have been relatively stable.
Over the next 12 months, Wall Street expects Tempur Sealy to become more profitable. Analysts are expecting the company’s LTM operating margin of 12.1% to rise to 15.8%.EPS
We track long-term historical earnings per share (EPS) growth for the same reason as long-term revenue growth. Compared to revenue, however, EPS highlights whether a company's growth was profitable. 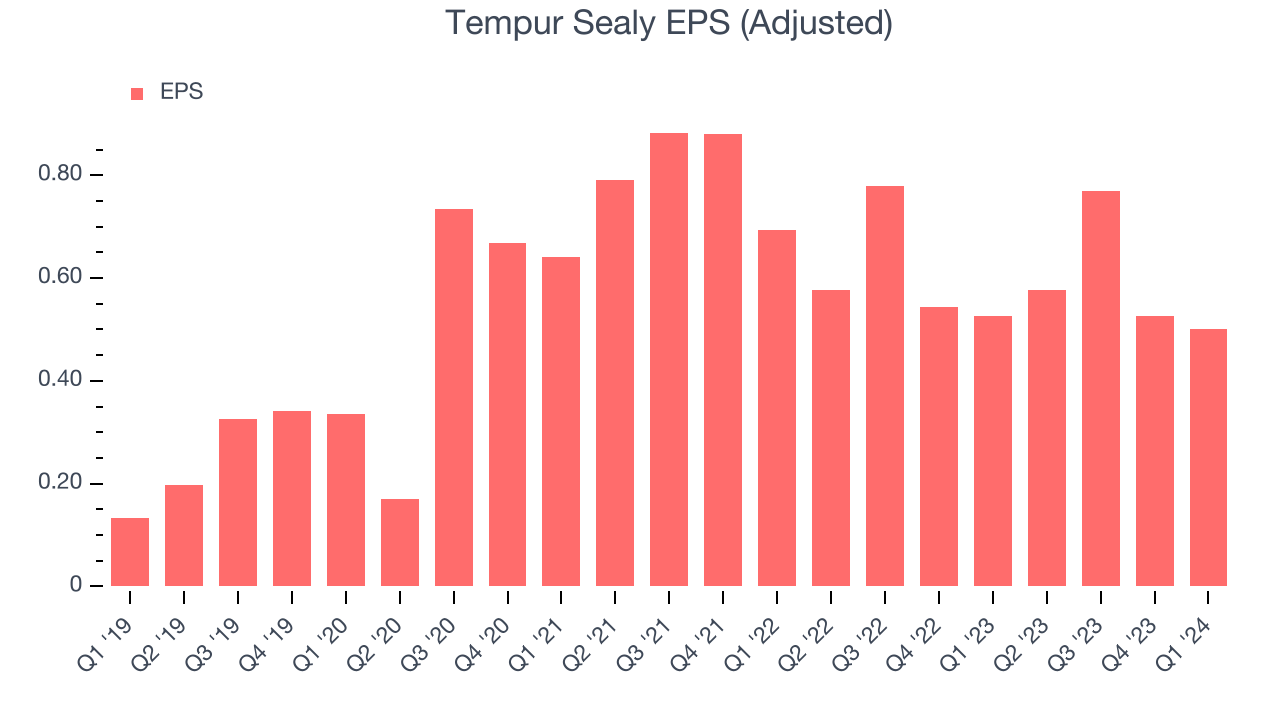
Over the last five years, Tempur Sealy's EPS grew 214%, translating into an astounding 25.7% compounded annual growth rate. This performance is materially higher than its 12.2% annualized revenue growth over the same period. There are a few reasons for this, and understanding why can shed light on its fundamentals.
While we mentioned earlier that Tempur Sealy's operating margin was flat this quarter, a five-year view shows its margin has expanded 2.3 percentage points while its share count has shrunk 20.1%. Improving profitability and share buybacks are positive signs as they juice EPS growth relative to revenue growth.In Q1, Tempur Sealy reported EPS at $0.50, down from $0.53 in the same quarter last year. Despite falling year on year, this print beat analysts' estimates by 3.6%. Over the next 12 months, Wall Street expects Tempur Sealy to grow its earnings. Analysts are projecting its LTM EPS of $2.37 to climb by 21% to $2.87.
Cash Is King
Although earnings are undoubtedly valuable for assessing company performance, we believe cash is king because you can't use accounting profits to pay the bills.
Over the last two years, Tempur Sealy has shown mediocre cash profitability, putting it in a pinch as it gives the company limited opportunities to reinvest, pay down debt, or return capital to shareholders. Its free cash flow margin has averaged 5.4%, subpar for a consumer discretionary business.
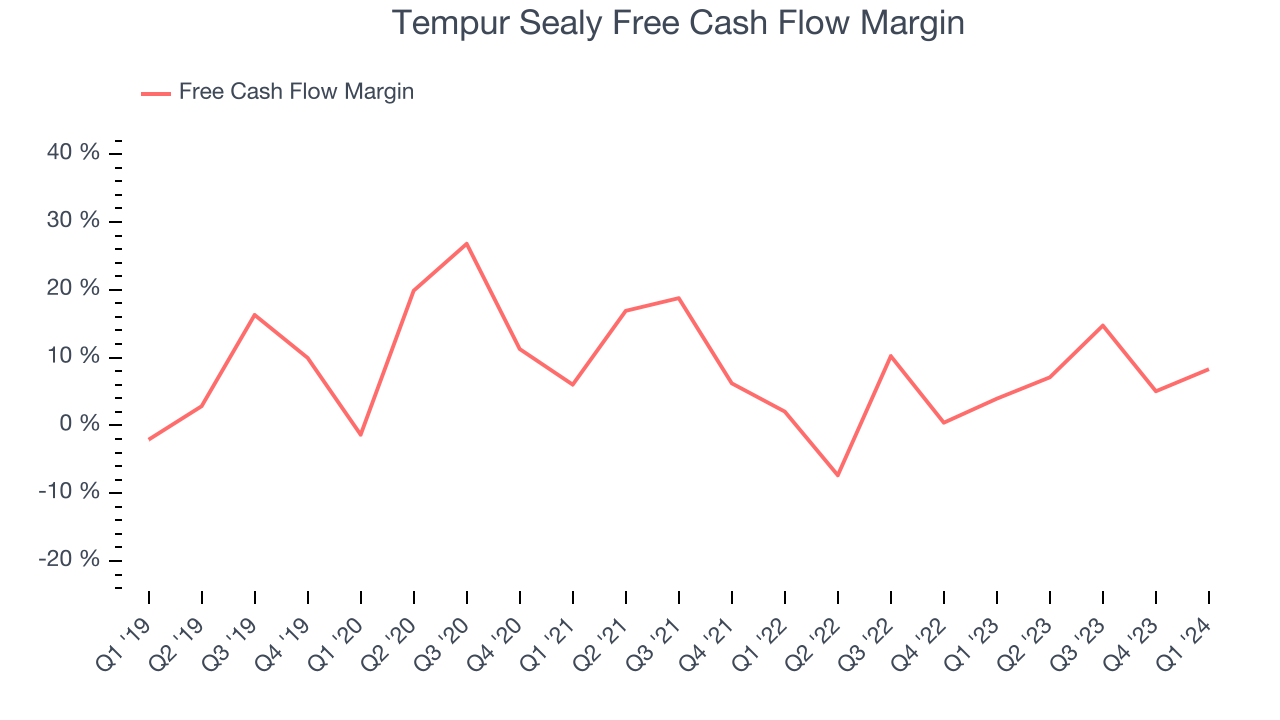
Tempur Sealy's free cash flow came in at $98.7 million in Q1, equivalent to a 8.3% margin and up 107% year on year. Over the next year, analysts' consensus estimates show they're expecting Tempur Sealy's LTM free cash flow margin of 8.9% to remain the same.
Return on Invested Capital (ROIC)
EPS and free cash flow tell us whether a company was profitable while growing revenue. But was it capital-efficient? A company’s ROIC explains this by showing how much operating profit a company makes compared to how much money the business raised (debt and equity).
Although Tempur Sealy hasn't been the highest-quality company lately, it historically did a solid job investing in profitable business initiatives. Its five-year average return on invested capital was 19.8%, higher than most consumer discretionary companies.
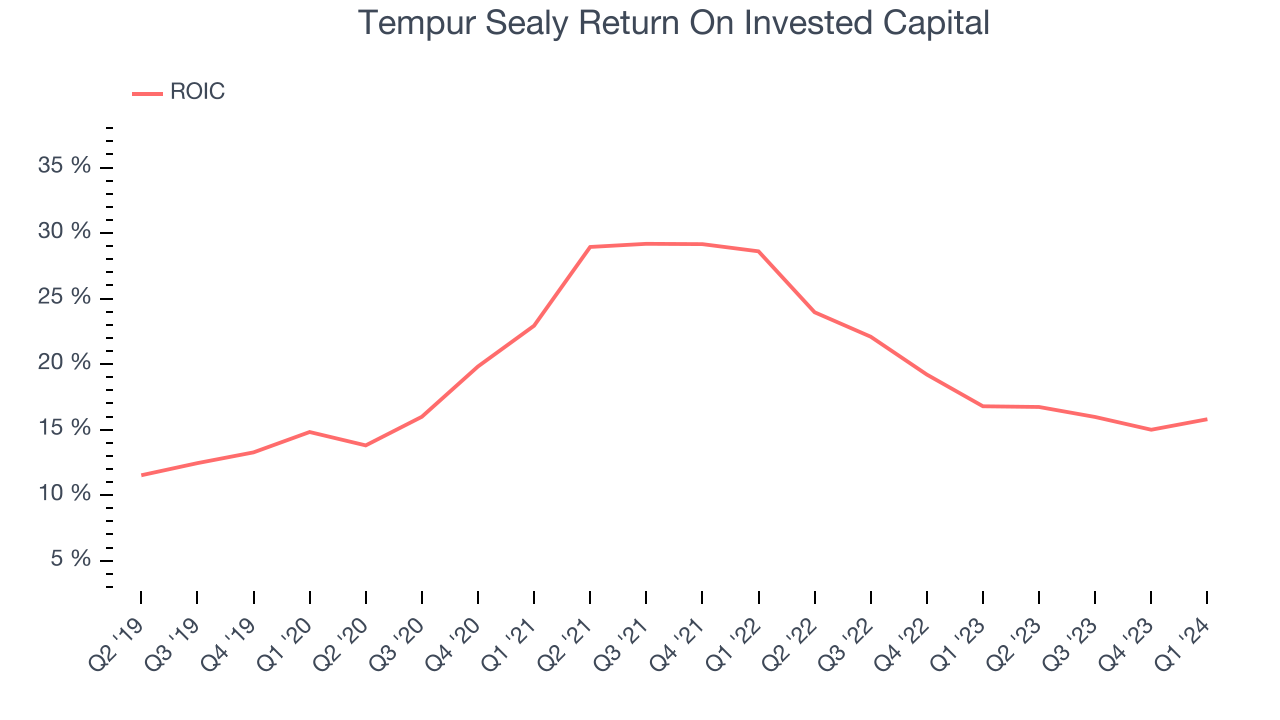
The trend in its ROIC, however, is often what surprises the market and drives the stock price. Unfortunately, Tempur Sealy's ROIC averaged 2.6 percentage point decreases over the last few years. We like what management has done historically but are concerned its ROIC is declining, perhaps a symptom of waning business opportunities to invest profitably.
Balance Sheet Risk
As long-term investors, the risk we care most about is the permanent loss of capital. This can happen when a company goes bankrupt or raises money from a disadvantaged position and is separate from short-term stock price volatility, which we are much less bothered by.
Tempur Sealy reported $92.5 million of cash and $3.25 billion of debt on its balance sheet in the most recent quarter. As investors in high-quality companies, we primarily focus on two things: 1) that a company's debt level isn't too high and 2) that its interest payments are not excessively burdening the business.
With $850.3 million of EBITDA over the last 12 months, we view Tempur Sealy's 3.7x net-debt-to-EBITDA ratio as safe. We also see its $62.8 million of annual interest expenses as appropriate. The company's profits give it plenty of breathing room, allowing it to continue investing in new initiatives.
Key Takeaways from Tempur Sealy's Q1 Results
It was encouraging to see Tempur Sealy slightly top analysts' EPS expectations this quarter. On the other hand, its operating margin missed and its Direct revenue fell short of Wall Street's estimates. That the company guided full year EPS in line with Consensus is comforting. Overall, this was a mixed quarter for Tempur Sealy. The stock is flat after reporting and currently trades at $50.13 per share.
Is Now The Time?
Tempur Sealy may have had a tough quarter, but investors should also consider its valuation and business qualities when assessing the investment opportunity.
Tempur Sealy isn't a bad business, but it probably wouldn't be one of our picks. Its revenue growth has been a little slower over the last five years, and analysts expect growth to deteriorate from here. And while its EPS growth over the last five years has been fantastic, unfortunately, its low free cash flow margins give it little breathing room.
Tempur Sealy's price-to-earnings ratio based on the next 12 months is 17.5x. We don't really see a big opportunity in the stock at the moment, but in the end, beauty is in the eye of the beholder. If you like Tempur Sealy, it seems to be trading at a reasonable price.
Wall Street analysts covering the company had a one-year price target of $63.50 per share right before these results (compared to the current share price of $50.13).
To get the best start with StockStory, check out our most recent stock picks, and then sign up for our earnings alerts by adding companies to your watchlist here. We typically have the quarterly earnings results analyzed within seconds of the data being released, and especially for companies reporting pre-market, this often gives investors the chance to react to the results before the market has fully absorbed the information.