
Social network Twitter (NYSE: TWTR) fell short of analyst expectations in Q2 FY2022 quarter, with revenue down 1.15% year on year to $1.17 billion. Twitter made a GAAP loss of $270 million, down on its profit of $65.6 million, in the same quarter last year.
Twitter (TWTR) Q2 FY2022 Highlights:
- Revenue: $1.17 billion vs analyst estimates of $1.33 billion (11.9% miss)
- EPS (non-GAAP): -$0.08 vs analyst estimates of $0.14 (-$0.22 miss)
- Free cash flow was negative $123.9 million, compared to negative free cash flow of $34.6 million in previous quarter
- Gross Margin (GAAP): 54%, down from 64.9% same quarter last year
- Monetizable Daily Active Users: 237.8 million, up 31.8 million year on year
- Twitter has previously entered into a definitive agreement to be acquired by Elon Musk, for $54.20 per share in cash in a transaction valued at approximately $44 billion
Born out of a failed podcasting startup, Twitter (NYSE: TWTR) is the town square of the internet, one part social network, one part media distribution platform.
Founder Jack Dorsey famously chose the name Twitter because its definition was "a short burst of inconsequential information", and "chirps from birds”. Twitter is a platform whose stated mission is to give everyone the power to create and share ideas and information instantly without barriers. Information is posted in the form of “tweets” that users consume by topic or interest and can interact with or respond to. Over time Twitter has evolved into a real time information distribution platform, where public figures make announcements to where news organizations post breaking news.
The platform has value for users, influencers and businesses, allowing them the ability to reach large audiences. For companies, Twitter allows them to monitor public sentiment about their brands or products and interact with customers in real time. For advertisers, Twitter provides the ability to target users by interest. Because of the nature of the platform and the types of ad products the company has built, advertisers have generally used Twitter for brand advertising purposes, rather than the more valuable direct response advertising commonly found on other social networks.
Businesses must meet their customers where they are, which over the past decade has come to mean on social networks. In 2020, users spent over 2.5 hours a day on social networks, a figure that has increased every year since measurement began. As a result, businesses continue to shift their advertising and marketing dollars online.
Twitter (NYSE: TWTR) competes with fellow social media advertising platforms like Google (NASDAQ: GOOGL), Meta Platforms (NASDAQ:FB), Snapchat (NYSE: SNAP), and Pinterest (NASDAQ: PINS).
Sales Growth
Twitter's revenue growth over the last three years has been solid, averaging 18.4% annually. The initial impact of the pandemic was positive for Twitter's revenue, pulling forward sales, but quarterly revenue subsequently normalized, year over year.
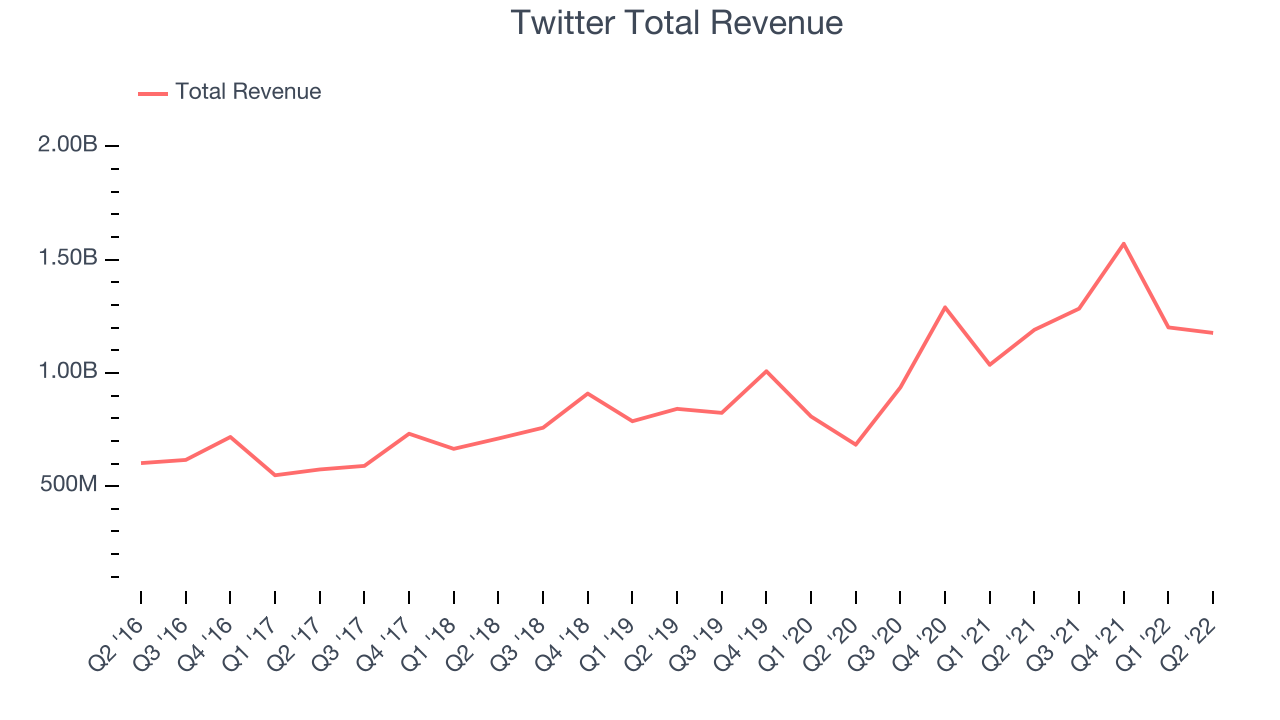
This quarter, Twitter reported a rather lacklustre 1.15% year on year revenue decline, missing analyst expectations.
Ahead of the earnings results the analysts covering the company were estimating sales to grow 22.9% over the next twelve months.
Usage Growth
As a social network, Twitter can generate revenue growth by increasing user numbers, and by charging more for the ads each user is exposed to.
Over the last two years the number of Twitter's daily active users, a key usage metric for the company, grew 18.4% annually to 237.8 million users. This is a solid growth for a consumer internet company.
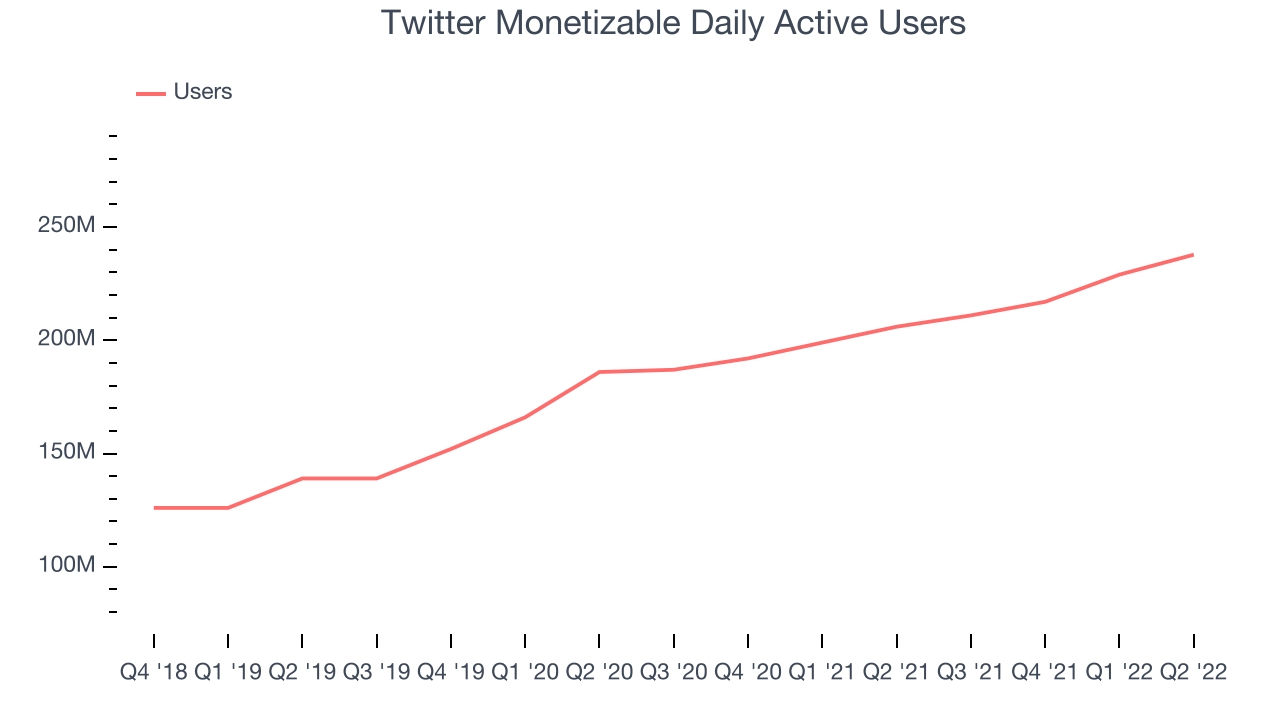
In Q2 the company added 31.8 million daily active users, translating to a 15.4% growth year on year.
Revenue Per User
Average revenue per user (ARPU) is a critical metric to track for every consumer internet product and for Twitter it measures how much it makes off ads served to each user, proxy for how valuable advertisers find its audience and its ad-targeting capabilities.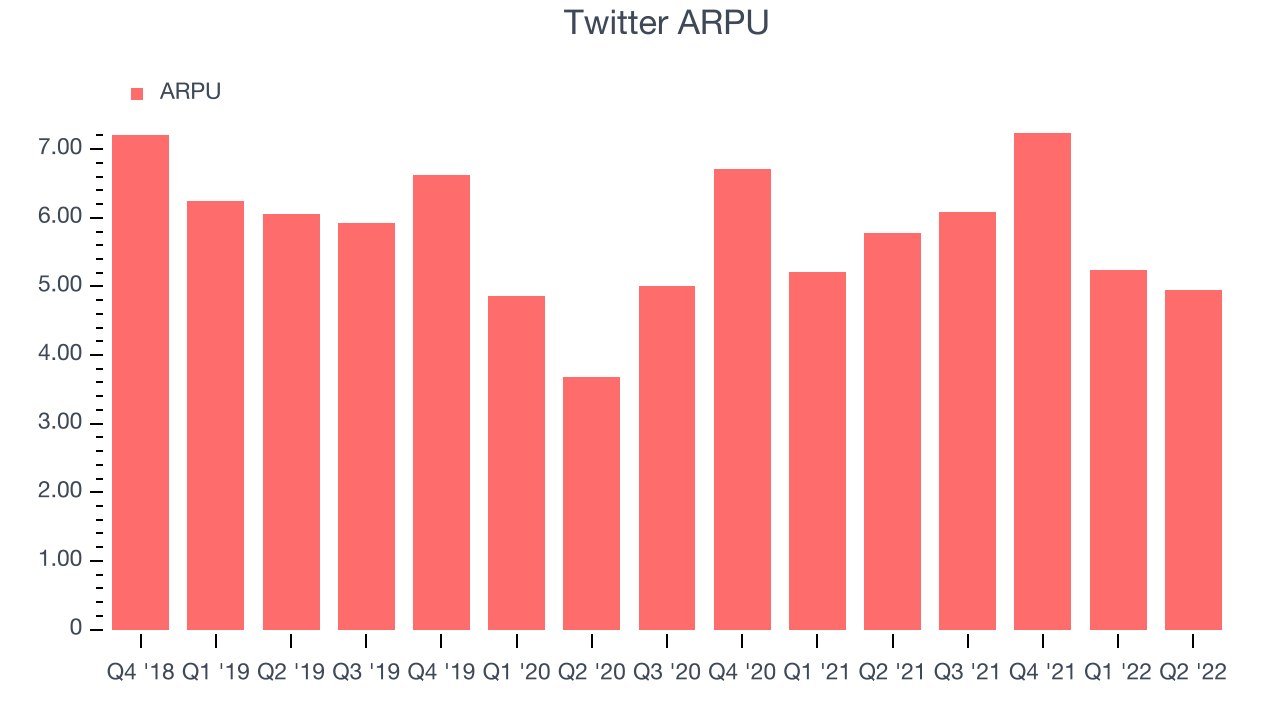
Twitter’s ARPU growth has been decent over the last two years, averaging 8.21%. The ability to increase price while still growing its user base shows the value of Twitter’s platform. This quarter, ARPU shrank 14.3% year on year, settling in at $4.94 for each of the daily active users.
User Acquisition Efficiency
Unlike enterprise software that is typically sold by sales teams, consumer internet businesses like Twitter grow by a combination of product virality, paid advertisement or incentives.
It is relatively expensive for Twitter to acquire new users, with the company spending 40.3% of its gross profit on marketing over the last year. This level of sales and marketing spend efficiency indicates Twitter has to compete for users and points to Twitter likely having to continue to invest to maintain growth.
Earnings & Free Cash Flow
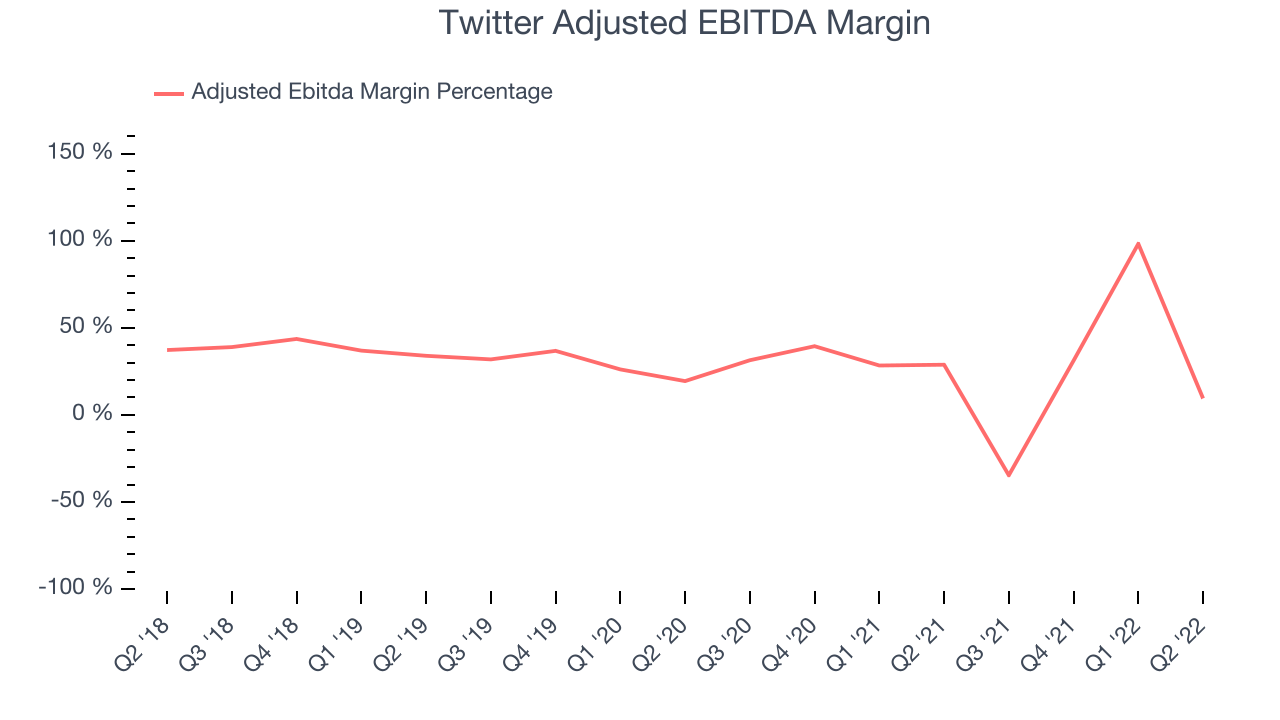
Investors typically look at a company’s operating income to get a sense of how profitable a core business is. Adjusted EBITDA is the most common profitability metric for consumer internet companies, similar to operating profit, but removes various one time or non-cash expenses to give a more normalized measure of profitability.
Twitter reported EBITDA of $111.7 million this quarter, which was a 9.49% margin. Over the last four quarters Twitter has demonstrated a very strong profitability with average EBITDA margins of 26%.
If you follow StockStory for a while, you know that we put an emphasis on cash flow. Why, you ask? We believe that in the end cash is king, as you can't use accounting profits to pay the bills. Twitter burned through $123.9 million in Q2, with cash flow turning negative year on year.
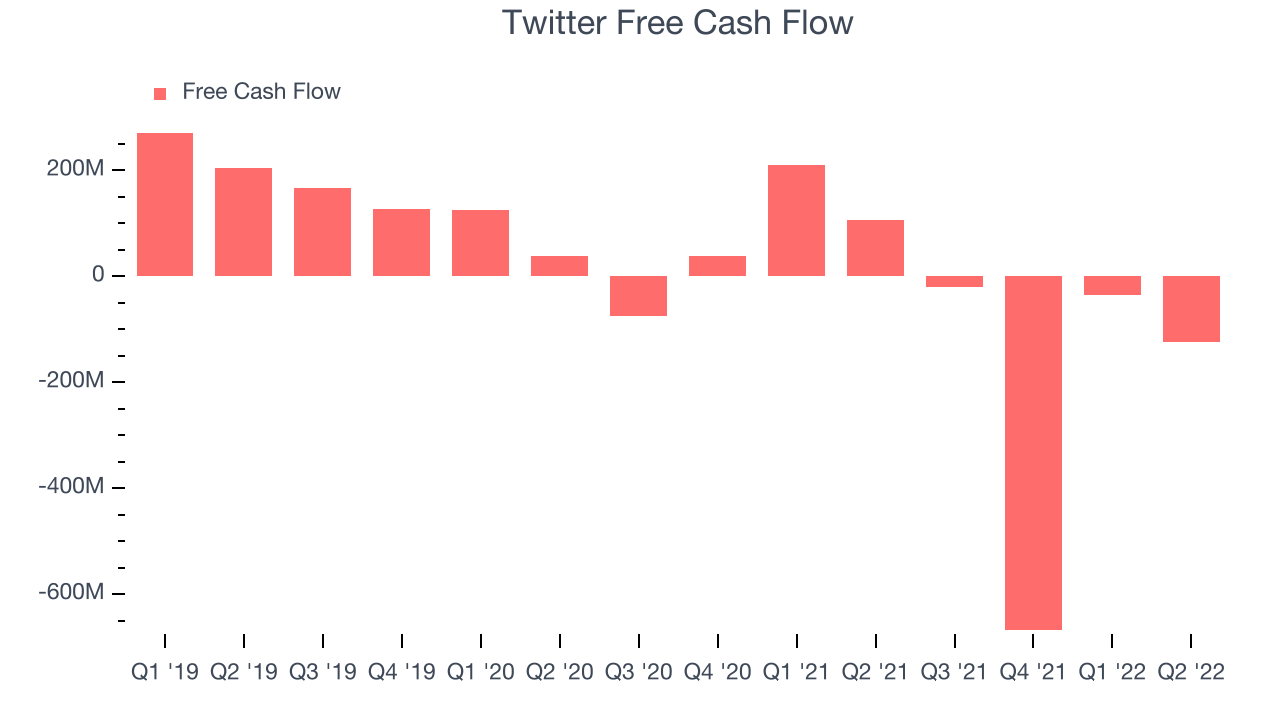
Twitter has burned through $845.5 million in cash over the last twelve months, an uninspiring -16.2% free cash flow margin. This low FCF margin is a result of Twitter's capital intensive business model.
Key Takeaways from Twitter's Q2 Results
Since it has still been burning cash over the last twelve months it is worth keeping an eye on Twitter’s balance sheet, but we note that with a market capitalization of $30.4 billion and more than $6.12 billion in cash, the company has the capacity to continue to prioritise growth over profitability.
It was great to see that Twitter’s user base is growing. That feature of these results really stood out as a positive. On the other hand, it was less good to see that the revenue growth was quite weak and it missed analysts' revenue expectations. Overall, it seems to us that this was a complicated quarter for Twitter. The company currently trades at $54.2 per share.
Is Now The Time?
When considering Twitter, investors should take into account its valuation and business qualities, as well as what happened in the latest quarter. Although Twitter is not a bad business, it probably wouldn't be one of our picks. Its revenue growth has been a little slower, but at least that growth rate is expected to increase in the short term. And while its EBITDA margins point towards strong profitability of the core business, the downside is that its operations are coming at a cost of a not an insignificant cash burn and its ARPU is growing slowly.
The market is currently pricing Twitter in relation to the acquisition offer by Elon Musk and its EV/EBITDA ratio based on the next twelve months of 19.4x is higher than many other consumer internet companies. .
To get the best start with StockStory check out our most recent Stock picks, and then sign up to our earnings alerts by adding companies to your watchlist here. We typically have the quarterly earnings results analyzed within seconds from the data being released, and especially for the companies reporting pre-market, this often gives investors the chance to react to the results before the market has fully absorbed the information.