
Hotel franchising company Wyndham (NYSE:WH) missed analysts' expectations in Q1 CY2024, with revenue down 2.6% year on year to $305 million. It made a non-GAAP profit of $0.78 per share, down from its profit of $0.86 per share in the same quarter last year.
Wyndham (WH) Q1 CY2024 Highlights:
- Revenue: $305 million vs analyst estimates of $308.3 million (1.1% miss)
- EPS (non-GAAP): $0.78 vs analyst estimates of $0.74 (4.9% beat)
- Full year guidance for rooms growth, RevPAR growth, and adjusted EBITDA maintained from previous
- EPS (non-GAAP) guidance for the full year: $4.24 at the midpoint (in line with expectations, raised from previous midpoint of $4.17)
- Gross Margin (GAAP): 57%, down from 60.4% in the same quarter last year
- Free Cash Flow of $67 million, down 41.2% from the previous quarter
- Market Capitalization: $5.79 billion
Established in 1981, Wyndham (NYSE:WH) is a global hotel franchising company with over 9,000 hotels across nearly 95 countries on six continents.
The company's portfolio is diverse, encompassing over 20 hotel brands that cater to a broad spectrum of travelers and budgets.
At the luxury and upscale end, Wyndham offers brands like Wyndham Grand and Dolce Hotels and Resorts, known for their refined experiences and exceptional service. The company's mid-scale offerings, such as Ramada and Wingate, provide comfortable and value-driven accommodations for business and leisure travelers. Lastly, Wyndham's economy brands, including Days Inn and Super 8, offer affordable and reliable lodging options.
Wyndham primarily focuses on hotel franchising, with a vast majority of its properties operated by independent owners under franchise agreements. This model has allowed Wyndham to maintain a wide geographic spread without the substantial capital investment typically associated with owning properties. The company also manages a smaller number of hotels through management contracts.
Customer loyalty is key to Wyndham's operations. Wyndham Rewards, its loyalty program, is a notable example, offering members a simple and generous points system that can be redeemed for free nights, discounts, and other rewards.
Hotels, Resorts and Cruise Lines
Hotels, resorts, and cruise line companies often sell experiences rather than tangible products, and in the last decade-plus, consumers have slowly shifted from buying "things" (wasteful) to buying "experiences" (memorable). In addition, the internet has introduced new ways of approaching leisure and lodging such as booking homes and longer-term accommodations. Traditional hotel, resorts, and cruise line companies must innovate to stay relevant in a market rife with innovation.
Wyndham’s primary competitors include Marriott International (NYSE:MAR), Hilton Worldwide Holdings (NYSE:HLT), InterContinental Hotels Group (NYSE:IHG), Choice Hotels International (NYSE:CHH), and Hyatt Hotels (NYSE:H).Sales Growth
A company’s long-term performance can give signals about its business quality. Any business can put up a good quarter or two, but many enduring ones muster years of growth. Wyndham's revenue declined over the last five years, dropping 7.3% annually.
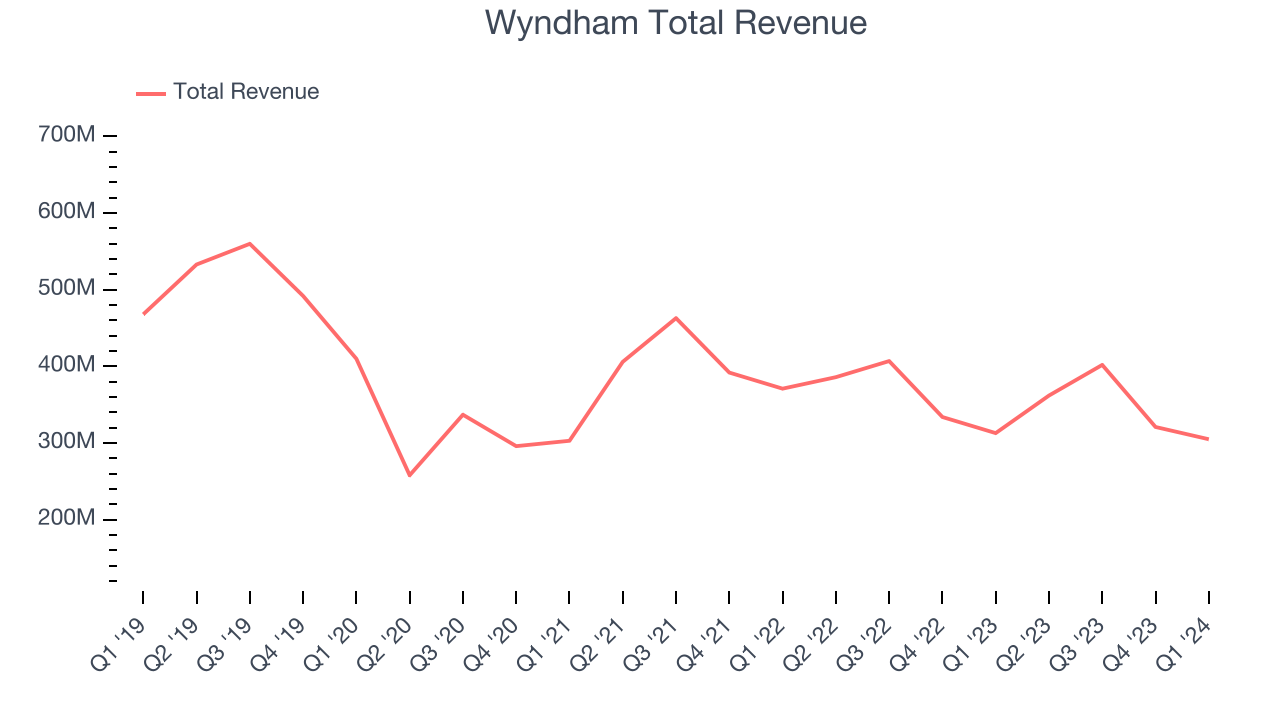
Within consumer discretionary, a long-term historical view may miss a company riding a successful new property or emerging trend. That's why we also follow short-term performance. Wyndham's 2-year annualized revenue declines of 7.7% align with its five-year revenue declines, suggesting its demand is consistently shrinking.
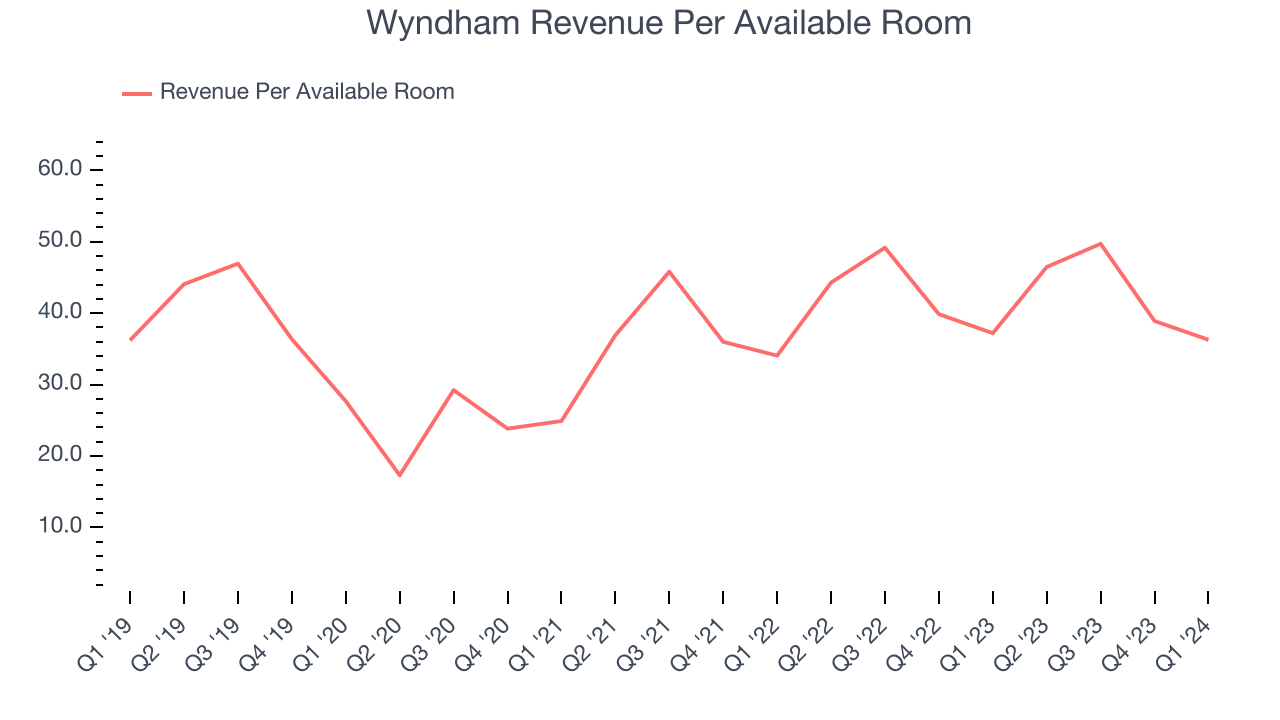
We can dig even further into the company's revenue dynamics by analyzing its revenue per available room, which clocked in at $36.28 this quarter and is a key metric accounting for average daily rates and occupancy levels. Over the last two years, Wyndham's revenue per room averaged 6.1% year-on-year growth. Because this number is higher than its revenue growth, we can see its room bookings outperformed its sales from other areas like restaurants, bars, and amenities.
This quarter, Wyndham missed Wall Street's estimates and reported a rather uninspiring 2.6% year-on-year revenue decline, generating $305 million of revenue. Looking ahead, Wall Street expects sales to grow 5.3% over the next 12 months, an acceleration from this quarter.
Operating Margin
Operating margin is an important measure of profitability. It’s the portion of revenue left after accounting for all core expenses–everything from the cost of goods sold to advertising and wages. Operating margin is also useful for comparing profitability across companies with different levels of debt and tax rates because it excludes interest and taxes.
Wyndham has been a well-oiled machine over the last two years. It's demonstrated elite profitability for a consumer discretionary business, boasting an average operating margin of 33.6%.In Q1, Wyndham generated an operating profit margin of 16.4%, down 19.7 percentage points year on year.
Over the next 12 months, Wall Street expects Wyndham to become more profitable. Analysts are expecting the company’s LTM operating margin of 31.7% to rise to 38.5%.EPS
Analyzing long-term revenue trends tells us about a company's historical growth, but the long-term change in its earnings per share (EPS) points to the profitability and efficiency of that growth–for example, a company could inflate its sales through excessive spending on advertising and promotions.
Over the last five years, Wyndham's EPS grew 46.6%, translating into an unimpressive 8% compounded annual growth rate. This performance, however, is materially higher than its 7.3% annualized revenue declines over the same period. There are a few reasons for this, and understanding why can shed light on its fundamentals.
While we mentioned earlier that Wyndham's operating margin declined this quarter, a five-year view shows its margin has expanded 5.7 percentage points while its share count has shrunk 16.7%. Improving profitability and share buybacks are positive signs as they juice EPS growth relative to revenue growth.In Q1, Wyndham reported EPS at $0.78, down from $0.86 in the same quarter last year. Despite falling year on year, this print beat analysts' estimates by 4.9%. Over the next 12 months, Wall Street expects Wyndham to grow its earnings. Analysts are projecting its LTM EPS of $3.93 to climb by 9.4% to $4.30.
Cash Is King
Although earnings are undoubtedly valuable for assessing company performance, we believe cash is king because you can't use accounting profits to pay the bills.
Over the last two years, Wyndham has shown terrific cash profitability, enabling it to reinvest, return capital to investors, and stay ahead of the competition while maintaining a robust cash balance. The company's free cash flow margin has been among the best in the consumer discretionary sector, averaging 22.7%.
Wyndham's free cash flow came in at $67 million in Q1, equivalent to a 22% margin and down 20.2% year on year.
Return on Invested Capital (ROIC)
EPS and free cash flow tell us whether a company was profitable while growing revenue. But was it capital-efficient? A company’s ROIC explains this by showing how much operating profit a company makes compared to how much money the business raised (debt and equity).
Wyndham's five-year average return on invested capital was 9.4%, somewhat low compared to the best consumer discretionary companies that pump out 25%+. Its returns suggest it historically did a subpar job investing in profitable business initiatives.
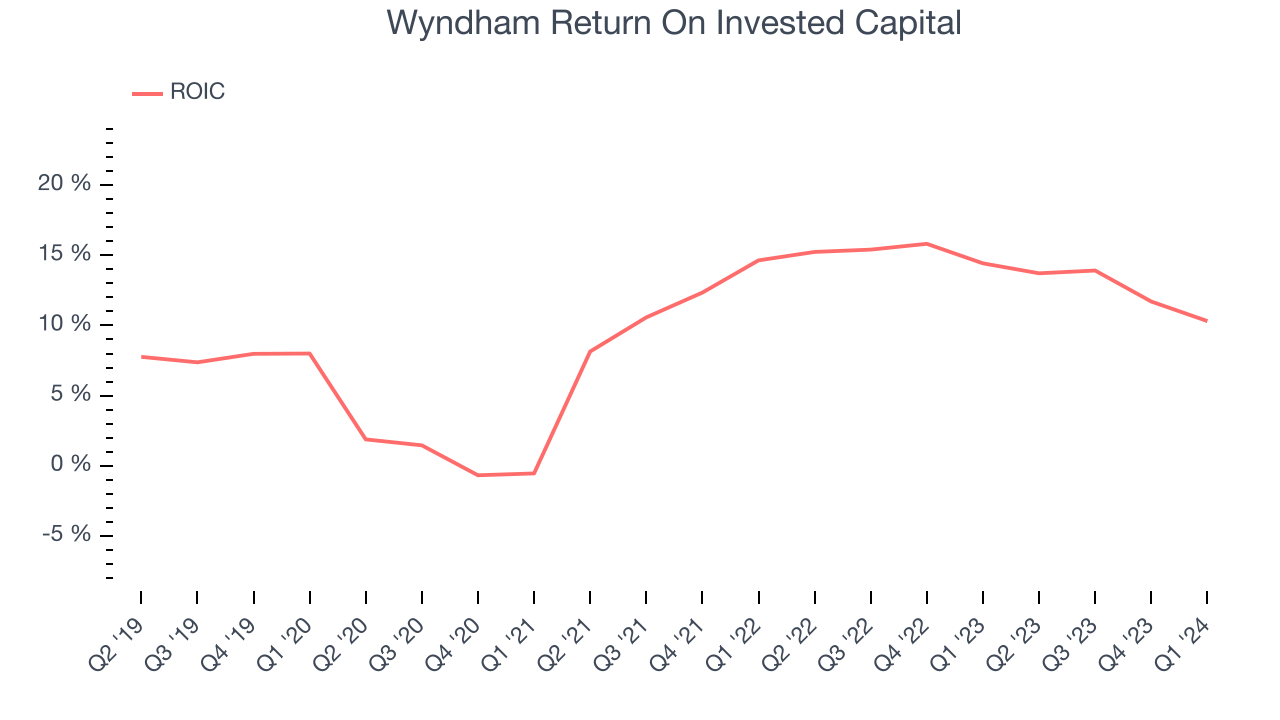
The trend in its ROIC, however, is often what surprises the market and drives the stock price. Over the last few years, Wyndham's ROIC averaged 8.6 percentage point increases. This is a good sign, and if the company's returns keep rising, there's a chance it could evolve into an investable business.
Balance Sheet Risk
As long-term investors, the risk we care most about is the permanent loss of capital. This can happen when a company goes bankrupt or raises money from a disadvantaged position and is separate from short-term stock price volatility, which we are much less bothered by.
Wyndham reported $50 million of cash and $2.24 billion of debt on its balance sheet in the most recent quarter. As investors in high-quality companies, we primarily focus on two things: 1) that a company's debt level isn't too high and 2) that its interest payments are not excessively burdening the business.
With $653 million of EBITDA over the last 12 months, we view Wyndham's 3.4x net-debt-to-EBITDA ratio as safe. We also see its $52 million of annual interest expenses as appropriate. The company's profits give it plenty of breathing room, allowing it to continue investing in new initiatives.
Key Takeaways from Wyndham's Q1 Results
It was encouraging to see Wyndham slightly top analysts' adjusted EBITDA and EPS expectations this quarter. On the other hand, its revenue fell short of Wall Street's estimates. Guidance didn't provide any surprises, as the company maintained its full year outlook for rooms growth, RevPAR growth, and adjusted EBITDA. EPS guidance was raised but came in in line with analyst estimates. Overall, this was a mixed quarter for Wyndham. The stock is flat after reporting and currently trades at $71.96 per share.
Is Now The Time?
Wyndham may have had a tough quarter, but investors should also consider its valuation and business qualities when assessing the investment opportunity.
We have other favorites, but we understand the arguments that Wyndham isn't a bad business. Although its revenue has declined over the last five years, its growth over the next 12 months is expected to be higher. And while its revenue per room has been disappointing, its impressive operating margins show it has a highly efficient business model.
Wyndham's price-to-earnings ratio based on the next 12 months is 16.7x. We don't really see a big opportunity in the stock at the moment, but in the end, beauty is in the eye of the beholder. If you like Wyndham, it seems to be trading at a reasonable price.
Wall Street analysts covering the company had a one-year price target of $89.44 per share right before these results (compared to the current share price of $71.96).
To get the best start with StockStory, check out our most recent stock picks, and then sign up for our earnings alerts by adding companies to your watchlist here. We typically have the quarterly earnings results analyzed within seconds of the data being released, and especially for companies reporting pre-market, this often gives investors the chance to react to the results before the market has fully absorbed the information.