
Regional banking company Flagstar Financial (NYSE:FLG) reported Q4 CY2025 results topping the market’s revenue expectations, but sales fell by 2.4% year on year to $557 million. Its non-GAAP profit of $0.06 per share was significantly above analysts’ consensus estimates.
Is now the time to buy Flagstar Financial? Find out by accessing our full research report, it’s free.
Flagstar Financial (FLG) Q4 CY2025 Highlights:
- Net Interest Income: $467 million vs analyst estimates of $453.1 million (1.3% year-on-year growth, 3.1% beat)
- Net Interest Margin: 2.1% vs analyst estimates of 2.1% (8.5 basis point beat)
- Revenue: $557 million vs analyst estimates of $531.1 million (2.4% year-on-year decline, 4.9% beat)
- Efficiency Ratio: 91.3% vs analyst estimates of 86% (525.1 basis point miss)
- Adjusted EPS: $0.06 vs analyst estimates of $0.02 (significant beat)
- Tangible Book Value per Share: $15.82 vs analyst estimates of $16.42 (8.5% year-on-year decline, 3.7% miss)
- Market Capitalization: $5.63 billion
Commenting on the Bank's fourth quarter and full-year ended 2025 performance, Chairman, President, and Chief Executive Officer, Joseph M. Otting stated, "We are extremely pleased with our performance in the fourth quarter of 2025. After two challenging years, I'm proud to share that during the fourth quarter, the Bank returned to profitability, as we reported net income attributable to common stockholders of $21 million or $0.05 per diluted share, and $30 million on an adjusted basis or $0.06 per diluted share.
Company Overview
Tracing its roots back to 1859 and rebranded from New York Community Bancorp in 2024, Flagstar Financial (NYSE:FLG) is a bank holding company that offers commercial and consumer banking services, with specialties in multi-family lending, mortgage originations, and warehouse lending.
Sales Growth
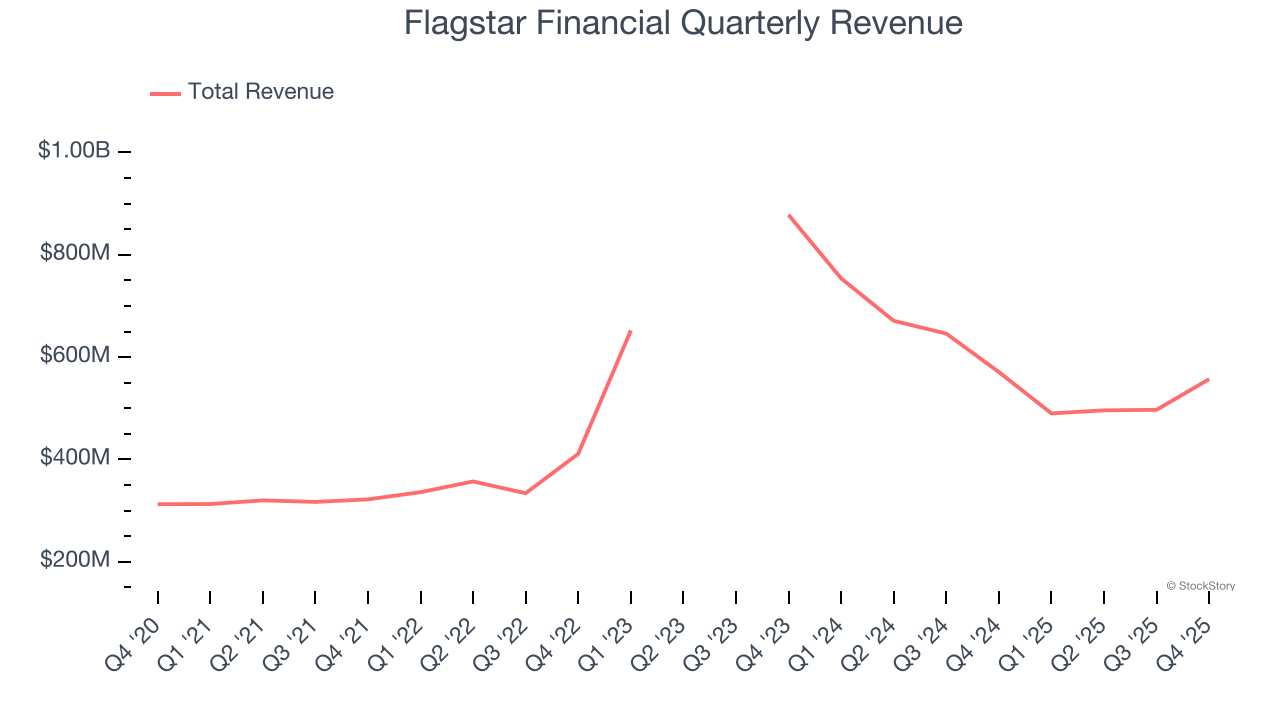
From lending activities to service fees, most banks build their revenue model around two income sources. Interest rate spreads between loans and deposits create the first stream, with the second coming from charges on everything from basic bank accounts to complex investment banking transactions. Luckily, Flagstar Financial’s revenue grew at a solid 12.6% compounded annual growth rate over the last five years. Its growth beat the average banking company and shows its offerings resonate with customers.
 Note: Quarters not shown were determined to be outliers, impacted by outsized investment gains/losses that are not indicative of the recurring fundamentals of the business.
We at StockStory place the most emphasis on long-term growth, but within financials, a half-decade historical view may miss recent interest rate changes, market returns, and industry trends. Flagstar Financial’s recent performance marks a sharp pivot from its five-year trend as its revenue has shown annualized declines of 25.1% over the last two years. 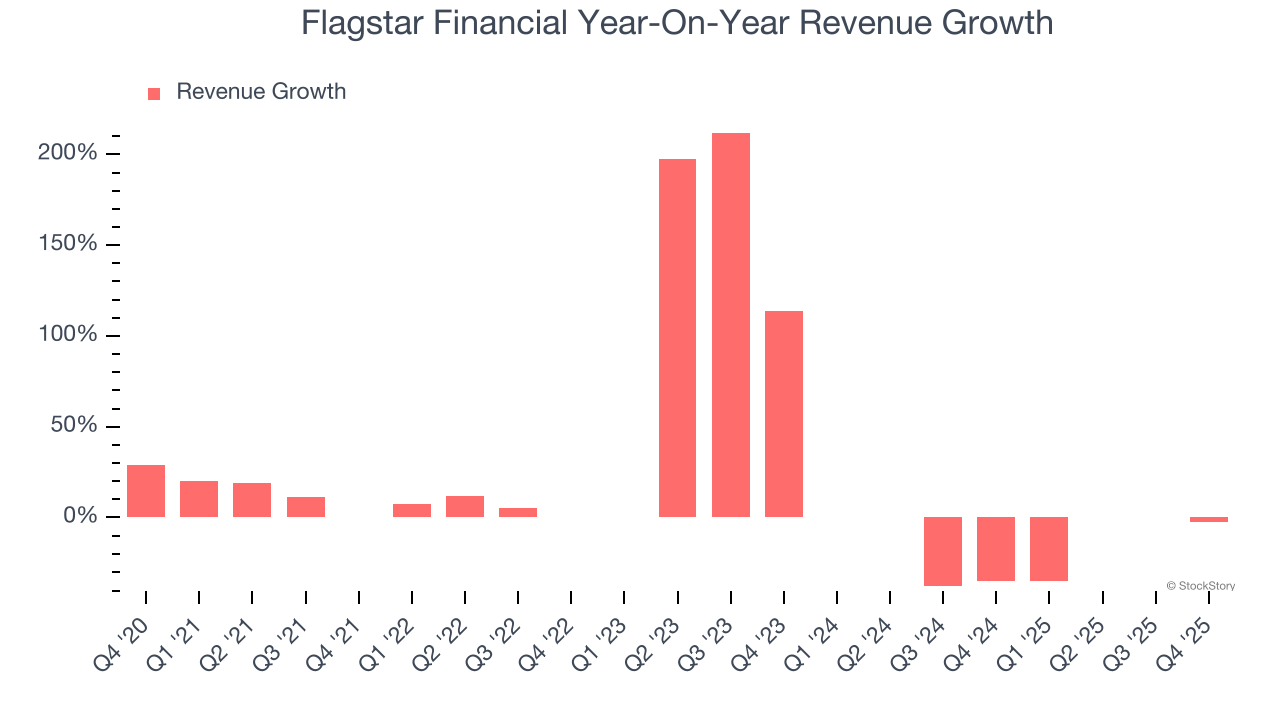 Note: Quarters not shown were determined to be outliers, impacted by outsized investment gains/losses that are not indicative of the recurring fundamentals of the business.
This quarter, Flagstar Financial’s revenue fell by 2.4% year on year to $557 million but beat Wall Street’s estimates by 4.9%.
Net interest income made up 89.8% of the company’s total revenue during the last five years, meaning Flagstar Financial barely relies on non-interest income to drive its overall growth.
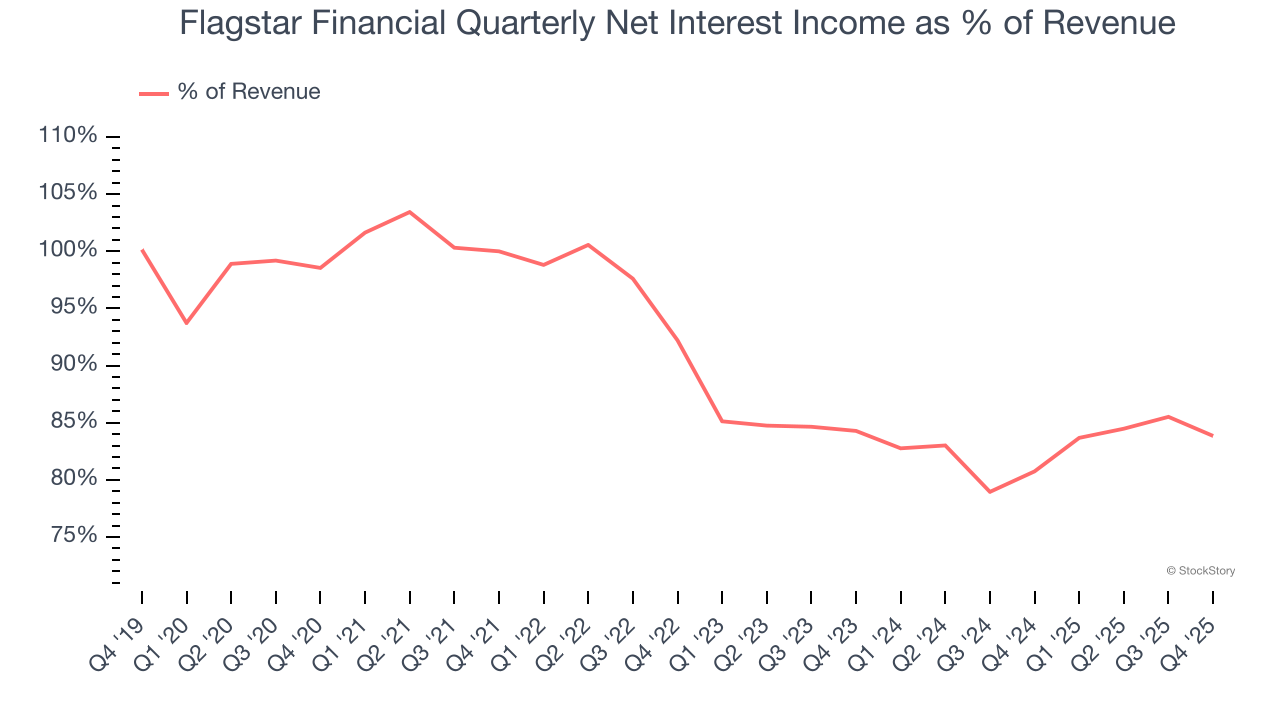
Net interest income commands greater market attention due to its reliability and consistency, whereas non-interest income is often seen as lower-quality revenue that lacks the same dependable characteristics.
While Wall Street chases Nvidia at all-time highs, an under-the-radar semiconductor supplier is dominating a critical AI component these giants can’t build without. Click here to access our free report one of our favorites growth stories.
Tangible Book Value Per Share (TBVPS)
Banks are balance sheet-driven businesses because they generate earnings primarily through borrowing and lending. They’re also valued based on their balance sheet strength and ability to compound book value (another name for shareholders’ equity) over time.
This explains why tangible book value per share (TBVPS) stands as the premier banking metric. TBVPS strips away questionable intangible assets, revealing concrete per-share net worth that investors can trust. Other (and more commonly known) per-share metrics like EPS can sometimes be murky due to M&A or accounting rules allowing for loan losses to be spread out.
Flagstar Financial’s TBVPS declined at a 9% annual clip over the last five years. A turnaround doesn’t seem to be in sight as its TBVPS also dropped by 27.5% annually over the last two years ($30.08 to $15.82 per share).
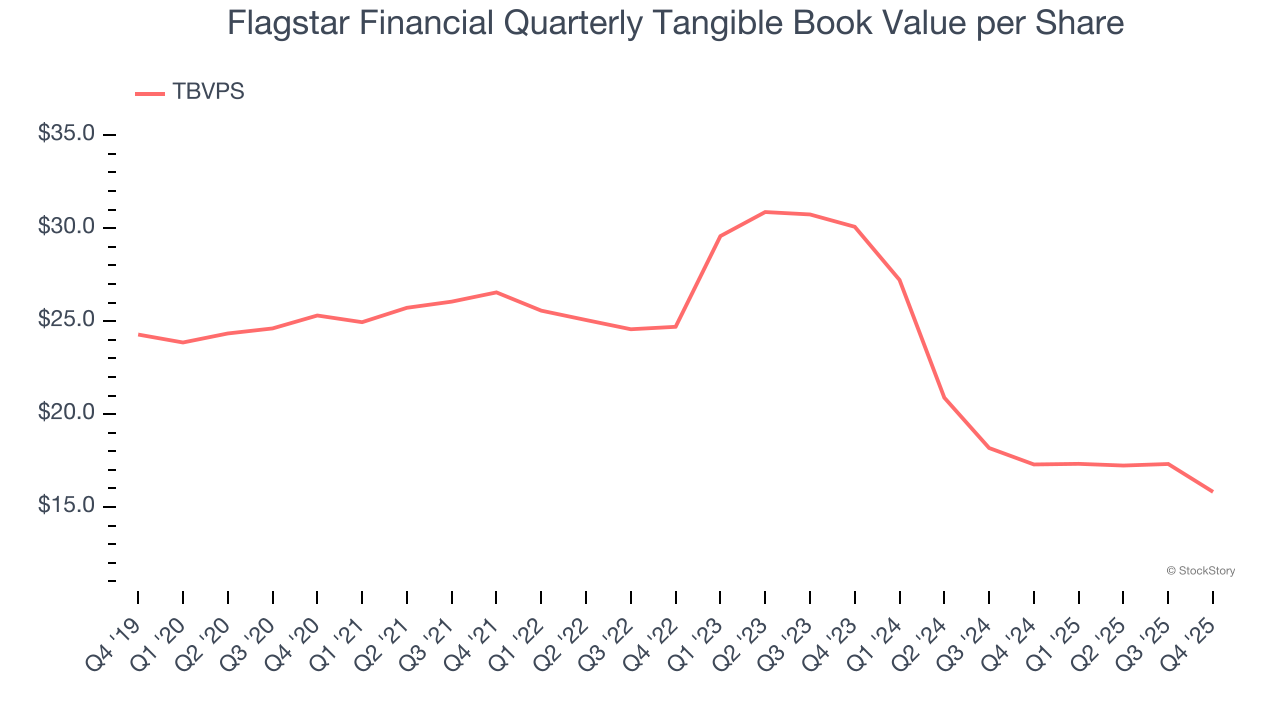
Over the next 12 months, Consensus estimates call for Flagstar Financial’s TBVPS to grow by 6.9% to $16.92, lousy growth rate.
Key Takeaways from Flagstar Financial’s Q4 Results
It was good to see Flagstar Financial beat analysts’ EPS expectations this quarter. We were also glad its revenue outperformed Wall Street’s estimates. On the other hand, its tangible book value per share missed. Zooming out, we think this was a solid print. The stock traded up 2.8% to $13.93 immediately following the results.
Indeed, Flagstar Financial had a rock-solid quarterly earnings result, but is this stock a good investment here? If you’re making that decision, you should consider the bigger picture of valuation, business qualities, as well as the latest earnings. We cover that in our actionable full research report which you can read here (it’s free).