
Water technology company Xylem (NYSE:XYL) beat Wall Street’s revenue expectations in Q4 CY2025, with sales up 6.3% year on year to $2.40 billion. On the other hand, the company’s full-year revenue guidance of $9.15 billion at the midpoint came in 1.9% below analysts’ estimates. Its non-GAAP profit of $1.42 per share was 0.8% above analysts’ consensus estimates.
Is now the time to buy Xylem? Find out by accessing our full research report, it’s free.
Xylem (XYL) Q4 CY2025 Highlights:
- Revenue: $2.40 billion vs analyst estimates of $2.37 billion (6.3% year-on-year growth, 1.1% beat)
- Adjusted EPS: $1.42 vs analyst estimates of $1.41 (0.8% beat)
- Adjusted EBITDA: $557 million vs analyst estimates of $545.9 million (23.2% margin, 2% beat)
- Adjusted EPS guidance for the upcoming financial year 2026 is $5.48 at the midpoint, missing analyst estimates by 1.3%
- Operating Margin: 14.7%, up from 11.8% in the same quarter last year
- Free Cash Flow Margin: 19.2%, down from 21.1% in the same quarter last year
- Organic Revenue rose 7% year on year (beat)
- Market Capitalization: $34.13 billion
“The team delivered an exceptionally strong fourth quarter, capping a year of solid execution and transformation across Xylem,” said Matthew Pine, Xylem’s CEO.
Company Overview
Formed through a spinoff, Xylem (NYSE:XYL) manufactures and services engineered products across a wide variety of applications primarily in the water sector.
Revenue Growth
A company’s long-term performance is an indicator of its overall quality. Any business can have short-term success, but a top-tier one grows for years. Over the last five years, Xylem grew its sales at an excellent 13.1% compounded annual growth rate. Its growth beat the average industrials company and shows its offerings resonate with customers, a helpful starting point for our analysis.
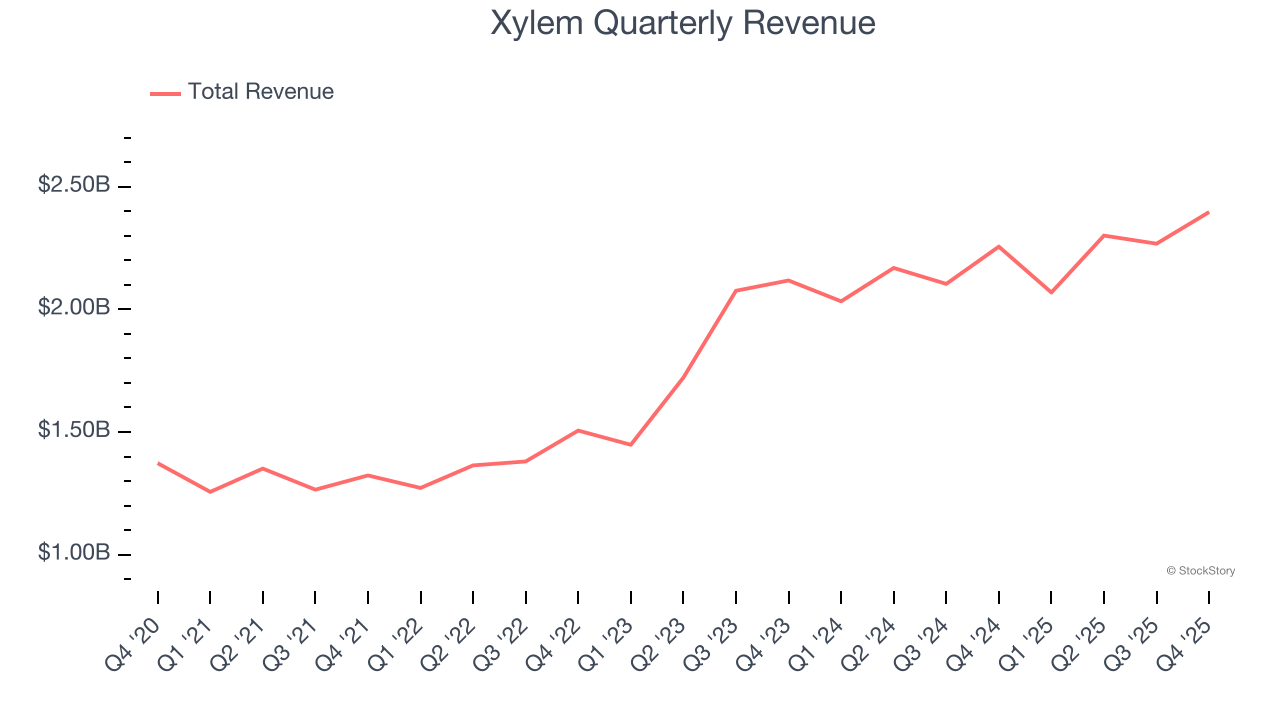
Long-term growth is the most important, but within industrials, a half-decade historical view may miss new industry trends or demand cycles. Xylem’s annualized revenue growth of 10.8% over the last two years is below its five-year trend, but we still think the results suggest healthy demand. 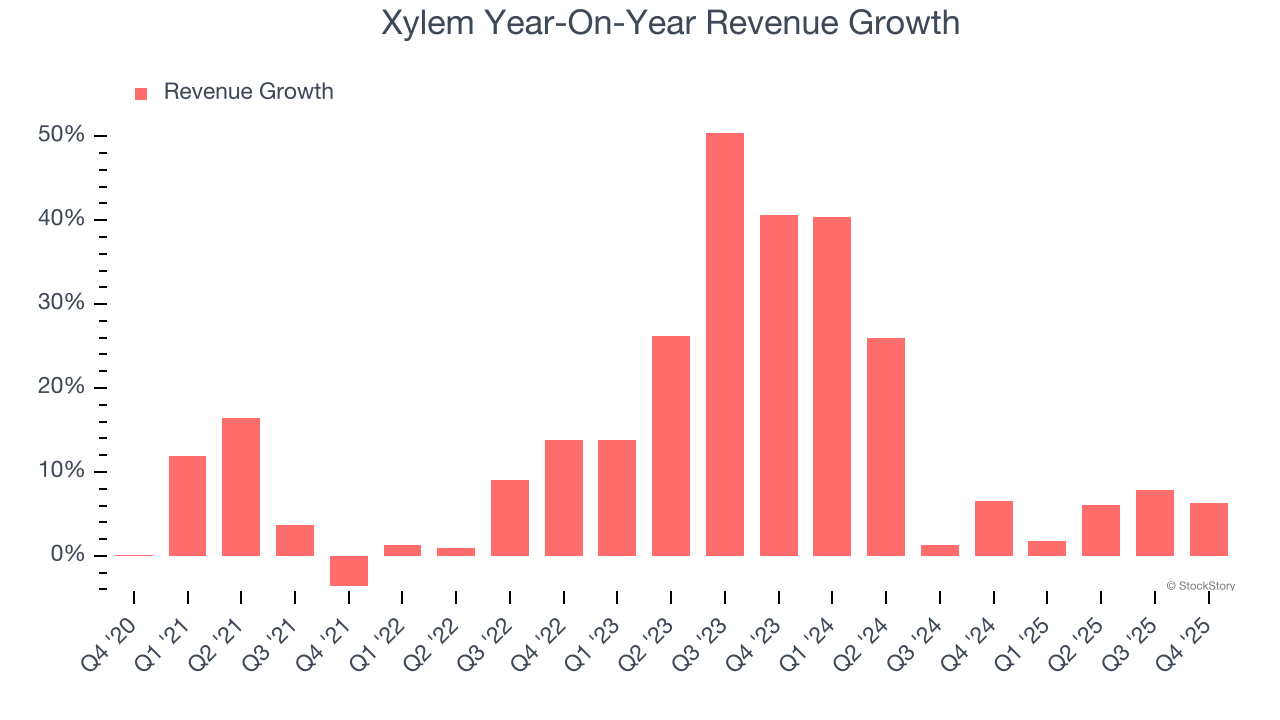
Xylem also reports organic revenue, which strips out one-time events like acquisitions and currency fluctuations that don’t accurately reflect its fundamentals. Over the last two years, Xylem’s organic revenue averaged 5.8% year-on-year growth. Because this number is lower than its two-year revenue growth, we can see that some mixture of acquisitions and foreign exchange rates boosted its headline results. 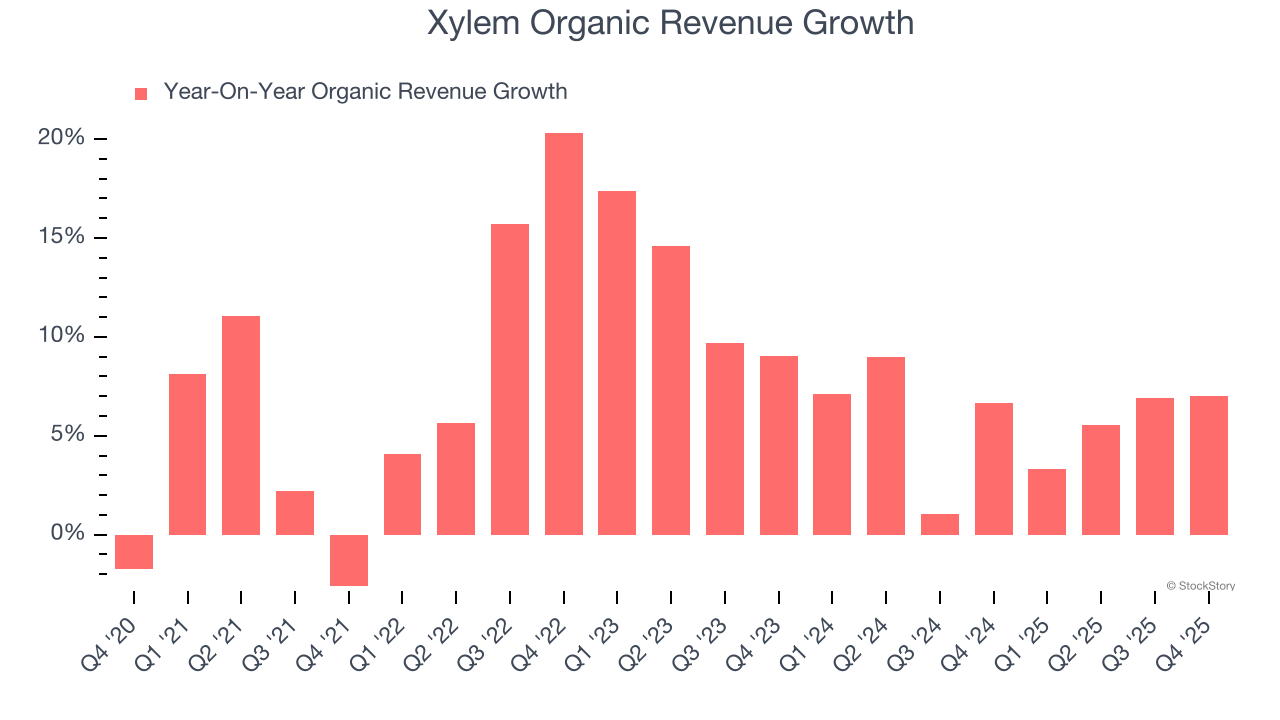
This quarter, Xylem reported year-on-year revenue growth of 6.3%, and its $2.40 billion of revenue exceeded Wall Street’s estimates by 1.1%.
Looking ahead, sell-side analysts expect revenue to grow 3.1% over the next 12 months, a deceleration versus the last two years. This projection doesn't excite us and suggests its products and services will see some demand headwinds. At least the company is tracking well in other measures of financial health.
While Wall Street chases Nvidia at all-time highs, an under-the-radar semiconductor supplier is dominating a critical AI component these giants can’t build without. Click here to access our free report one of our favorites growth stories.
Operating Margin
Operating margin is a key measure of profitability. Think of it as net income - the bottom line - excluding the impact of taxes and interest on debt, which are less connected to business fundamentals.
Xylem has managed its cost base well over the last five years. It demonstrated solid profitability for an industrials business, producing an average operating margin of 11.5%. This result isn’t surprising as its high gross margin gives it a favorable starting point.
Looking at the trend in its profitability, Xylem’s operating margin rose by 2.3 percentage points over the last five years, as its sales growth gave it operating leverage.
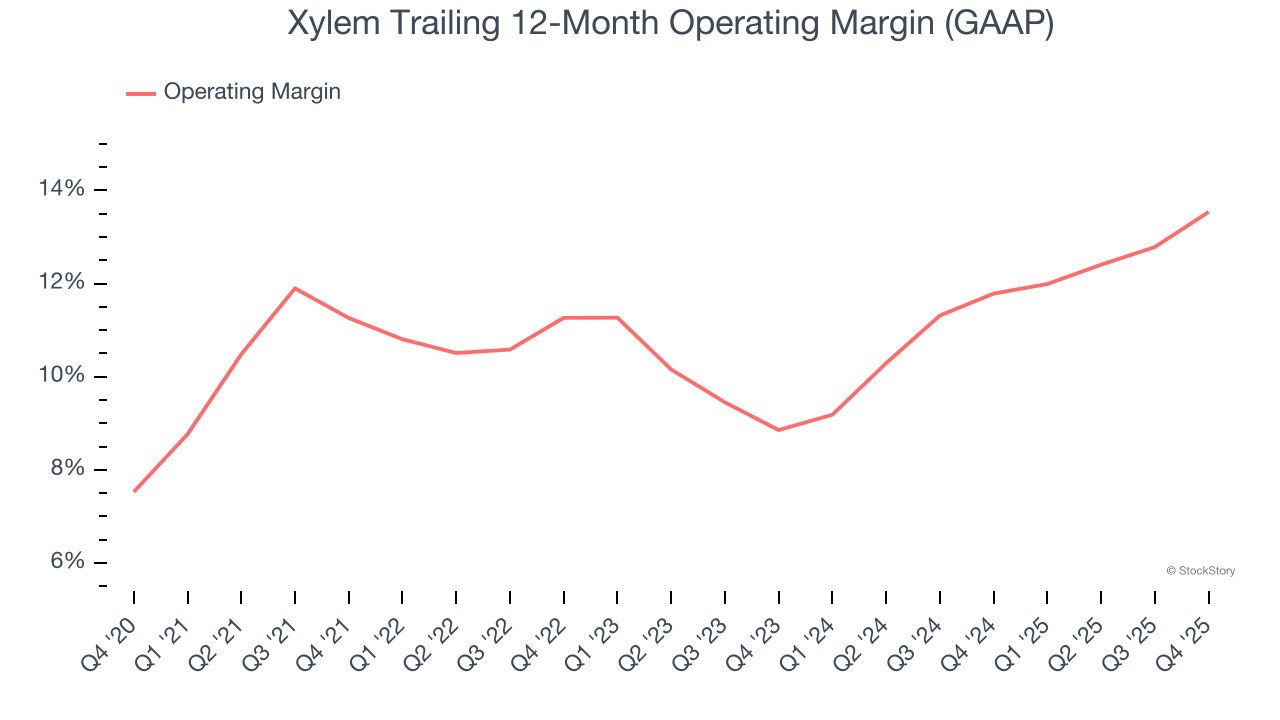
This quarter, Xylem generated an operating margin profit margin of 14.7%, up 2.9 percentage points year on year. The increase was a welcome development and shows its expenses recently grew slower than its revenue, leading to higher efficiency.
Earnings Per Share
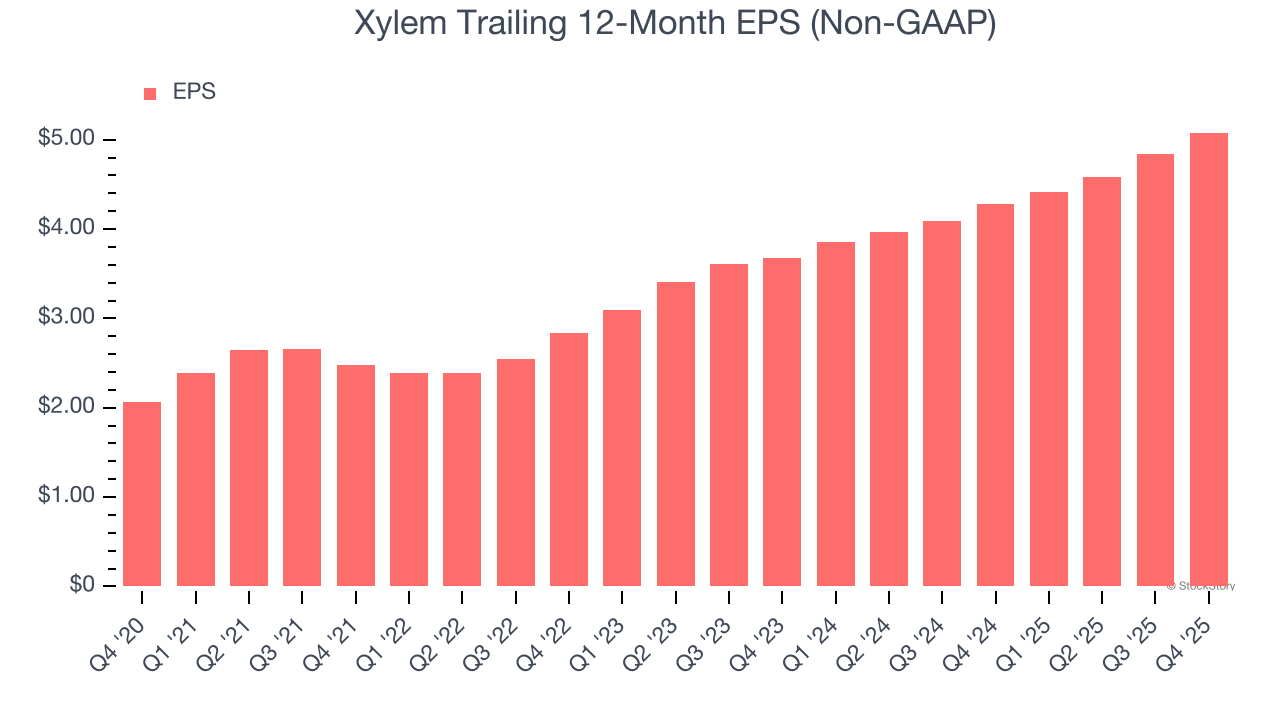
We track the long-term change in earnings per share (EPS) for the same reason as long-term revenue growth. Compared to revenue, however, EPS highlights whether a company’s growth is profitable.
Xylem’s EPS grew at an astounding 19.8% compounded annual growth rate over the last five years, higher than its 13.1% annualized revenue growth. This tells us the company became more profitable on a per-share basis as it expanded.
Diving into the nuances of Xylem’s earnings can give us a better understanding of its performance. As we mentioned earlier, Xylem’s operating margin expanded by 2.3 percentage points over the last five years. This was the most relevant factor (aside from the revenue impact) behind its higher earnings; interest expenses and taxes can also affect EPS but don’t tell us as much about a company’s fundamentals.
Like with revenue, we analyze EPS over a shorter period to see if we are missing a change in the business.
For Xylem, its two-year annual EPS growth of 17.5% was lower than its five-year trend. We still think its growth was good and hope it can accelerate in the future.
In Q4, Xylem reported adjusted EPS of $1.42, up from $1.18 in the same quarter last year. This print was close to analysts’ estimates. Over the next 12 months, Wall Street expects Xylem’s full-year EPS of $5.08 to grow 9%.
Key Takeaways from Xylem’s Q4 Results
We were impressed by how significantly Xylem blew past analysts’ organic revenue expectations this quarter. We were also happy its revenue narrowly outperformed Wall Street’s estimates. On the other hand, its full-year revenue guidance missed and its full-year EPS guidance fell slightly short of Wall Street’s estimates. Overall, this print was mixed. Investors were likely hoping for more, and shares traded down 3.5% to $135.30 immediately after reporting.
So should you invest in Xylem right now? We think that the latest quarter is only one piece of the longer-term business quality puzzle. Quality, when combined with valuation, can help determine if the stock is a buy. We cover that in our actionable full research report which you can read here (it’s free).