Clothing and accessories retailer The Gap (NYSE:GPS) fell short of analysts' expectations in Q2 FY2023, with revenue down 8.01% year on year to $3.55 billion. The company also lowered its full-year revenue guidance but expects some gross margin expansion. Gap made a GAAP profit of $117 million, improving from its loss of $49 million in the same quarter last year.
Is now the time to buy Gap? Find out by accessing our full research report, it's free.
Gap (GPS) Q2 FY2023 Highlights:
- Revenue: $3.55 billion vs analyst estimates of $3.59 billion (1.19% miss)
- EPS: $0.32 vs analyst estimates of $0.09 ($0.23 beat)
- Free Cash Flow of $431 million is up from -$613 million in the same quarter last year
- Gross Margin (GAAP): 37.6%, up from 34.5% in the same quarter last year
- Same-Store Sales were down 6% year on year
- Store Locations: 3,456 at quarter end, increasing by 66 over the last 12 months
"We're seeing encouraging signs of progress, as our teams streamline the way we work so we can focus on growth-driving initiatives – a virtuous cycle that we'll look to become our norm. This means we have to do things differently, with a clear focus on redefining our brands' meaning to consumers, focusing on creativity, designing for relevance as a pursuit rather than a goal, and leveraging our remarkable legacy to shape an exciting new future," said Richard Dickson, President and Chief Executive Officer.
Operating under The Gap, Old Navy, Banana Republic, and Athleta brands, The Gap (NYSE:GPS) is an apparel and accessories retailer that sells its own brand of casual clothing to men, women, and children.
Apparel sales are not driven so much by personal need but by seasons, trends, and innovation, and over the last few decades, the category has shifted meaningfully online. Retailers that once only had brick-and-mortar stores are responding with omnichannel presences. The online shopping experience continues to improve and retail foot traffic in places like shopping malls continues to stall, so the evolution of clothing sellers marches on.
Sales Growth
Gap is larger than most consumer retail companies and benefits from economies of scale, giving it an edge over its competitors.
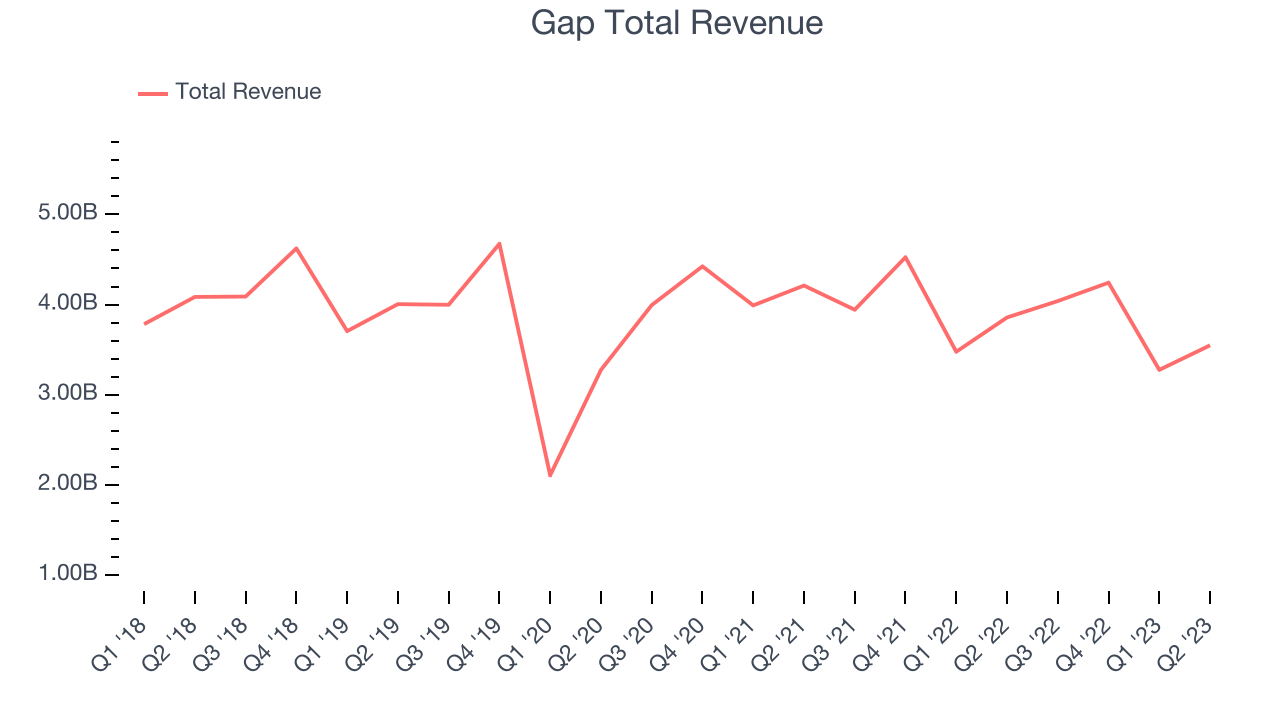
As you can see below, the company's revenue has declined over the last four years, dropping 2.07% annually as its store count has shrunk.

This quarter, Gap reported a rather uninspiring 8.01% year-on-year revenue decline, missing analysts' expectations. Looking ahead, the Wall Street analysts covering the company expect revenue to remain relatively flat over the next 12 months.
The pandemic fundamentally changed several consumer habits. There is a founder-led company that is massively benefiting from this shift. The business has grown astonishingly fast, with 40%+ free cash flow margins. Its fundamentals are undoubtedly best-in-class. Still, the total addressable market is so big that the company has room to grow many times in size. You can find it on our platform for free.
Number of Stores
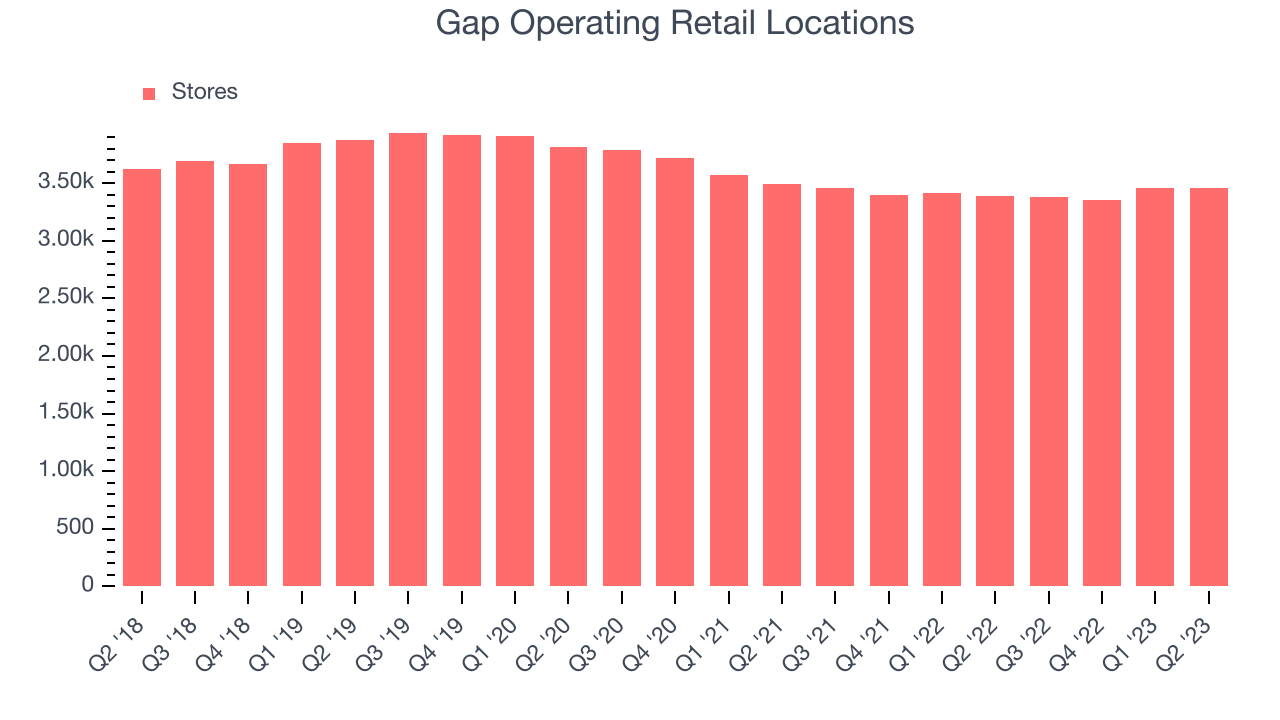
When a retailer like Gap is shuttering stores, it usually means that brick-and-mortar demand is less than supply, and the company is responding by closing underperforming locations and possibly shifting sales online. Gap's store count increased by 66 locations, or 1.95%, over the last 12 months to 3,456 total retail locations in the most recently reported quarter.

Taking a step back, the company has generally closed its stores over the last two years, averaging a 3.13% annual decline in its physical footprint. A smaller store base means that the company must rely on higher foot traffic and sales per customer at its remaining stores as well as e-commerce sales to fuel revenue growth.
Same-Store Sales
A company's same-store sales growth shows the year-on-year change in sales for its brick-and-mortar stores that have been open for at least a year, give or take, and e-commerce platform. This is a key performance indicator for retailers because it measures organic growth and demand.
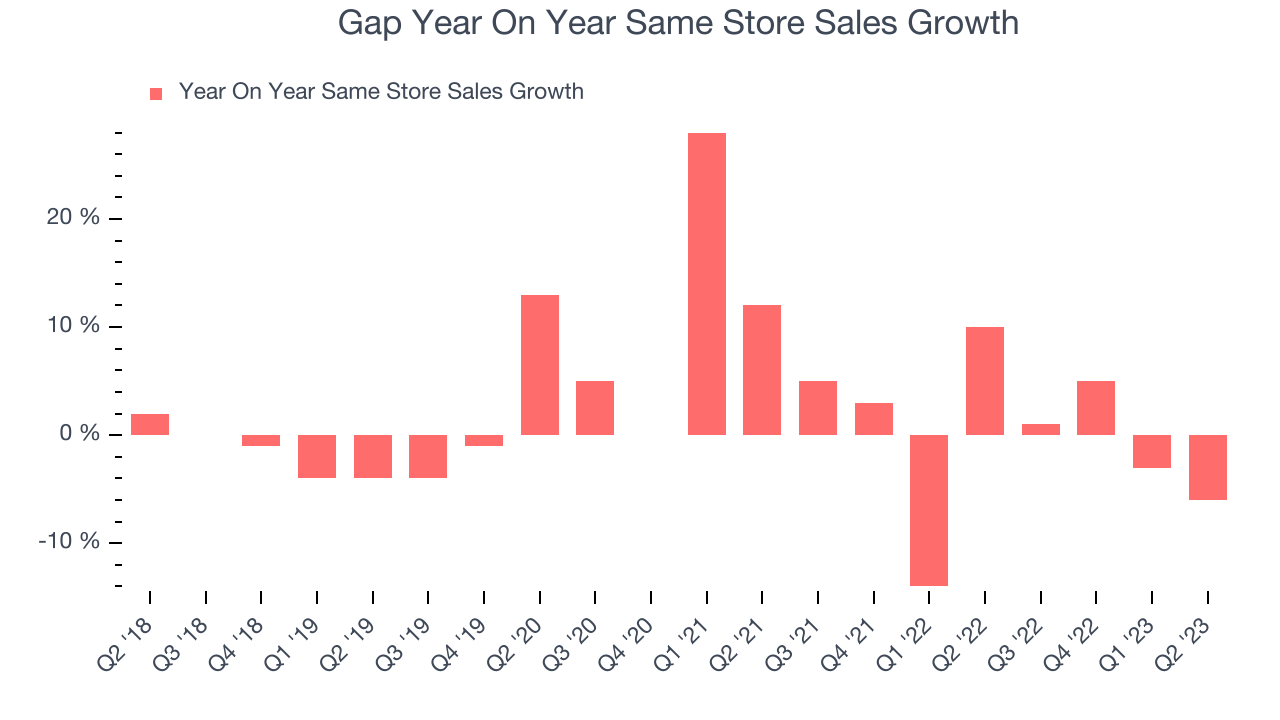
Gap's demand within its existing stores has barely increased over the last eight quarters. On average, the company's same-store sales growth has been flat, or about 0.12% year on year.

In the latest quarter, Gap's same-store sales fell 6% year on year. This decline was a reversal from the 10% year-on-year increase it had posted 12 months ago. A one quarter hiccup isn't material for the long-term prospects of a business, but we'll keep a close eye on the company.
Key Takeaways from Gap's Q2 Results
With a market capitalization of $3.55 billion, Gap is among smaller companies, but its more than $1.35 billion in cash on hand and near break-even free cash flow margins put it in a stable financial position.
We were impressed by how significantly Gap blew past analysts' EPS and free cash flow expectations this quarter. That really stood out as a positive in these results. On the other hand, the company's revenue missed analysts' expectations and it lowered its full-year revenue guidance, although Gap does expect its gross margin to improve. Overall, this was a mixed quarter. The stock is up 2.31% after reporting and currently trades at $9.75 per share.
So should you invest in Gap right now? When making that decision, it's important to consider its valuation, business qualities, as well as what has happened in the latest quarter. We cover that in our actionable full research report which you can read here, it's free.
One way to find opportunities in the market is to watch for generational shifts in the economy. Almost every company is slowly finding itself becoming a technology company and facing cybersecurity risks and as a result, the demand for cloud-native cybersecurity is skyrocketing. This company is leading a massive technological shift in the industry and with revenue growth of 50% year on year and best-in-class SaaS metrics it should definitely be on your radar.
The author has no position in any of the stocks mentioned in this report.
