Industrial processing equipment and solutions provider Hillenbrand (NYSE:HI) fell short of analysts' expectations in Q2 CY2024, with revenue up 9.8% year on year to $786.6 million. The company's full-year revenue guidance of $3.15 billion at the midpoint also came in 3.4% below analysts' estimates. It made a GAAP loss of $3.53 per share, down from its profit of $0.61 per share in the same quarter last year.
Is now the time to buy Hillenbrand? Find out by accessing our full research report, it's free.
Hillenbrand (HI) Q2 CY2024 Highlights:
- Revenue: $786.6 million vs analyst estimates of $818.1 million (3.9% miss)
- EPS: -$3.53 vs analyst estimates of $0.51 (-$4.04 miss due to an impairment charge)
- The company dropped its revenue guidance for the full year from $3.27 billion to $3.15 billion at the midpoint, a 3.7% decrease
- EBITDA guidance for the full year is $507 million at the midpoint, below analyst estimates of $518.9 million
- Gross Margin (GAAP): 33.9%, in line with the same quarter last year
- EBITDA Margin: 16.7%, up from 14.5% in the same quarter last year
- Market Capitalization: $2.75 billion
"We're pleased with our progress in executing our strategy during the quarter in light of a tougher than expected macro environment. Our FPM integration continued to progress well and exceeded our expectations for margin performance. However, due to the challenging macro environment, we experienced significantly lower than expected orders and revenue in our Advanced Process Solutions segment. This level of performance was primarily due to continued customer project delays, which became more widespread throughout the quarter given ongoing concerns around interest rates, inflation, and broader macroeconomic uncertainty," said Kim Ryan, President and Chief Executive Officer of Hillenbrand.
Hillenbrand, Inc. (NYSE: HI) is an industrial company that designs, manufactures, and sells highly engineered processing equipment and solutions for various industries.
General Industrial Machinery
Automation that increases efficiency and connected equipment that collects analyzable data have been trending, creating new demand for general industrial machinery companies. Those who innovate and create digitized solutions can spur sales and speed up replacement cycles, but all general industrial machinery companies are still at the whim of economic cycles. Consumer spending and interest rates, for example, can greatly impact the industrial production that drives demand for these companies’ offerings.
Sales Growth
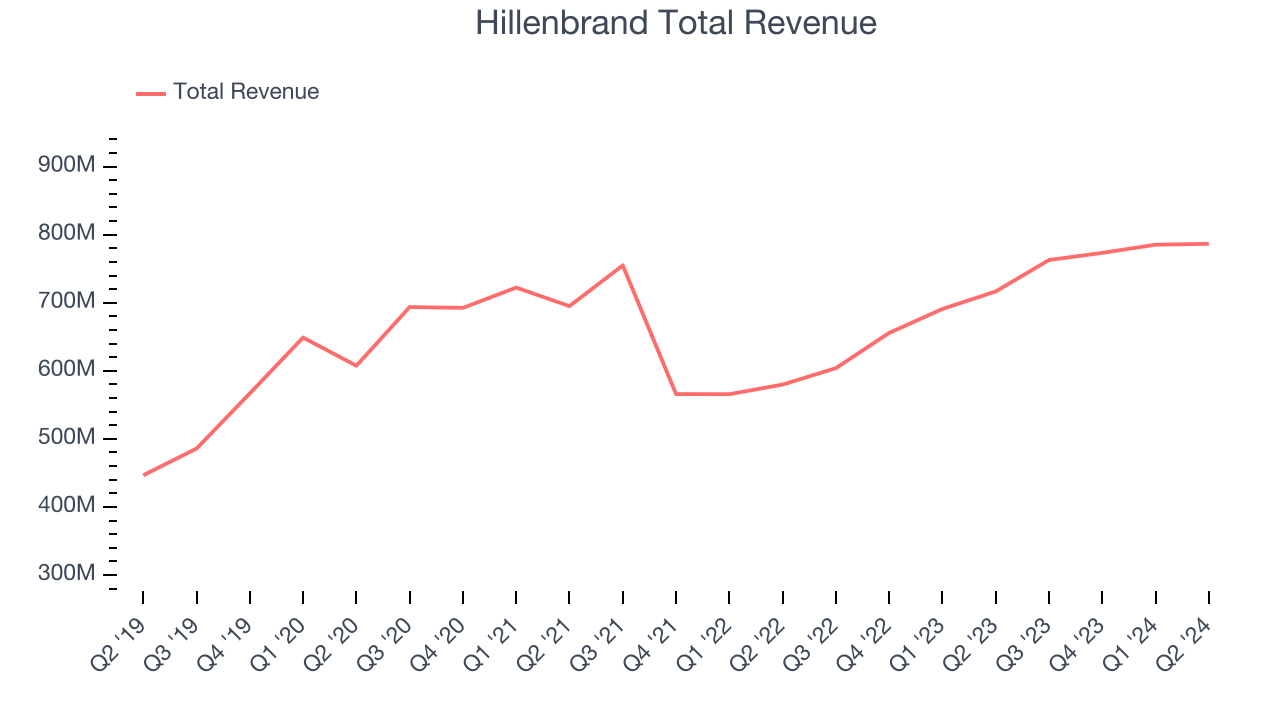
Reviewing a company's long-term performance can reveal insights into its business quality. Any business can have short-term success, but a top-tier one tends to sustain growth for years. Luckily, Hillenbrand's sales grew at an excellent 12.2% compounded annual growth rate over the last five years. This shows it expanded quickly, a useful starting point for our analysis. 
Long-term growth is the most important, but within industrials, a half-decade historical view may miss new industry trends or demand cycles. Hillenbrand's annualized revenue growth of 12.3% over the last two years aligns with its five-year trend, suggesting its demand was predictably strong.
This quarter, Hillenbrand's revenue grew 9.8% year on year to $786.6 million, missing Wall Street's estimates. Looking ahead, Wall Street expects sales to grow 8% over the next 12 months, a deceleration from this quarter.
Here at StockStory, we certainly understand the potential of thematic investing. Diverse winners from Microsoft (MSFT) to Alphabet (GOOG), Coca-Cola (KO) to Monster Beverage (MNST) could all have been identified as promising growth stories with a megatrend driving the growth. So, in that spirit, we’ve identified a relatively under-the-radar profitable growth stock benefitting from the rise of AI, available to you FREE via this link.
Operating Margin
Operating margin is a key measure of profitability. Think of it as net income–the bottom line–excluding the impact of taxes and interest on debt, which are less connected to business fundamentals.
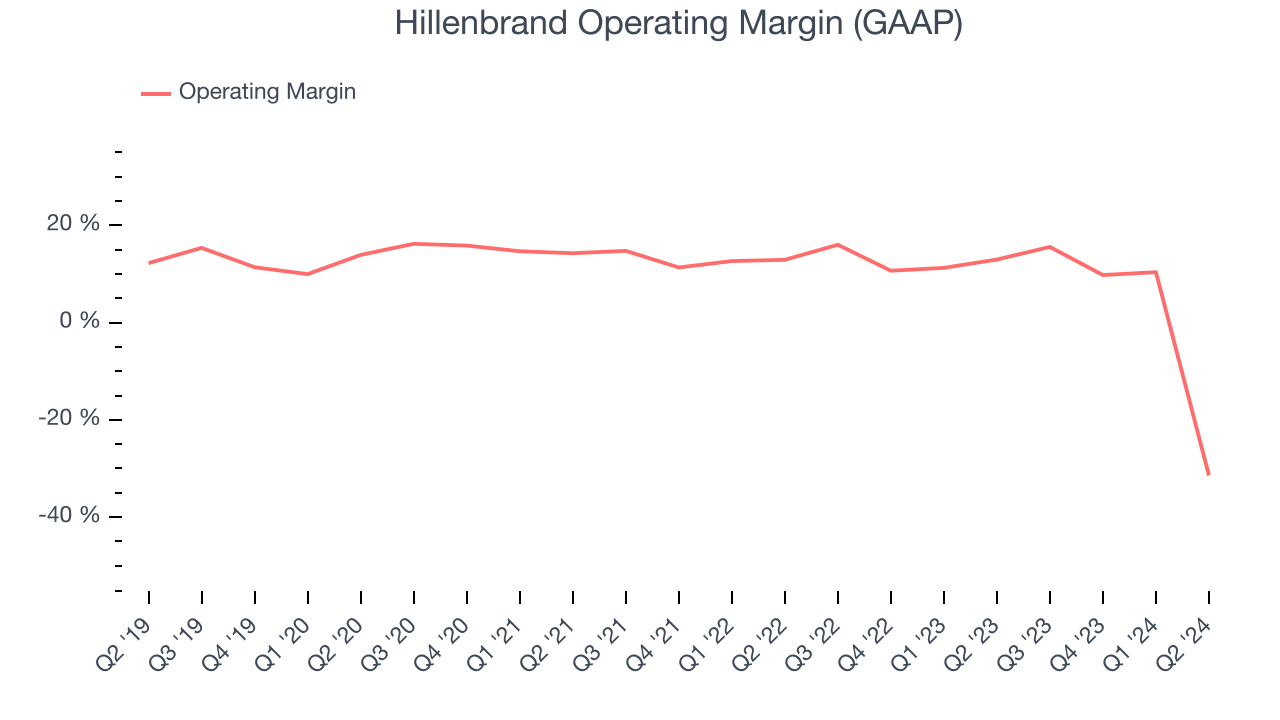
Hillenbrand has managed its expenses well over the last five years. It demonstrated solid profitability for an industrials business, producing an average operating margin of 10.5%. This result isn't too surprising as its gross margin gives it a favorable starting point.
Looking at the trend in its profitability, Hillenbrand's annual operating margin decreased by 11.6 percentage points over the last five years. Even though its margin is still high, shareholders will want to see Hillenbrand become more profitable in the future.

This quarter, Hillenbrand generated an operating profit margin of negative 31.4%, down 44.3 percentage points year on year due to an impairment charge. Since Hillenbrand's operating margin decreased more than its gross margin, we can assume the company was recently less efficient because expenses such as sales, marketing, R&D, and administrative overhead increased.
EPS
Analyzing long-term revenue trends tells us about a company's historical growth, but the long-term change in its earnings per share (EPS) points to the profitability of that growth–for example, a company could inflate its sales through excessive spending on advertising and promotions.
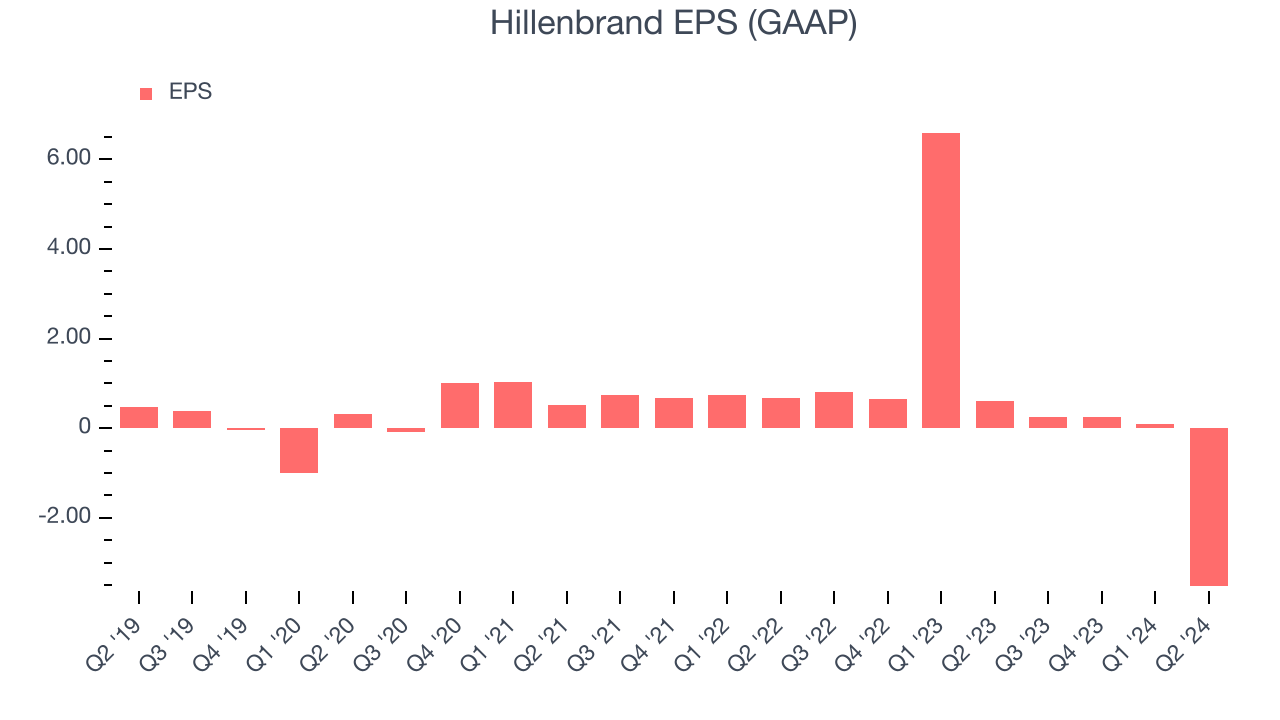
Sadly for Hillenbrand, its EPS declined by 32.5% annually over the last five years while its revenue grew by 12.2%. This tells us the company became less profitable on a per-share basis as it expanded.

We can take a deeper look into Hillenbrand's earnings to better understand the drivers of its performance. As we mentioned earlier, Hillenbrand's operating margin declined by 11.6 percentage points over the last five years. This was the most relevant factor (aside from the revenue impact) behind its lower earnings; taxes and interest expenses can also affect EPS but don't tell us as much about a company's fundamentals.
Like with revenue, we also analyze EPS over a more recent period because it can give insight into an emerging theme or development for the business. For Hillenbrand, its two-year annual EPS declines of 74.4% show its recent history was to blame for its underperformance over the last five years. These results were bad no matter how you slice the data.
In Q2, Hillenbrand reported EPS at negative $3.53, down from $0.61 in the same quarter last year due to an impairment charge. This print missed analysts' estimates. Over the next 12 months, Wall Street is optimistic. Analysts are projecting Hillenbrand's EPS of negative $2.94 in the last year to flip to positive $2.66.
Key Takeaways from Hillenbrand's Q2 Results
We struggled to find many strong positives in these results. Its full-year revenue guidance missed and its revenue fell short of Wall Street's estimates. This quarter featured some positives but overall could have been better. The stock remained flat at $38.01 immediately following the results.
Hillenbrand may have had a tough quarter, but does that actually create an opportunity to invest right now? When making that decision, it's important to consider its valuation, business qualities, as well as what has happened in the latest quarter. We cover that in our actionable full research report which you can read here, it's free.
