Campbell's (CPB)
We wouldn’t recommend Campbell's. Its poor sales growth and falling returns on capital suggest its growth opportunities are shrinking.― StockStory Analyst Team
1. News
2. Summary
Why We Think Campbell's Will Underperform
With its iconic canned soup as its cornerstone product, Campbell's (NASDAQ:CPB) is a packaged food company with an illustrious portfolio of brands.
- Sales are projected to tank by 2.6% over the next 12 months as demand evaporates
- Core business is underperforming as its organic revenue has disappointed over the past two years, suggesting it might need acquisitions to stimulate growth
- Annual sales growth of 3% over the last three years lagged behind its consumer staples peers as its large revenue base made it difficult to generate incremental demand


Campbell’s quality doesn’t meet our bar. We see more attractive opportunities in the market.
Why There Are Better Opportunities Than Campbell's


Campbell’s stock price of $21.71 implies a valuation ratio of 9.9x forward P/E. Campbell’s valuation may seem like a bargain, but we think there are valid reasons why it’s so cheap.
Our advice is to pay up for elite businesses whose advantages are tailwinds to earnings growth. Don’t get sucked into lower-quality businesses just because they seem like bargains. These mediocre businesses often never achieve a higher multiple as hoped, a phenomenon known as a “value trap”.
3. Campbell's (CPB) Research Report: Q4 CY2025 Update
Packaged food company Campbell's (NASDAQ:CPB) fell short of the market’s revenue expectations in Q4 CY2025, with sales falling 4.5% year on year to $2.56 billion. Its non-GAAP profit of $0.51 per share was 10.6% below analysts’ consensus estimates.
Campbell's (CPB) Q4 CY2025 Highlights:
- Revenue: $2.56 billion vs analyst estimates of $2.61 billion (4.5% year-on-year decline, 1.6% miss)
- Adjusted EPS: $0.51 vs analyst expectations of $0.57 (10.6% miss)
- Adjusted EBITDA: $362 million vs analyst estimates of $407.2 million (14.1% margin, 11.1% miss)
- Management lowered its full-year Adjusted EPS guidance to $2.20 at the midpoint, a 11.1% decrease
- Operating Margin: 10.6%, down from 12.2% in the same quarter last year
- Free Cash Flow Margin: 16.2%, similar to the same quarter last year
- Organic Revenue fell 3% year on year (miss)
- Sales Volumes fell 4% year on year (0% in the same quarter last year)
- Market Capitalization: $7.36 billion
Company Overview
With its iconic canned soup as its cornerstone product, Campbell's (NASDAQ:CPB) is a packaged food company with an illustrious portfolio of brands.
That red and white can of soup goes beyond the kitchen cupboard–it is instantly-recognizable and has been featured in famous pop art. Campbell's traces its roots back to 1869, when its two co-founders teamed up in Camden, New Jersey to create a business focused on canned vegetables, soups, and minced meats. In 1897, the company invented a method of condensing soup, which allowed it to be packaged into smaller cans and shipped at a lower cost. This was revolutionary and allowed Campbell's to dominate the soup market.
Through both internal development and acquisitions, Campbell's expanded its portfolio beyond soups. Today, Pepperidge Farm (breads and snacks), V8 (vegetable and fruit juices), Cape Cod (potato chips), Snyder’s (pretzels), and others are part of the Campbell's family of brands.
Campbell's boasts many brands and products, but at the heart of it, the company caters to middle-income households seeking convenience. The heads or caretakers of these households are usually busy and don’t have the time to cook meals or prepare snacks from scratch. The products themselves add convenience to everyday life, and they are also convenient to find. Ubiquitous retailers such as supermarkets, mass merchants, drug stores, and specialty stores sell Campbell's products. Given the company’s scale and traffic-driving brands, Campbell's often has prominent placement on retailer shelves.
4. Shelf-Stable Food
As America industrialized and moved away from an agricultural economy, people faced more demands on their time. Packaged foods emerged as a solution offering convenience to the evolving American family, whether it be canned goods or snacks. Today, Americans seek brands that are high in quality, reliable, and reasonably priced. Furthermore, there's a growing emphasis on health-conscious and sustainable food options. Packaged food stocks are considered resilient investments. People always need to eat, so these companies can enjoy consistent demand as long as they stay on top of changing consumer preferences. The industry spans from multinational corporations to smaller specialized firms and is subject to food safety and labeling regulations.
Competitors in packaged food include Mondelez (NASDAQ:MDLZ), Kraft Heinz (NASDAQ:KHC), and Nestle (SWX:NESN).
5. Revenue Growth
Reviewing a company’s long-term sales performance reveals insights into its quality. Any business can have short-term success, but a top-tier one grows for years.
With $10.04 billion in revenue over the past 12 months, Campbell's is one of the larger consumer staples companies and benefits from a well-known brand that influences purchasing decisions. However, its scale is a double-edged sword because there are only so many big store chains to sell into, making it harder to find incremental growth. To accelerate sales, Campbell's likely needs to optimize its pricing or lean into new products and international expansion.
As you can see below, Campbell's grew its sales at a sluggish 3% compounded annual growth rate over the last three years as consumers bought less of its products. We’ll explore what this means in the "Volume Growth" section.
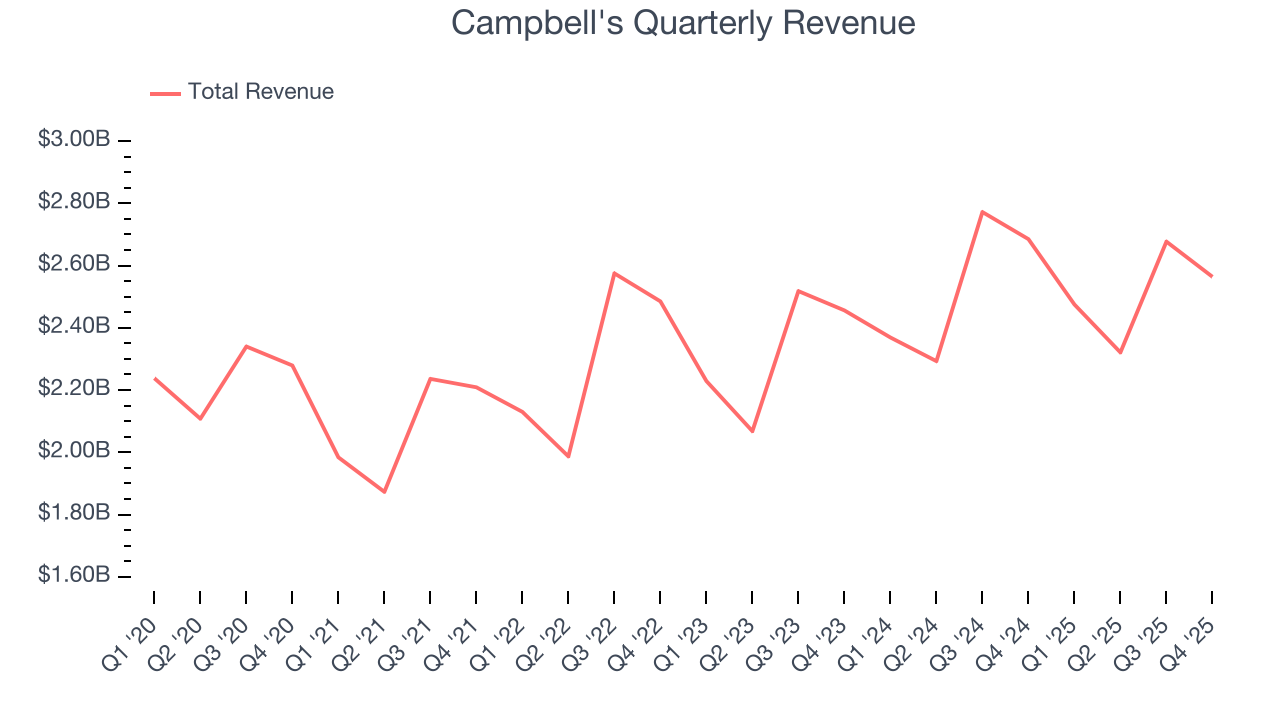
This quarter, Campbell's missed Wall Street’s estimates and reported a rather uninspiring 4.5% year-on-year revenue decline, generating $2.56 billion of revenue.
Looking ahead, sell-side analysts expect revenue to decline by 1.2% over the next 12 months, a deceleration versus the last three years. This projection is underwhelming and indicates its products will see some demand headwinds.
6. Volume Growth
Revenue growth can be broken down into changes in price and volume (the number of units sold). While both are important, volume is the lifeblood of a successful staples business as there’s a ceiling to what consumers will pay for everyday goods; they can always trade down to non-branded products if the branded versions are too expensive.
To analyze whether Campbell's generated its growth (or lack thereof) from changes in price or volume, we can compare its volume growth to its organic revenue growth, which excludes non-fundamental impacts on company financials like mergers and currency fluctuations.
Over the last two years, Campbell’s average quarterly volumes have shrunk by 1%. This isn’t ideal for a consumer staples company, where demand is typically stable. In the context of its 1.2% average organic sales declines, we can see that most of the company’s losses have come from fewer customers purchasing its products.
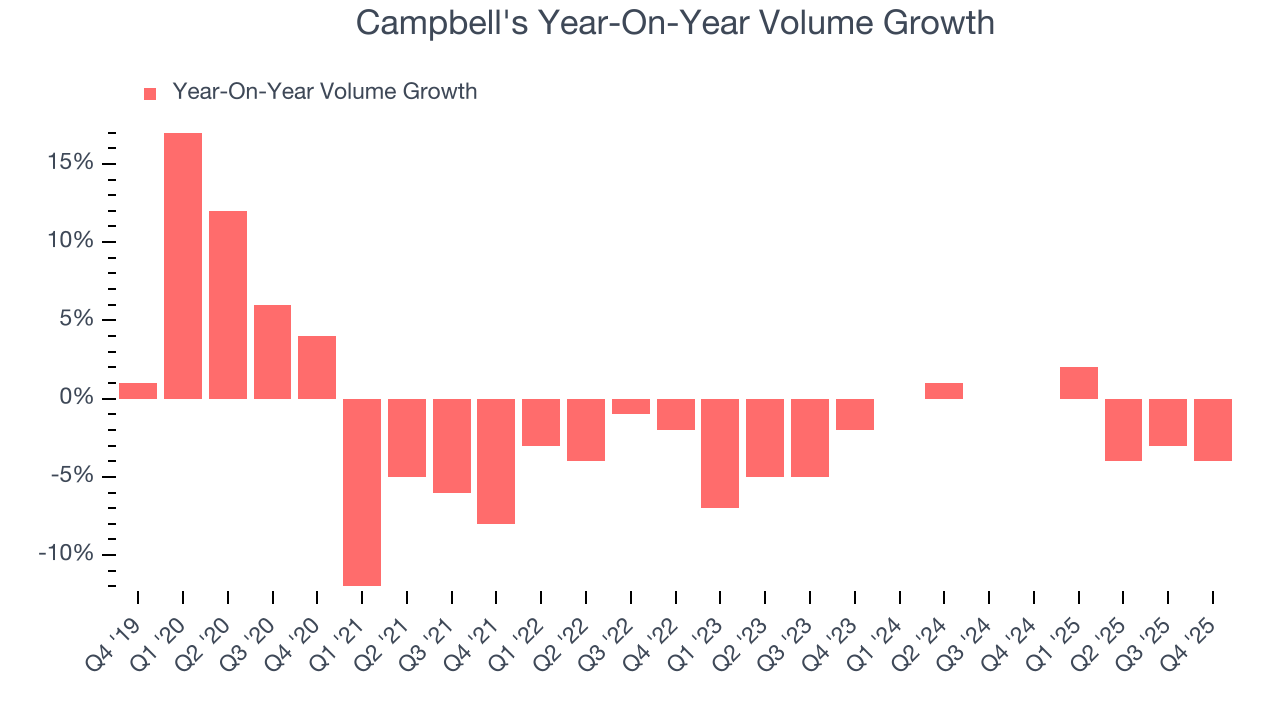
In Campbell’s Q4 2026, sales volumes dropped 4% year on year. This result represents a further deceleration from its historical levels, showing the business is struggling to move its products.
7. Gross Margin & Pricing Power
Campbell’s unit economics are higher than the typical consumer staples company, giving it the flexibility to invest in areas such as marketing and talent to reach more consumers. As you can see below, it averaged a decent 30.3% gross margin over the last two years. Said differently, Campbell's paid its suppliers $69.68 for every $100 in revenue. 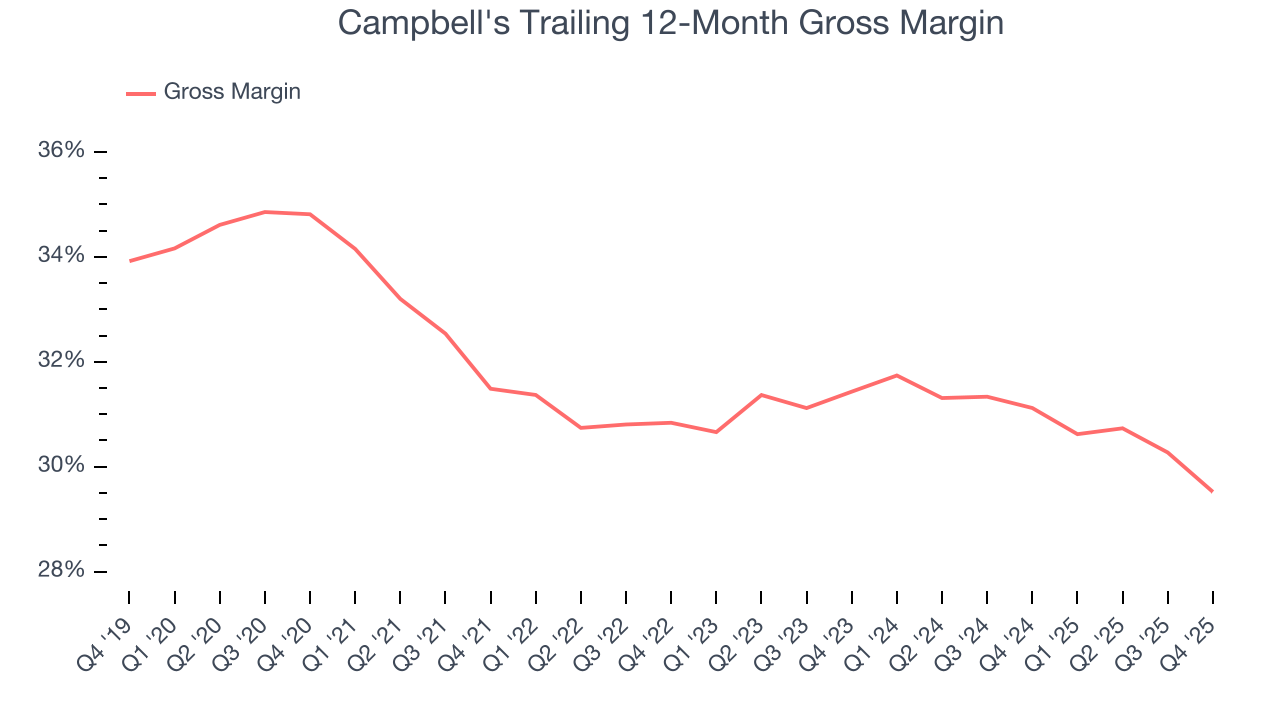
Campbell's produced a 28% gross profit margin in Q4, down 2.9 percentage points year on year. Campbell’s full-year margin has also been trending down over the past 12 months, decreasing by 1.6 percentage points. If this move continues, it could suggest a more competitive environment with some pressure to lower prices and higher input costs (such as raw materials and manufacturing expenses).
8. Operating Margin
Campbell’s operating margin has generally stayed the same over the last 12 months, averaging 10.2% over the last two years. This profitability was higher than the broader consumer staples sector, showing it did a decent job managing its expenses.
Looking at the trend in its profitability, Campbell’s operating margin might fluctuated slightly but has generally stayed the same over the last year. This raises questions about the company’s expense base because its revenue growth should have given it leverage on its fixed costs, resulting in better economies of scale and profitability.
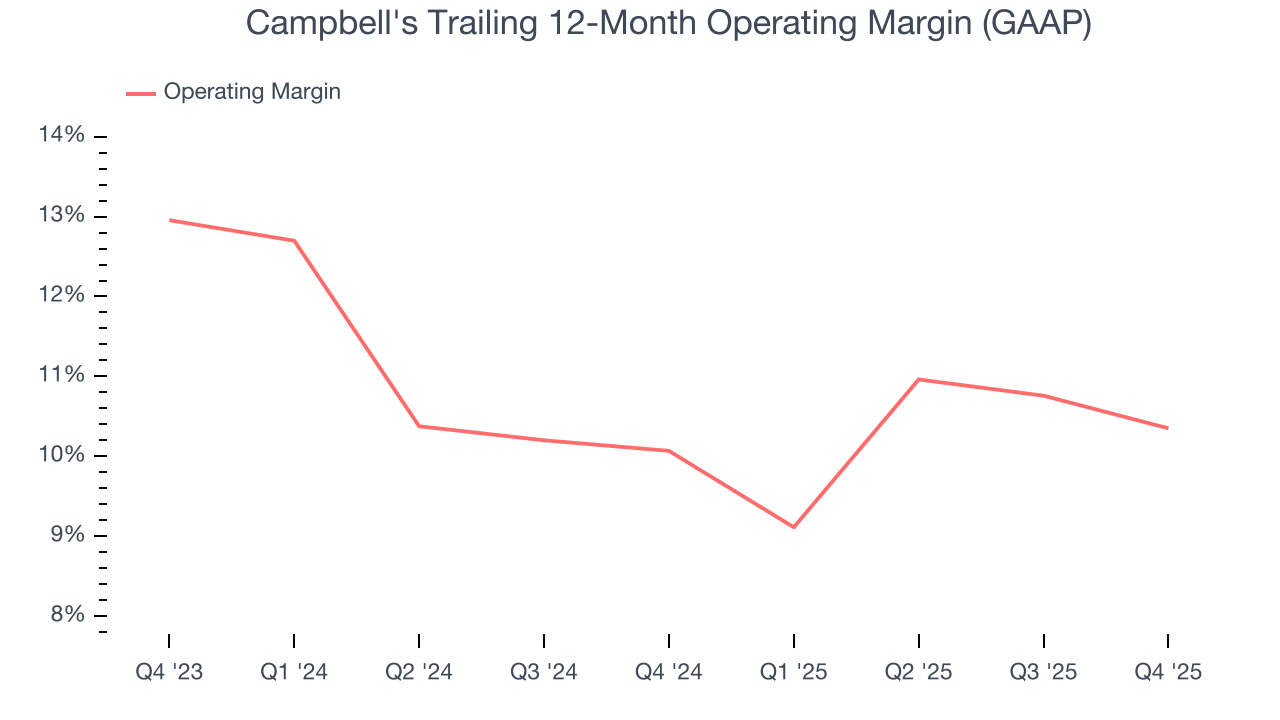
In Q4, Campbell's generated an operating margin profit margin of 10.6%, down 1.5 percentage points year on year. Since Campbell’s gross margin decreased more than its operating margin, we can assume its recent inefficiencies were driven more by weaker leverage on its cost of sales rather than increased marketing, and administrative overhead expenses.
9. Earnings Per Share
We track the long-term change in earnings per share (EPS) for the same reason as long-term revenue growth. Compared to revenue, however, EPS highlights whether a company’s growth is profitable.
Sadly for Campbell's, its EPS declined by 5.1% annually over the last three years while its revenue grew by 3%. This tells us the company became less profitable on a per-share basis as it expanded.
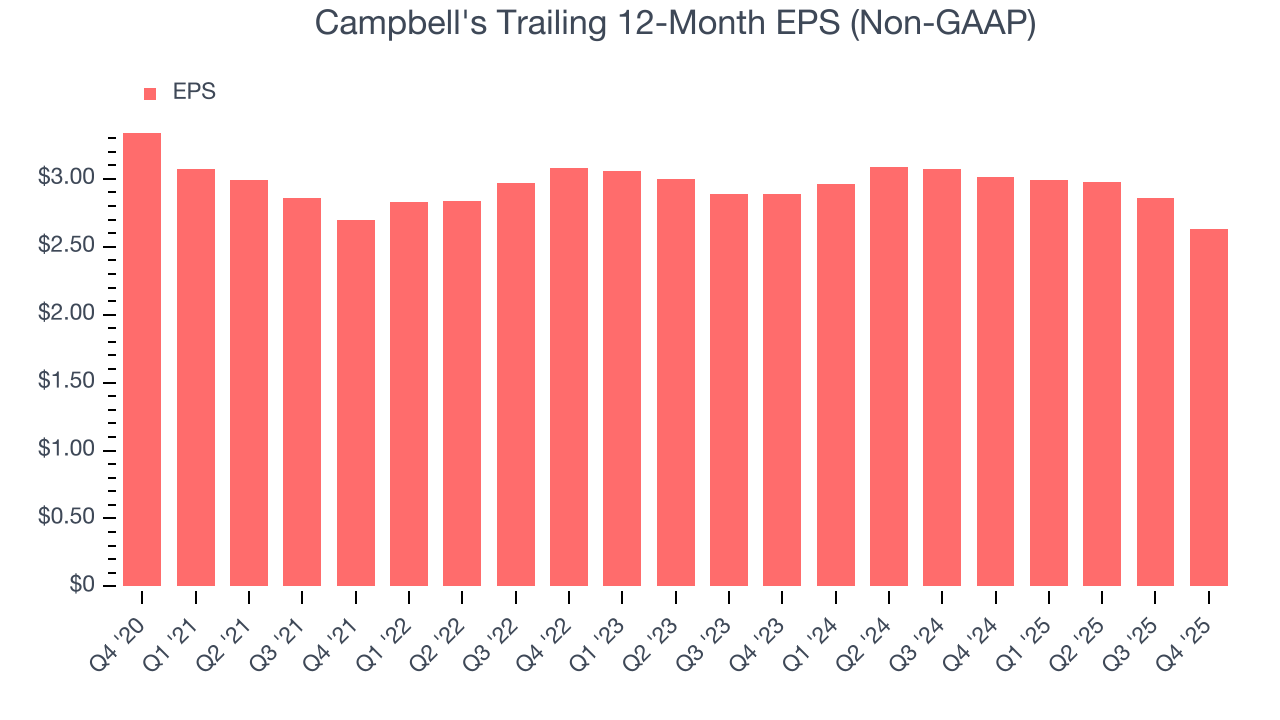
In Q4, Campbell's reported adjusted EPS of $0.51, down from $0.74 in the same quarter last year. This print missed analysts’ estimates. Over the next 12 months, Wall Street expects Campbell’s full-year EPS of $2.63 to shrink by 6.1%.
10. Cash Is King
Free cash flow isn't a prominently featured metric in company financials and earnings releases, but we think it's telling because it accounts for all operating and capital expenses, making it tough to manipulate. Cash is king.
Campbell's has shown impressive cash profitability, giving it the option to reinvest or return capital to investors. The company’s free cash flow margin averaged 7.3% over the last two years, better than the broader consumer staples sector.
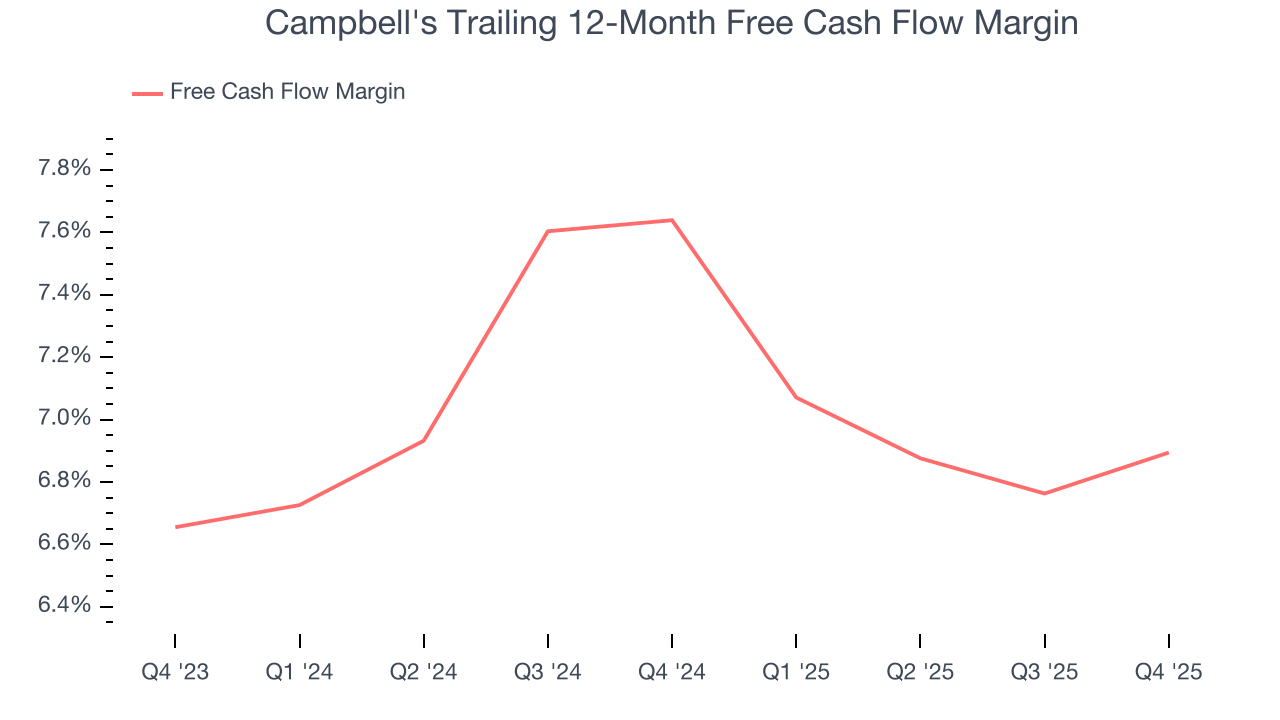
Campbell’s free cash flow clocked in at $416 million in Q4, equivalent to a 16.2% margin. This cash profitability was in line with the comparable period last year and above its two-year average.
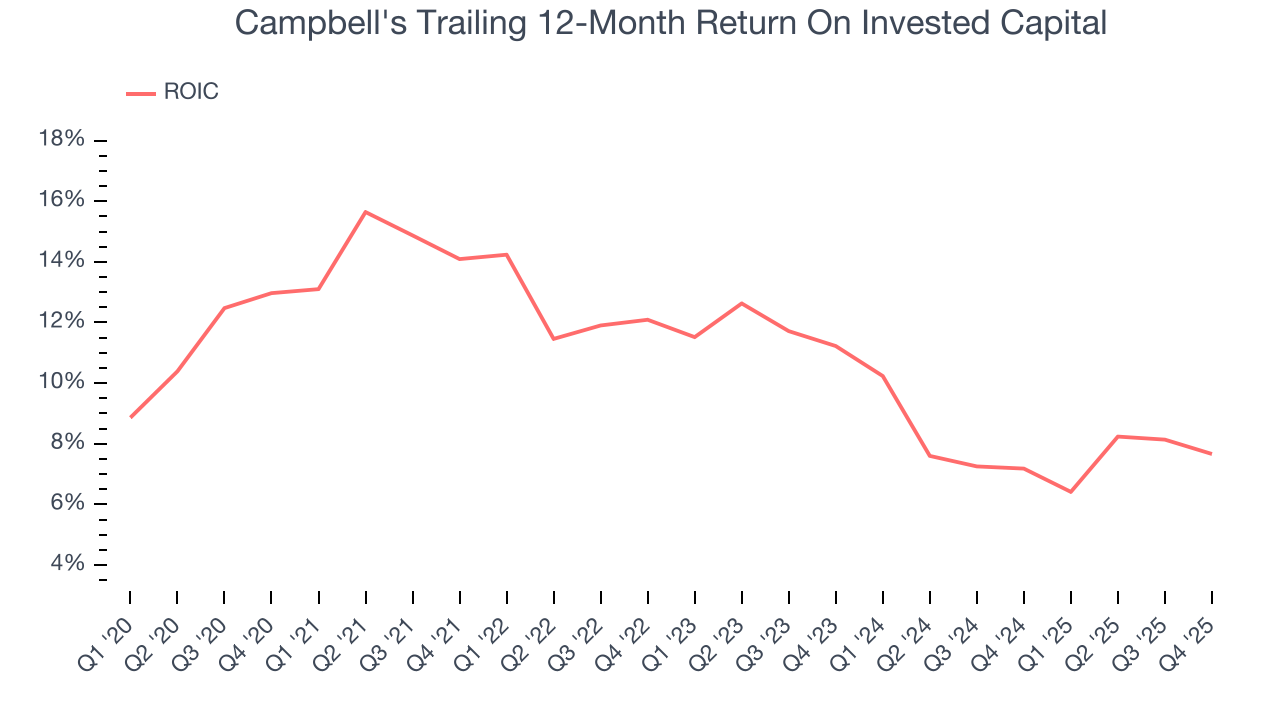
11. Return on Invested Capital (ROIC)
EPS and free cash flow tell us whether a company was profitable while growing its revenue. But was it capital-efficient? A company’s ROIC explains this by showing how much operating profit it makes compared to the money it has raised (debt and equity).
Campbell’s management team makes decent investment decisions and generates value for shareholders. Its five-year average ROIC was 10.5%, slightly better than typical consumer staples business.
12. Balance Sheet Assessment
Campbell's reported $561 million of cash and $7.08 billion of debt on its balance sheet in the most recent quarter. As investors in high-quality companies, we primarily focus on two things: 1) that a company’s debt level isn’t too high and 2) that its interest payments are not excessively burdening the business.
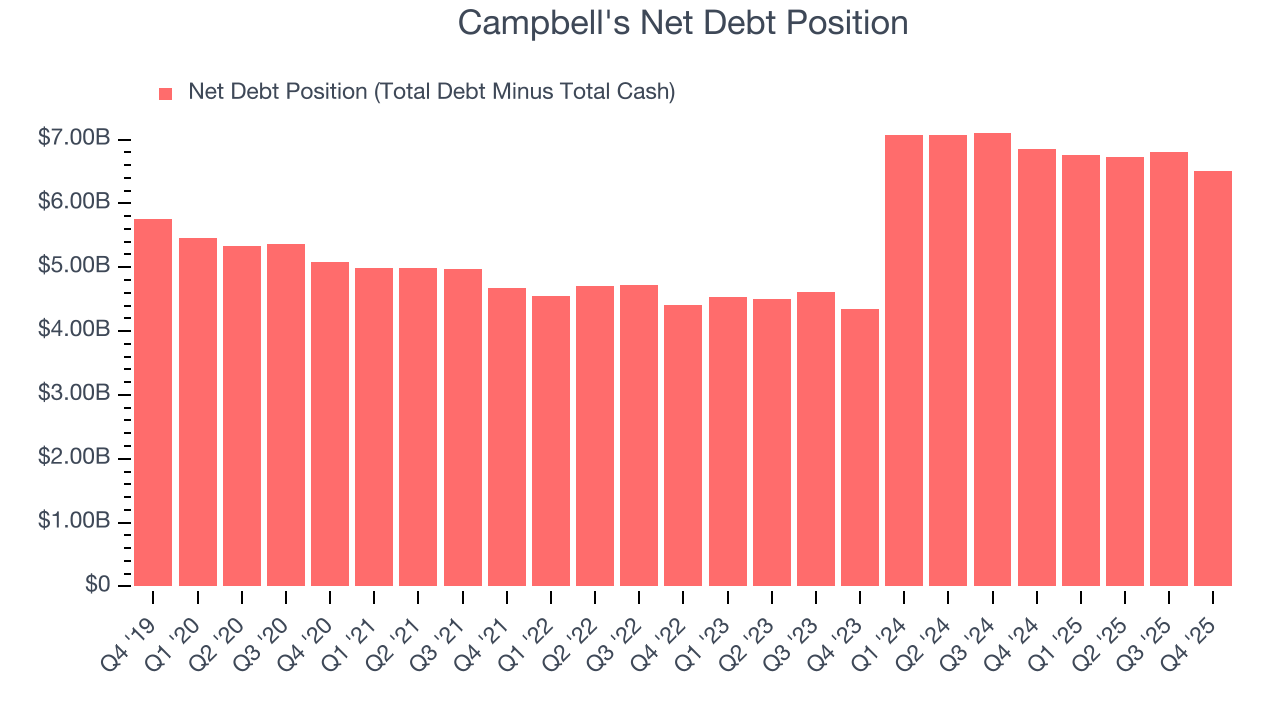
With $1.74 billion of EBITDA over the last 12 months, we view Campbell’s 3.7× net-debt-to-EBITDA ratio as safe. We also see its $165 million of annual interest expenses as appropriate. The company’s profits give it plenty of breathing room, allowing it to continue investing in growth initiatives.
13. Key Takeaways from Campbell’s Q4 Results
We struggled to find many positives in these results. Its revenue missed and its EPS fell short of Wall Street’s estimates. The company also lowered full-year EPS guidance, which is usually a bad sign regarding business momentum (or lack thereof). Overall, this was a weaker quarter. The stock traded down 6.2% to $23.16 immediately following the results.
14. Is Now The Time To Buy Campbell's?
Updated: March 15, 2026 at 10:50 PM EDT
We think that the latest earnings result is only one piece of the bigger puzzle. If you’re deciding whether to own Campbell's, you should also grasp the company’s longer-term business quality and valuation.
We cheer for all companies serving everyday consumers, but in the case of Campbell's, we’ll be cheering from the sidelines. First off, its revenue growth was uninspiring over the last three years, and analysts expect its demand to deteriorate over the next 12 months. While its favorable brand awareness gives it meaningful influence over consumers’ dining decisions, the downside is its projected EPS for the next year is lacking. On top of that, its declining EPS over the last three years makes it a less attractive asset to the public markets.
Campbell’s P/E ratio based on the next 12 months is 9.9x. While this valuation is optically cheap, the potential downside is huge given its shaky fundamentals. There are better stocks to buy right now.
Wall Street analysts have a consensus one-year price target of $25.94 on the company (compared to the current share price of $21.71).
Although the price target is bullish, readers should exercise caution because analysts tend to be overly optimistic. The firms they work for, often big banks, have relationships with companies that extend into fundraising, M&A advisory, and other rewarding business lines. As a result, they typically hesitate to say bad things for fear they will lose out. We at StockStory do not suffer from such conflicts of interest, so we’ll always tell it like it is.