Flex (FLEX)
We’re wary of Flex. Its weak sales growth and declining returns on capital show its demand and profits are shrinking.― StockStory Analyst Team
1. News


2. Summary
Why Flex Is Not Exciting
Originally known as Flextronics until its 2016 rebranding, Flex (NASDAQ:FLEX) is a global manufacturing partner that designs, engineers, and builds products for companies across industries from medical devices to solar trackers.
- Responsiveness to unforeseen market trends is restricted due to its substandard adjusted operating margin profitability
- Lacking free cash flow limits its freedom to invest in growth initiatives, execute share buybacks, or pay dividends
- A silver lining is that its massive revenue base of $26.84 billion makes it a well-known name that influences purchasing decisions


Flex’s quality isn’t up to par. We see more lucrative opportunities elsewhere.
Why There Are Better Opportunities Than Flex


Flex’s stock price of $63.44 implies a valuation ratio of 18x forward P/E. This multiple is high given its weaker fundamentals.
We’d rather pay up for companies with elite fundamentals than get a decent price on a poor one. High-quality businesses often have more durable earnings power, helping us sleep well at night.
3. Flex (FLEX) Research Report: Q4 CY2025 Update
Global manufacturing solutions provider Flex (NASDAQ:FLEX) beat Wall Street’s revenue expectations in Q4 CY2025, with sales up 7.7% year on year to $7.06 billion. The company expects next quarter’s revenue to be around $6.9 billion, close to analysts’ estimates. Its non-GAAP profit of $0.87 per share was 10.5% above analysts’ consensus estimates.
Flex (FLEX) Q4 CY2025 Highlights:
- Revenue: $7.06 billion vs analyst estimates of $6.81 billion (7.7% year-on-year growth, 3.6% beat)
- Adjusted EPS: $0.87 vs analyst estimates of $0.79 (10.5% beat)
- Adjusted EBITDA: $524 million vs analyst estimates of $553.9 million (7.4% margin, 5.4% miss)
- Revenue Guidance for Q1 CY2026 is $6.9 billion at the midpoint, roughly in line with what analysts were expecting
- Management raised its full-year Adjusted EPS guidance to $3.24 at the midpoint, a 3.5% increase
- Operating Margin: 5.5%, in line with the same quarter last year
- Free Cash Flow Margin: 3.9%, similar to the same quarter last year
- Market Capitalization: $24.4 billion
Company Overview
Originally known as Flextronics until its 2016 rebranding, Flex (NASDAQ:FLEX) is a global manufacturing partner that designs, engineers, and builds products for companies across industries from medical devices to solar trackers.
Flex operates as a contract manufacturer and supply chain solutions provider, essentially serving as the behind-the-scenes production partner for many of the world's leading brands. The company's manufacturing capabilities span from initial product design and prototyping to full-scale production, testing, and global distribution.
The company divides its business into three main segments. Flex Agility Solutions focuses on rapid prototyping and manufacturing for fast-moving industries, helping clients quickly bring new products to market. Flex Reliability Solutions specializes in industries requiring high durability and consistent performance, managing complex supply chains for clients who prioritize long-term operational integrity. The Nextracker segment produces solar tracking systems and software that allow solar panels to follow the sun's movement throughout the day, significantly increasing energy production for solar installations.
A medical device company might engage Flex to design and manufacture a new diagnostic tool, leveraging Flex's expertise in healthcare regulations and precision manufacturing. Similarly, a consumer electronics brand might partner with Flex to produce its latest gadget, relying on Flex's global supply chain to source components and assemble the final product.
Flex generates revenue by charging for its design, engineering, manufacturing, and supply chain management services. The company maintains manufacturing facilities across the Americas, Asia, and Europe, allowing it to serve clients globally while optimizing production costs and delivery times. This global footprint also helps clients navigate regional regulations and reduce shipping distances to end markets.
The company's business model benefits from the increasing trend of outsourced manufacturing, as many brands focus on product development and marketing while leaving the complexities of production to specialized partners like Flex.
4. Electronic Components & Manufacturing
The sector could see higher demand as the prevalence of advanced electronics increases in industries such as automotive, healthcare, aerospace, and computing. The high-performance components and contract manufacturing expertise required for autonomous vehicles and cloud computing datacenters, for instance, will benefit companies in the space. However, headwinds include geopolitical risks, particularly U.S.-China trade tensions that could disrupt component sourcing and production as the Trump administration takes an increasingly antagonizing stance on foreign relations. Additionally, stringent environmental regulations on e-waste and emissions could force the industry to pivot in potentially costly ways.
Flex competes with other contract manufacturers and electronics manufacturing services providers including Jabil (NYSE:JBL), Foxconn (TPE:2317), Sanmina (NASDAQ:SANM), and Celestica (NYSE:CLS). In its Nextracker solar business, competitors include Array Technologies (NASDAQ:ARRY) and various regional solar mounting system manufacturers.
5. Revenue Growth
A company’s long-term sales performance is one signal of its overall quality. Any business can experience short-term success, but top-performing ones enjoy sustained growth for years.
With $26.84 billion in revenue over the past 12 months, Flex is a behemoth in the business services sector and benefits from economies of scale, giving it an edge in distribution. This also enables it to gain more leverage on its fixed costs than smaller competitors and the flexibility to offer lower prices. However, its scale is a double-edged sword because finding new avenues for growth becomes difficult when you already have a substantial market presence. To expand meaningfully, Flex likely needs to tweak its prices, innovate with new offerings, or enter new markets.
As you can see below, Flex’s 2.8% annualized revenue growth over the last five years was sluggish. This shows it failed to generate demand in any major way and is a rough starting point for our analysis.
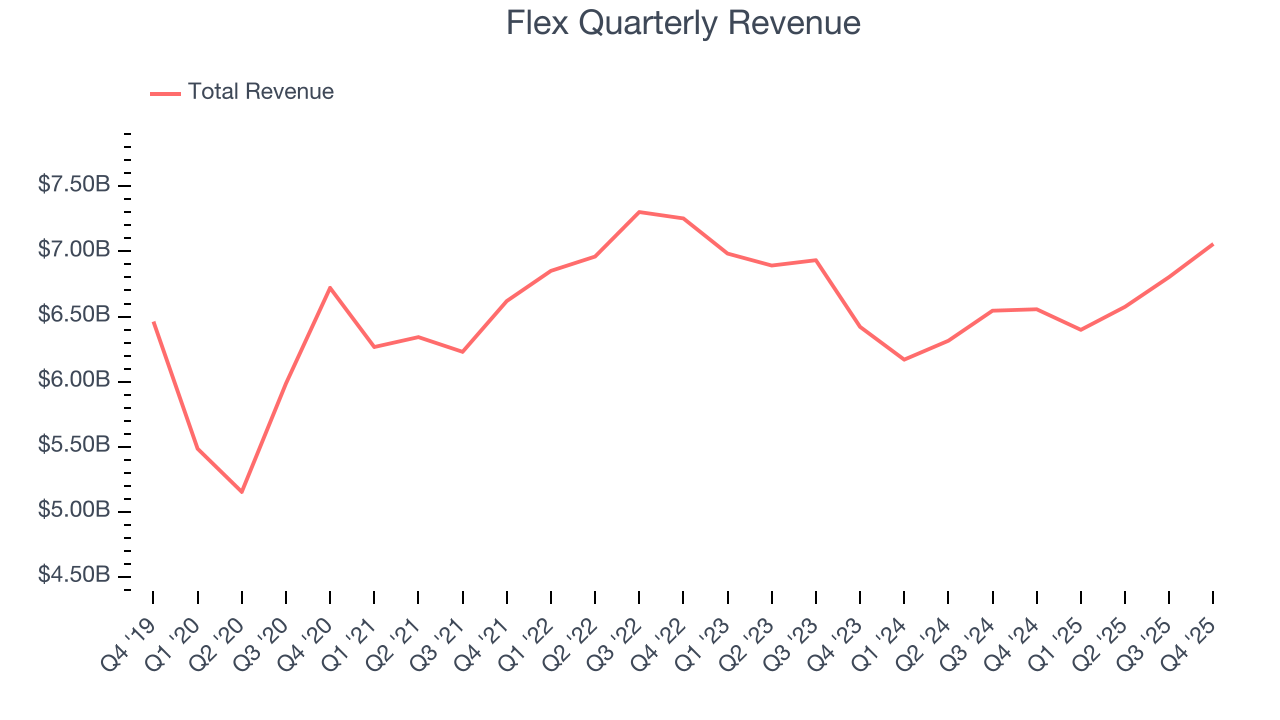
We at StockStory place the most emphasis on long-term growth, but within business services, a half-decade historical view may miss recent innovations or disruptive industry trends. Flex’s recent performance shows its demand has slowed as its revenue was flat over the last two years. 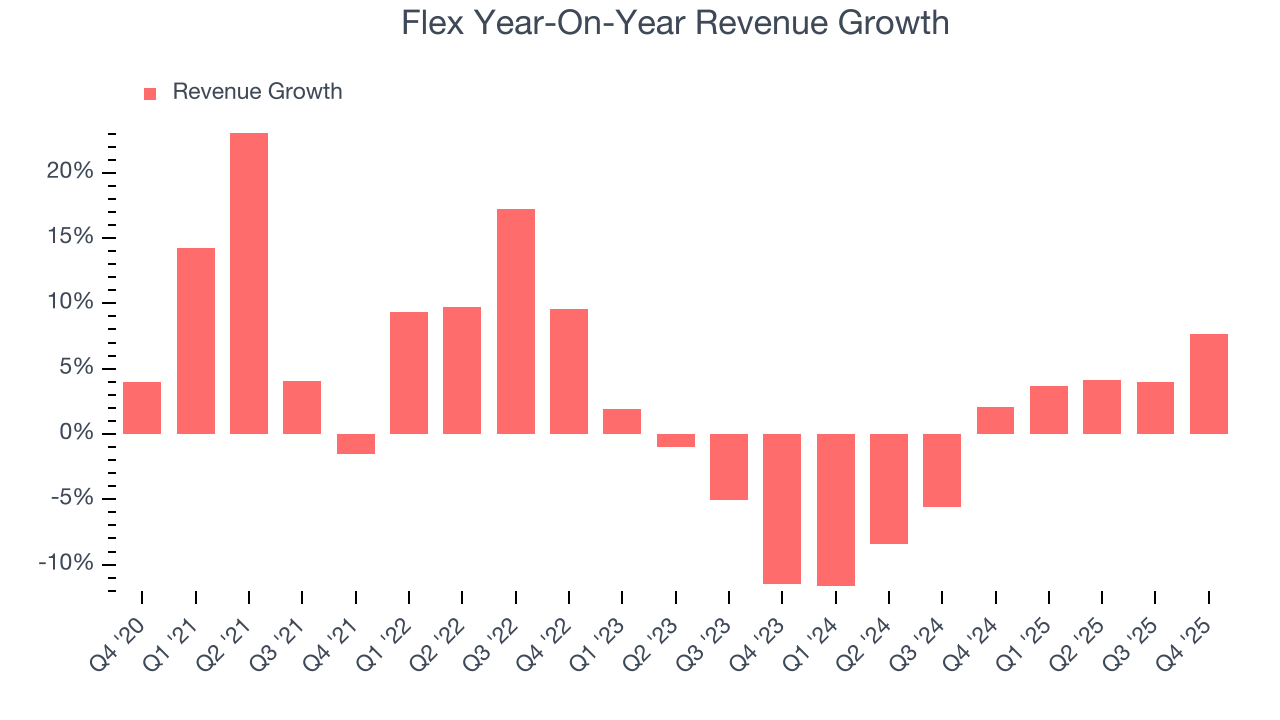
This quarter, Flex reported year-on-year revenue growth of 7.7%, and its $7.06 billion of revenue exceeded Wall Street’s estimates by 3.6%. Company management is currently guiding for a 7.8% year-on-year increase in sales next quarter.
Looking further ahead, sell-side analysts expect revenue to grow 5.6% over the next 12 months, an improvement versus the last two years. This projection is above the sector average and suggests its newer products and services will catalyze better top-line performance.
6. Operating Margin
Flex’s operating margin might fluctuated slightly over the last 12 months but has remained more or less the same, averaging 4% over the last five years. This profitability was lousy for a business services business and caused by its suboptimal cost structure.
Looking at the trend in its profitability, Flex’s operating margin might fluctuated slightly but has generally stayed the same over the last five years. This raises questions about the company’s expense base because its revenue growth should have given it leverage on its fixed costs, resulting in better economies of scale and profitability.
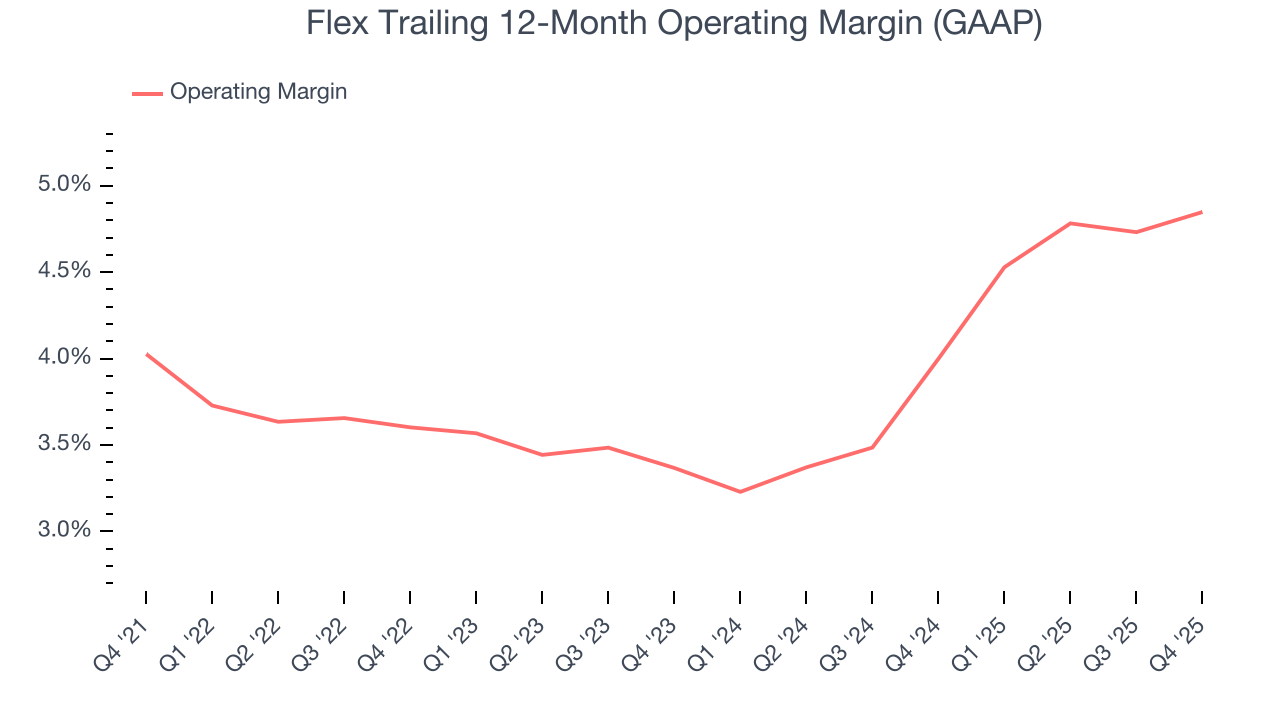
This quarter, Flex generated an operating margin profit margin of 5.5%, in line with the same quarter last year. This indicates the company’s overall cost structure has been relatively stable.
7. Earnings Per Share
Revenue trends explain a company’s historical growth, but the long-term change in earnings per share (EPS) points to the profitability of that growth – for example, a company could inflate its sales through excessive spending on advertising and promotions.
Flex’s EPS grew at an astounding 18% compounded annual growth rate over the last five years, higher than its 2.8% annualized revenue growth. This tells us the company became more profitable on a per-share basis as it expanded.
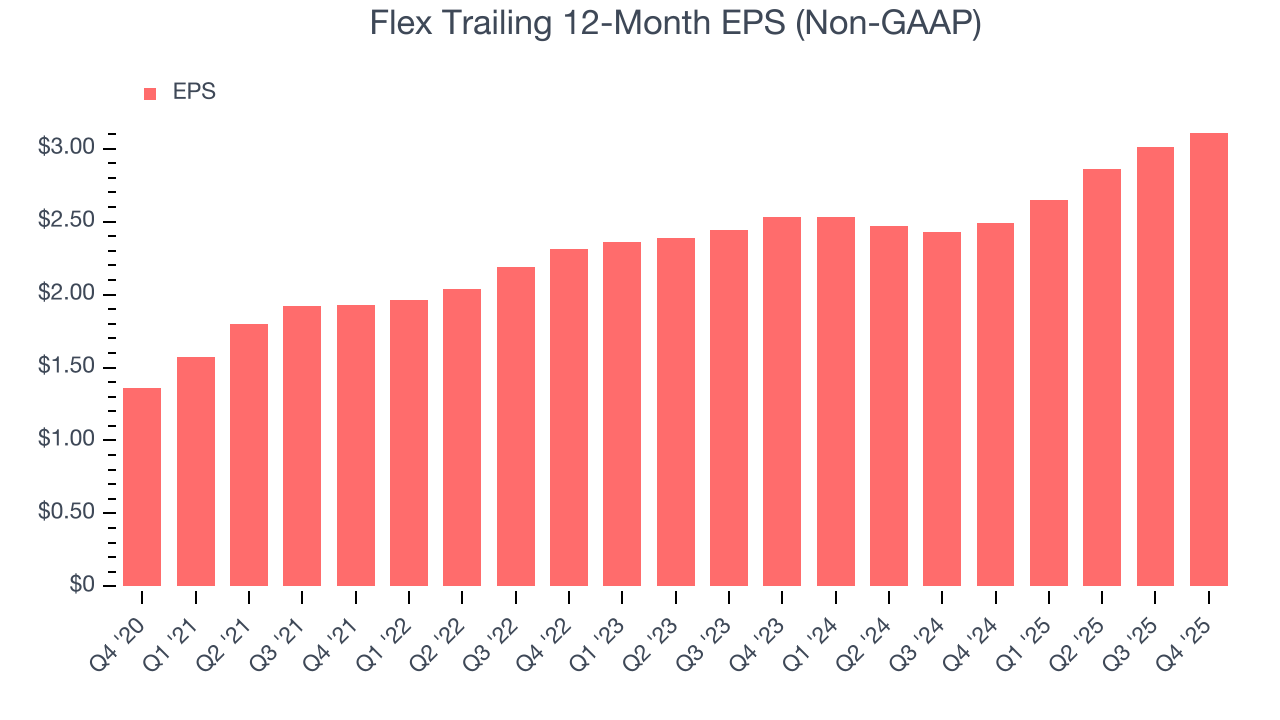
Like with revenue, we analyze EPS over a more recent period because it can provide insight into an emerging theme or development for the business.
For Flex, its two-year annual EPS growth of 10.9% was lower than its five-year trend. We hope its growth can accelerate in the future.
In Q4, Flex reported adjusted EPS of $0.87, up from $0.77 in the same quarter last year. This print easily cleared analysts’ estimates, and shareholders should be content with the results. Over the next 12 months, Wall Street expects Flex’s full-year EPS of $3.11 to grow 10.3%.
8. Cash Is King
If you’ve followed StockStory for a while, you know we emphasize free cash flow. Why, you ask? We believe that in the end, cash is king, and you can’t use accounting profits to pay the bills.
Flex has shown weak cash profitability over the last five years, giving the company limited opportunities to return capital to shareholders. Its free cash flow margin averaged 2.8%, subpar for a business services business.
Taking a step back, an encouraging sign is that Flex’s margin expanded by 2.8 percentage points during that time. The company’s improvement shows it’s heading in the right direction, and we can see it became a less capital-intensive business because its free cash flow profitability rose while its operating profitability was flat.
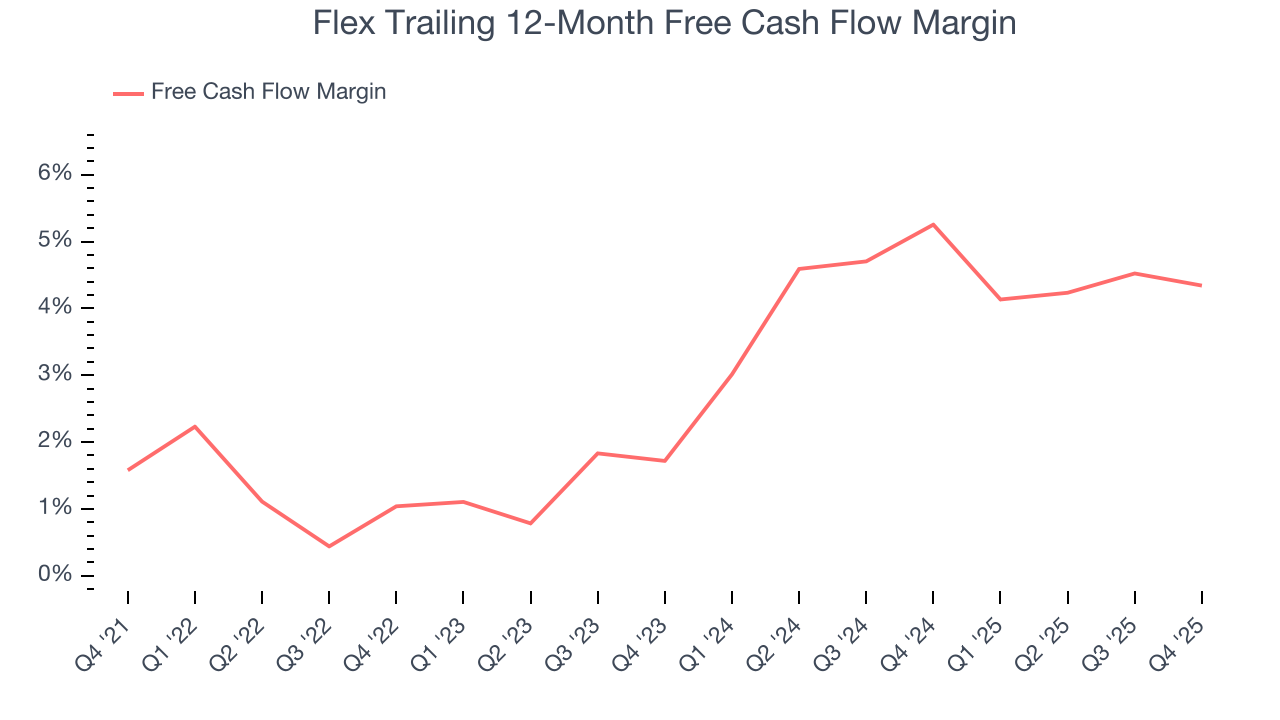
Flex’s free cash flow clocked in at $275 million in Q4, equivalent to a 3.9% margin. This cash profitability was in line with the comparable period last year and above its five-year average.
9. Return on Invested Capital (ROIC)
EPS and free cash flow tell us whether a company was profitable while growing its revenue. But was it capital-efficient? Enter ROIC, a metric showing how much operating profit a company generates relative to the money it has raised (debt and equity).
Although Flex hasn’t been the highest-quality company lately because of its poor top-line performance, it historically found a few growth initiatives that worked. Its five-year average ROIC was 15.7%, higher than most business services businesses.
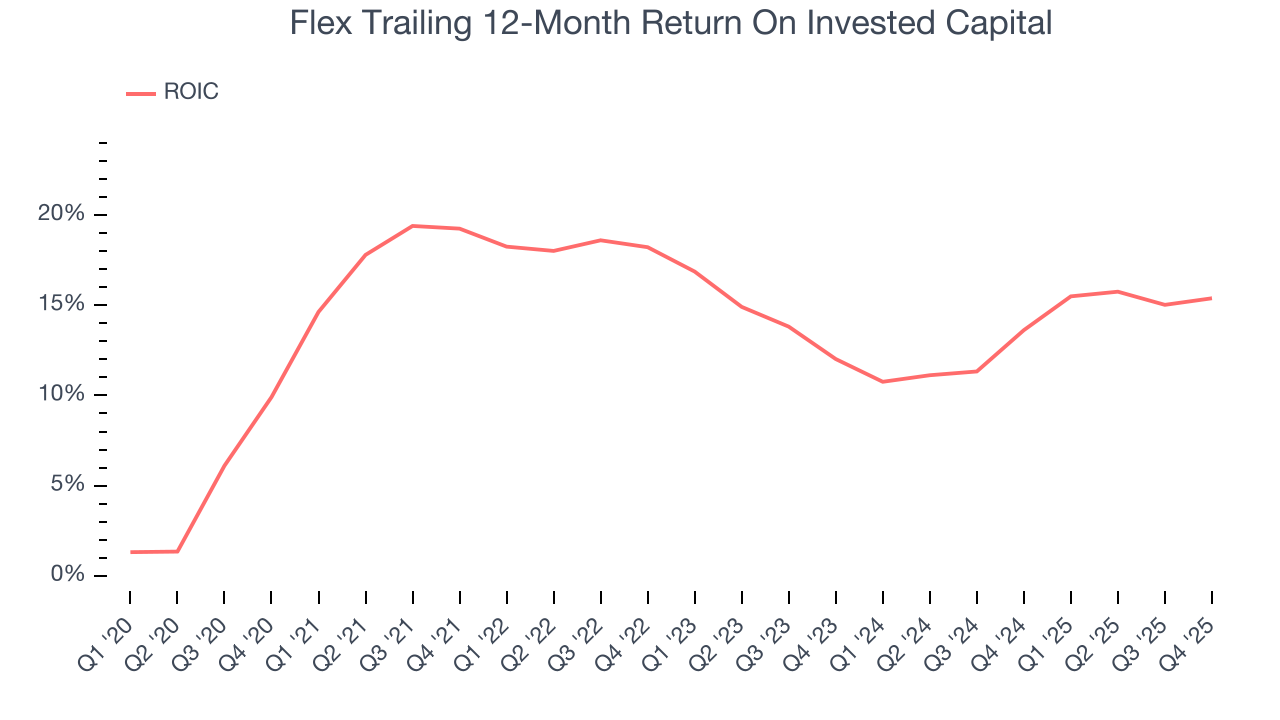
We like to invest in businesses with high returns, but the trend in a company’s ROIC is what often surprises the market and moves the stock price. Over the last few years, Flex’s ROIC averaged 4.2 percentage point decreases each year. We like what management has done in the past, but its declining returns are perhaps a symptom of fewer profitable growth opportunities.
10. Balance Sheet Assessment
Flex reported $3.06 billion of cash and $4.44 billion of debt on its balance sheet in the most recent quarter. As investors in high-quality companies, we primarily focus on two things: 1) that a company’s debt level isn’t too high and 2) that its interest payments are not excessively burdening the business.
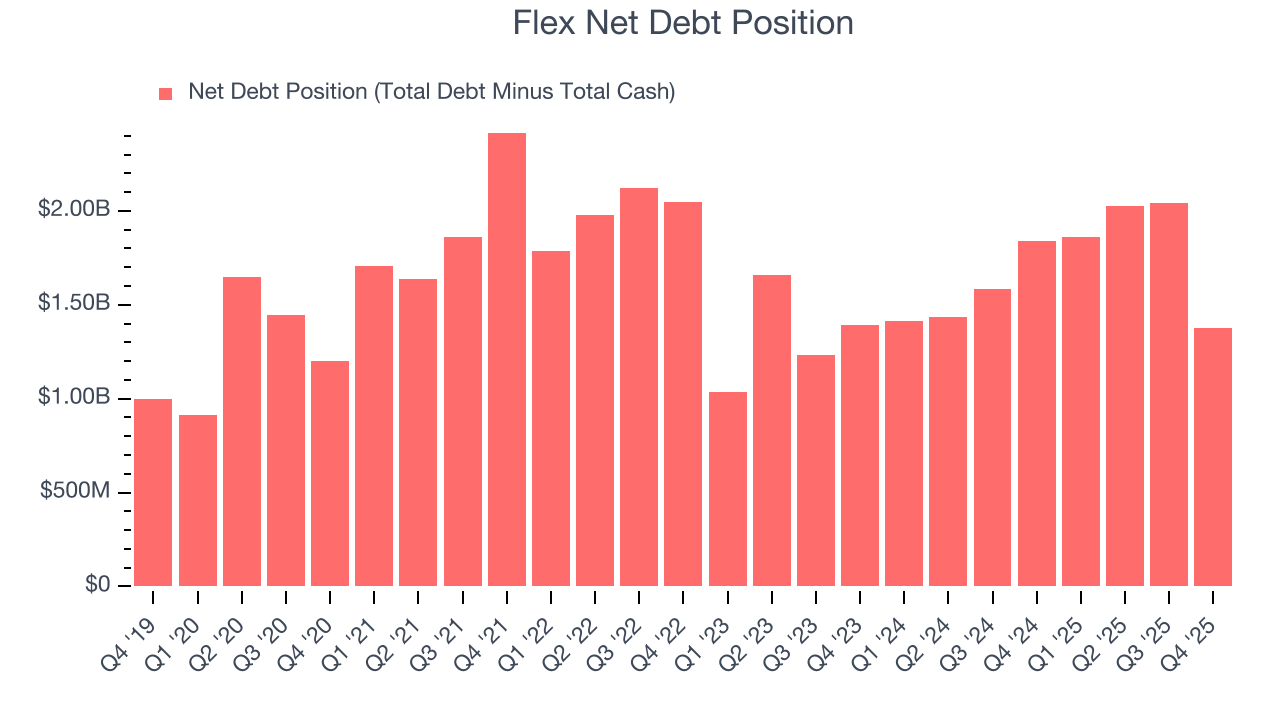
With $2.16 billion of EBITDA over the last 12 months, we view Flex’s 0.6× net-debt-to-EBITDA ratio as safe. We also see its $76 million of annual interest expenses as appropriate. The company’s profits give it plenty of breathing room, allowing it to continue investing in growth initiatives.
11. Key Takeaways from Flex’s Q4 Results
We enjoyed seeing Flex beat analysts’ full-year EPS guidance expectations this quarter. We were also glad its revenue outperformed Wall Street’s estimates. Overall, we think this was a solid quarter with some key areas of upside. The stock traded up 1.4% to $66.89 immediately following the results.
12. Is Now The Time To Buy Flex?
Updated: March 14, 2026 at 12:24 AM EDT
Before investing in or passing on Flex, we urge you to understand the company’s business quality (or lack thereof), valuation, and the latest quarterly results - in that order.
Flex isn’t a terrible business, but it doesn’t pass our bar. To begin with, its revenue growth was uninspiring over the last five years. While its scale makes it a trusted partner with negotiating leverage, the downside is its operating margins are low compared to other business services companies. On top of that, its low free cash flow margins give it little breathing room.
Flex’s P/E ratio based on the next 12 months is 18x. Beauty is in the eye of the beholder, but we don’t really see a big opportunity at the moment. We're pretty confident there are superior stocks to buy right now.
Wall Street analysts have a consensus one-year price target of $75.44 on the company (compared to the current share price of $63.44).
Although the price target is bullish, readers should exercise caution because analysts tend to be overly optimistic. The firms they work for, often big banks, have relationships with companies that extend into fundraising, M&A advisory, and other rewarding business lines. As a result, they typically hesitate to say bad things for fear they will lose out. We at StockStory do not suffer from such conflicts of interest, so we’ll always tell it like it is.