
Semtech (SMTC)
We wouldn’t buy Semtech. Its negative returns on capital show it destroyed shareholder value by losing money.― StockStory Analyst Team
1. News


2. Summary
Why We Think Semtech Will Underperform
A public company since the late 1960s, Semtech (NASDAQ:SMTC) is a provider of analog and mixed-signal semiconductors used for Internet of Things systems and cloud connectivity.
- Persistent operating margin losses and eroding margin over the last five years point to its preference for growth over profits
- Push for growth has led to negative returns on capital, signaling value destruction, and its shrinking returns suggest its past profit sources are losing steam
- Weak free cash flow margin of 9.3% has deteriorated further over the last five years as its investments increased


Semtech doesn’t meet our quality standards. We’re looking for better stocks elsewhere.
Why There Are Better Opportunities Than Semtech


At $91.88 per share, Semtech trades at 45.5x forward P/E. This valuation multiple seems a bit much considering the quality you get.
There are stocks out there similarly priced with better business quality. We prefer owning these.
3. Semtech (SMTC) Research Report: Q3 CY2025 Update
Semiconductor company Semtech (NASDAQ:SMTC) met Wall Streets revenue expectations in Q3 CY2025, with sales up 12.8% year on year to $267 million. The company expects next quarter’s revenue to be around $273 million, coming in 2.7% above analysts’ estimates. Its non-GAAP profit of $0.48 per share was 7.9% above analysts’ consensus estimates.
Semtech (SMTC) Q3 CY2025 Highlights:
- Revenue: $267 million vs analyst estimates of $266.6 million (12.8% year-on-year growth, in line)
- Adjusted EPS: $0.48 vs analyst estimates of $0.45 (7.9% beat)
- Adjusted EBITDA: $62.7 million vs analyst estimates of $60.14 million (23.5% margin, 4.3% beat)
- Revenue Guidance for Q4 CY2025 is $273 million at the midpoint, above analyst estimates of $265.9 million
- Adjusted EPS guidance for Q4 CY2025 is $0.43 at the midpoint, below analyst estimates of $0.44
- EBITDA guidance for Q4 CY2025 is $56 million at the midpoint, below analyst estimates of $58.79 million
- Operating Margin: 11.6%, up from 7.5% in the same quarter last year
- Free Cash Flow Margin: 16.7%, up from 12.3% in the same quarter last year
- Inventory Days Outstanding: 132, down from 138 in the previous quarter
- Market Capitalization: $5.54 billion
Company Overview
A public company since the late 1960s, Semtech (NASDAQ:SMTC) is a provider of analog and mixed-signal semiconductors used for Internet of Things systems and cloud connectivity.
Semtech was founded in 1960 by Gustav H.D. Franzen and Harvey Stump, Jr. The two initially started Semtech to provide components for companies with aerospace and military contracts. The company went public in 1967.
Semtech is a pioneer and leader in LoRa (long range) technology for radio communication, which has become the de facto wireless platform of Internet of Things. LoRa encodes information on radio waves using chirp pulses, making its transmission robust against disturbances over longer distances and superior over WiFi and Bluetooth. LoRa is also well-suited for applications that transmit small chunks of data with low bit rate, making it ideal for the sensors that operate in low power mode found in IoT applications.
In addition, Semtech offers a portfolio of signal integrity products for optical data communications and video transport. The company’s signal integrity chips can be found in wireless base stations that enable cellular communications and high-definition broadcasts that enable television technologies.
Semtech’s customers include major OEMs and their subcontractors in the infrastructure, consumer, and industrial end markets. Semtech outsources the majority of manufacturing functions to third-party foundries and assembly contractors.
Competitors offering analog and mixed-signal semiconductors for infrastructure and communications include Cisco (NASDAQ:CSCO), KORE Group (NYSE:KORE), and NXP Semiconductors (NASDAQ:NXPI).
4. Revenue Growth
Examining a company’s long-term performance can provide clues about its quality. Any business can put up a good quarter or two, but many enduring ones grow for years. Thankfully, Semtech’s 12.6% annualized revenue growth over the last five years was impressive. Its growth beat the average semiconductor company and shows its offerings resonate with customers. Semiconductors are a cyclical industry, and long-term investors should be prepared for periods of high growth followed by periods of revenue contractions.
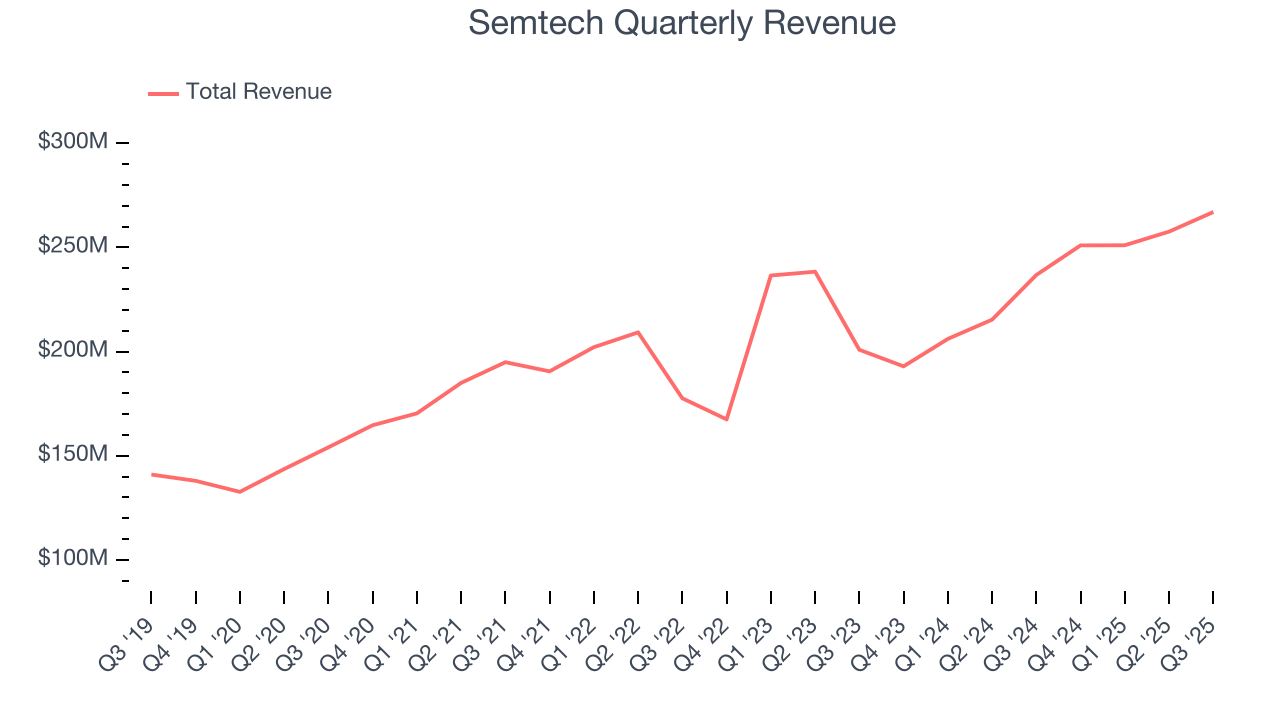
Long-term growth is the most important, but short-term results matter for semiconductors because the rapid pace of technological innovation (Moore's Law) could make yesterday's hit product obsolete today. Semtech’s annualized revenue growth of 10.3% over the last two years is below its five-year trend, but we still think the results suggest healthy demand. 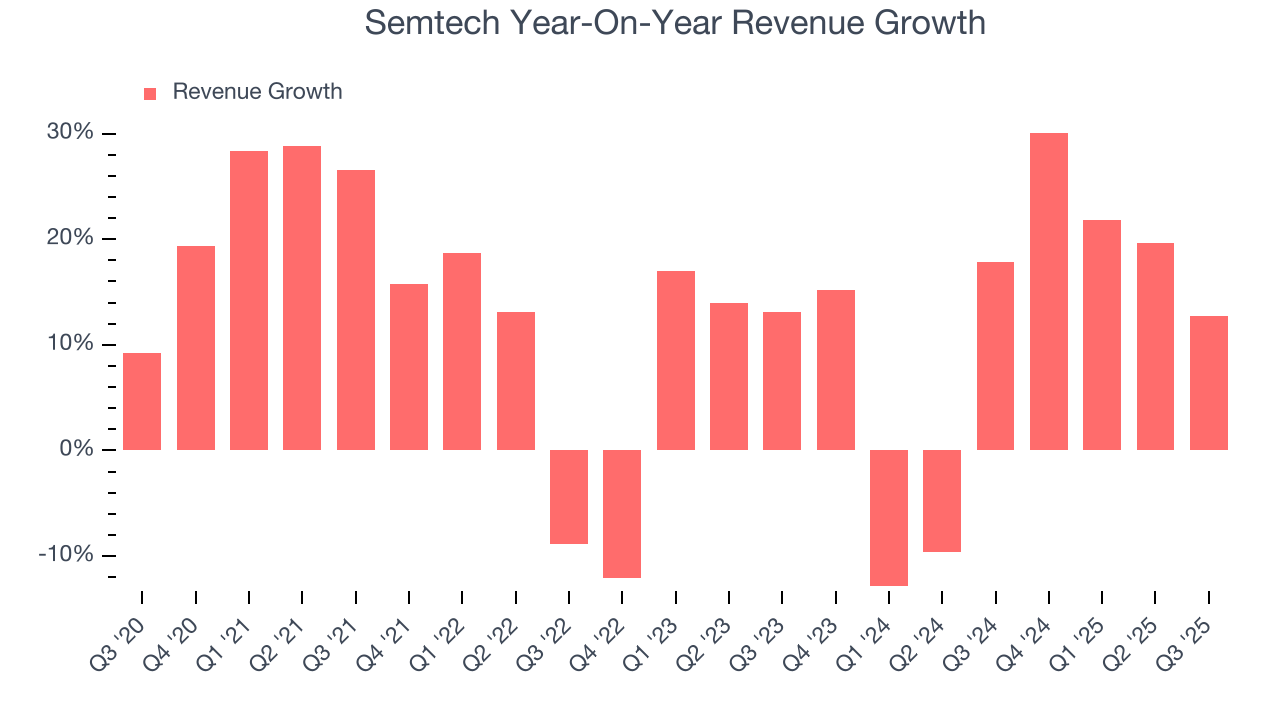
This quarter, Semtech’s year-on-year revenue growth was 12.8%, and its $267 million of revenue was in line with Wall Street’s estimates. Although the company met estimates, this was its third consecutive quarter of decelerating growth, potentially indicating a coming cyclical downturn. Company management is currently guiding for a 8.8% year-on-year increase in sales next quarter.
Looking further ahead, sell-side analysts expect revenue to grow 8.9% over the next 12 months, similar to its two-year rate. This projection doesn't excite us and implies its products and services will see some demand headwinds.
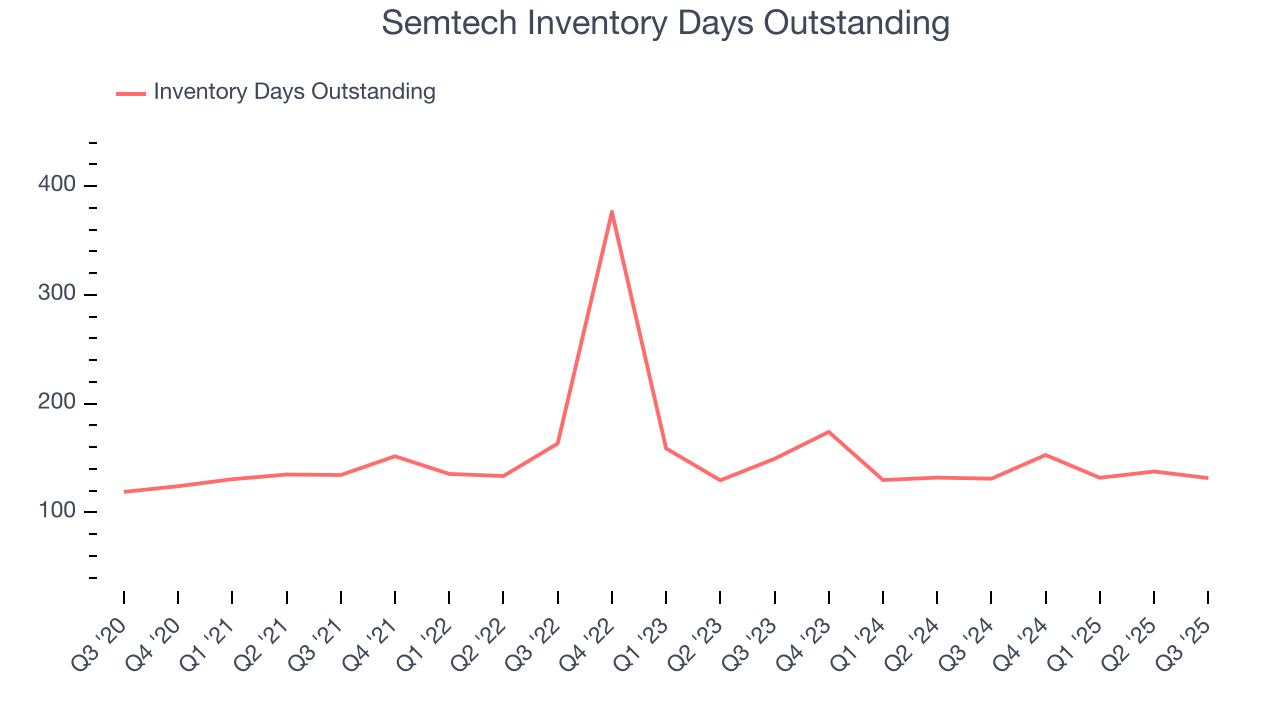
5. Product Demand & Outstanding Inventory
Days Inventory Outstanding (DIO) is an important metric for chipmakers, as it reflects a business’ capital intensity and the cyclical nature of semiconductor supply and demand. In a tight supply environment, inventories tend to be stable, allowing chipmakers to exert pricing power. Steadily increasing DIO can be a warning sign that demand is weak, and if inventories continue to rise, the company may have to downsize production.
This quarter, Semtech’s DIO came in at 132, which is 21 days below its five-year average. At the moment, these numbers show no indication of an excessive inventory buildup.
6. Gross Margin & Pricing Power
Gross profit margin is a key metric to track because it shows how much money a semiconductor company gets to keep after paying for its raw materials, manufacturing, and other input costs.
Semtech’s unit economics are reasonably high for a semiconductor business, pointing to a lack of meaningful pricing pressure and its products’ solid competitive positioning. As you can see below, it averaged an impressive 51.5% gross margin over the last two years. Said differently, Semtech paid its suppliers $48.47 for every $100 in revenue. 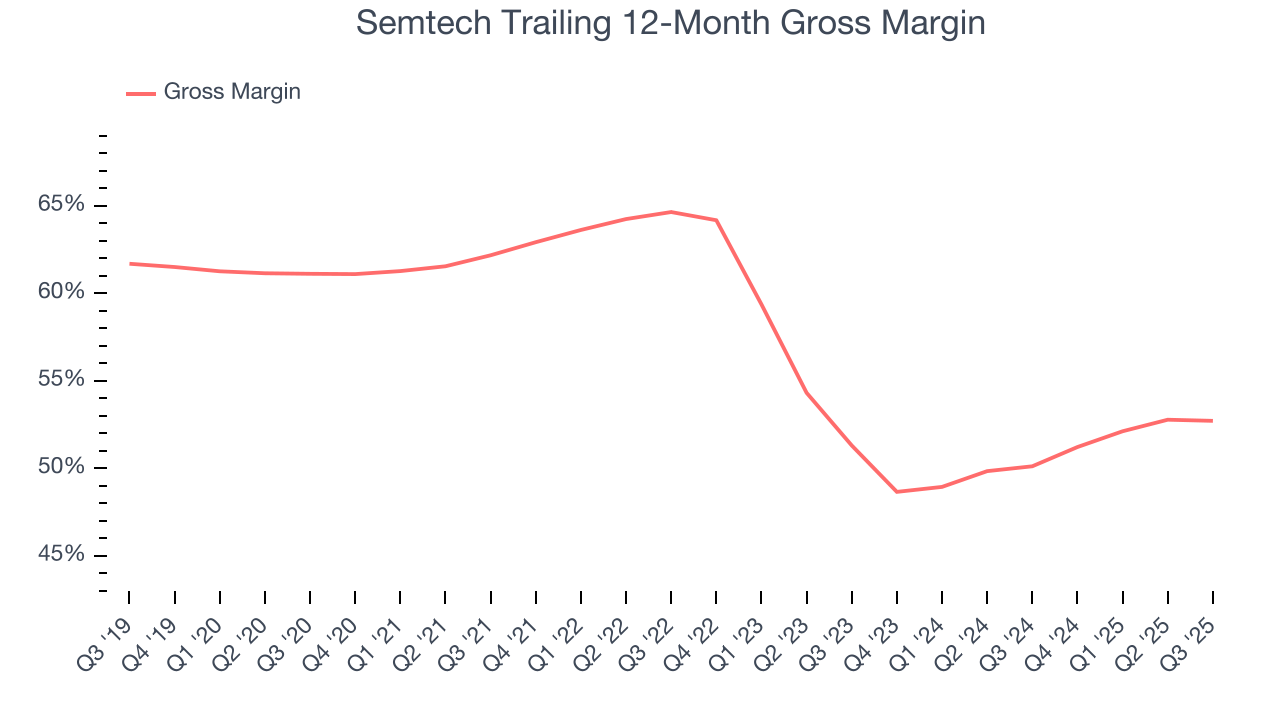
In Q3, Semtech produced a 51.9% gross profit margin, in line with the same quarter last year. Zooming out, Semtech’s full-year margin has been trending up over the past 12 months, increasing by 2.6 percentage points. If this move continues, it could suggest better unit economics due to more leverage from its growing sales on the fixed portion of its cost of goods sold (such as manufacturing expenses).
7. Operating Margin
Operating margin is one of the best measures of profitability because it tells us how much money a company takes home after procuring and manufacturing its products, marketing and selling those products, and most importantly, keeping them relevant through research and development.
Although Semtech was profitable this quarter from an operational perspective, it’s generally struggled over a longer time period. Its expensive cost structure has contributed to an average operating margin of negative 27.6% over the last two years. Unprofitable semiconductor companies require extra attention because they could get caught swimming naked when the tide goes out. It’s hard to trust that the business can endure a full cycle.
Analyzing the trend in its profitability, Semtech’s operating margin decreased by 9.9 percentage points over the last five years. This raises questions about the company’s expense base because its revenue growth should have given it leverage on its fixed costs, resulting in better economies of scale and profitability. Semtech’s performance was poor no matter how you look at it - it shows that costs were rising and it couldn’t pass them onto its customers.
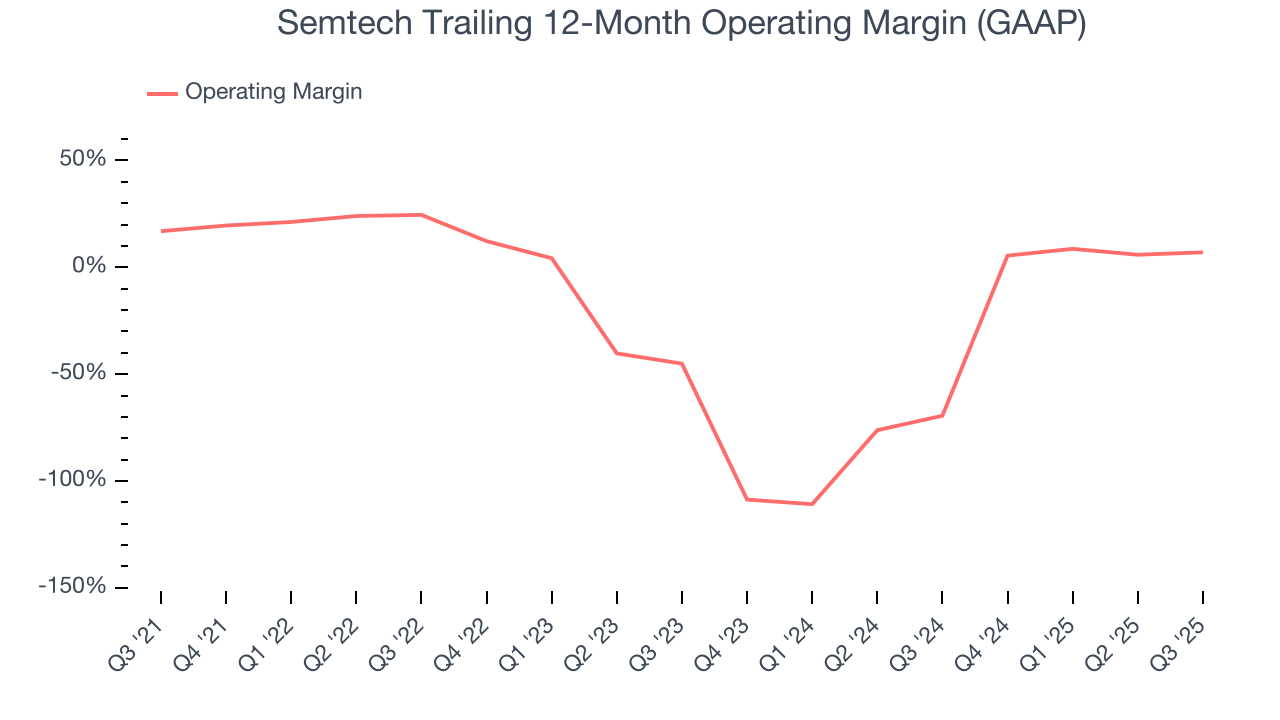
This quarter, Semtech generated an operating margin profit margin of 11.6%, up 4.1 percentage points year on year. The increase was encouraging, and because its operating margin rose more than its gross margin, we can infer it was more efficient with expenses such as marketing, R&D, and administrative overhead.
8. Earnings Per Share
We track the long-term change in earnings per share (EPS) for the same reason as long-term revenue growth. Compared to revenue, however, EPS highlights whether a company’s growth is profitable.
Semtech’s flat EPS over the last five years was below its 12.6% annualized revenue growth. This tells us the company became less profitable on a per-share basis as it expanded.
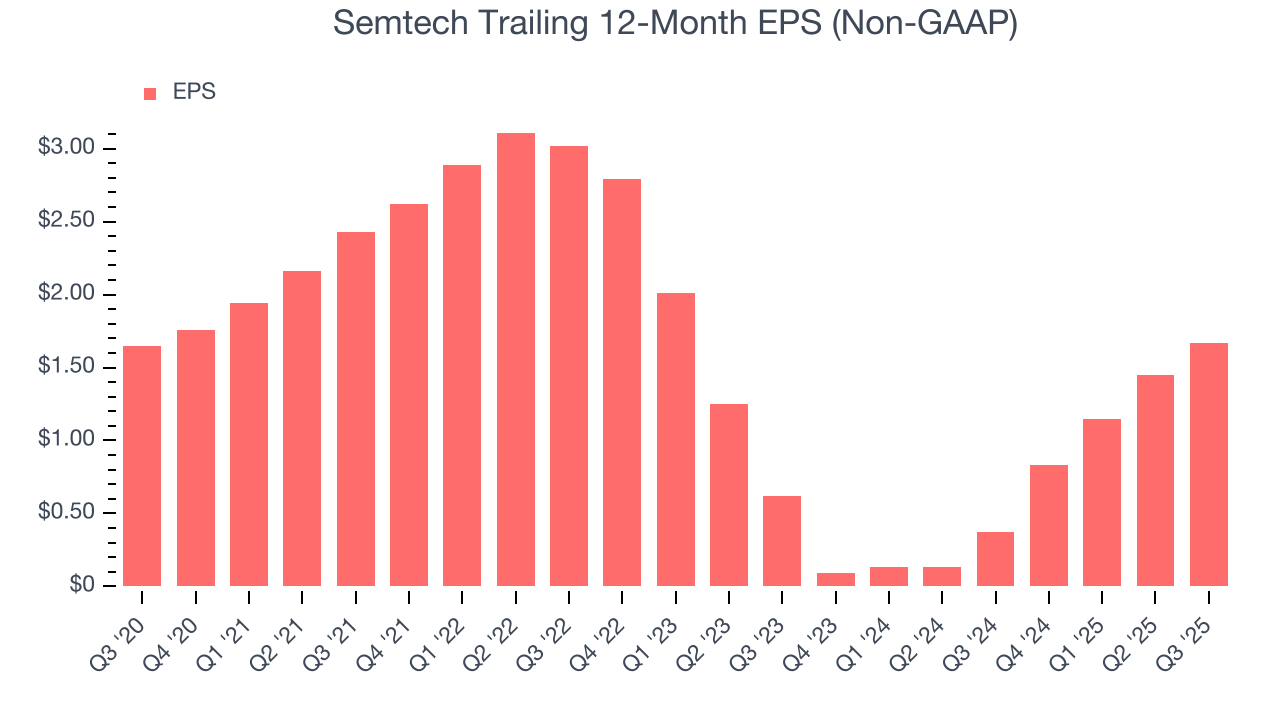
Diving into the nuances of Semtech’s earnings can give us a better understanding of its performance. As we mentioned earlier, Semtech’s operating margin expanded this quarter but declined by 9.9 percentage points over the last five years. Its share count also grew by 32.9%, meaning the company not only became less efficient with its operating expenses but also diluted its shareholders. 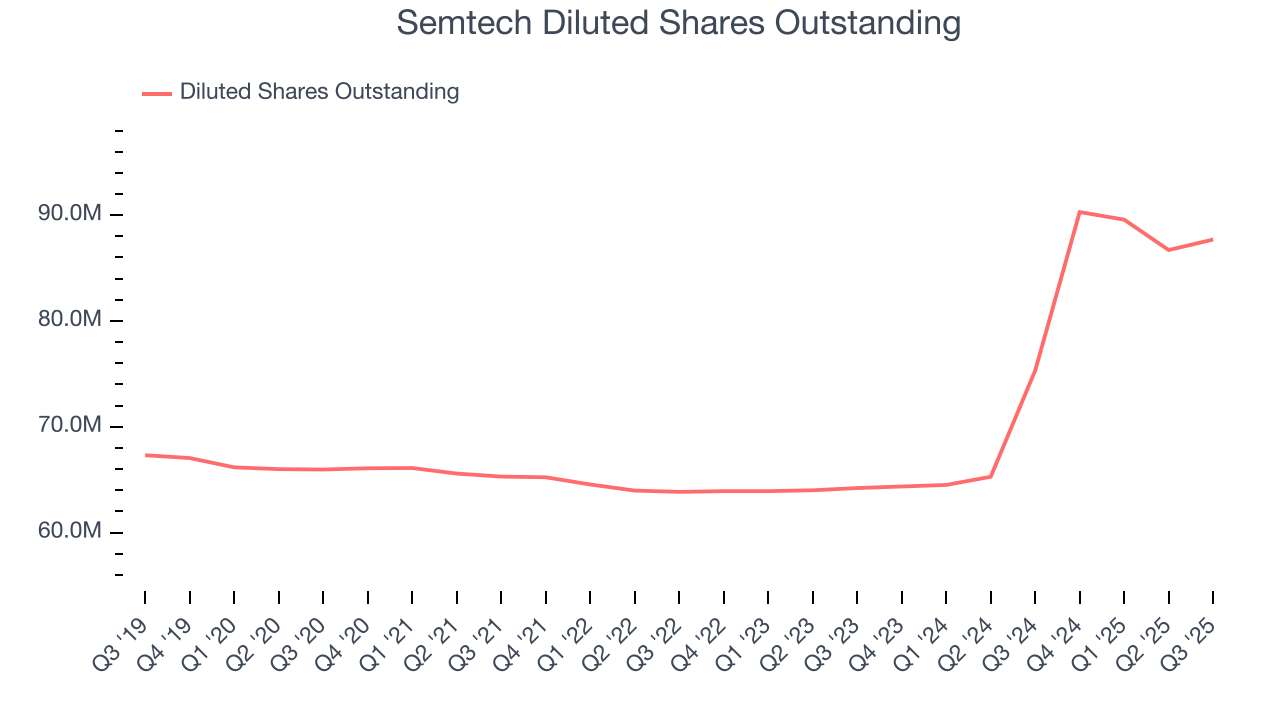
In Q3, Semtech reported adjusted EPS of $0.48, up from $0.26 in the same quarter last year. This print beat analysts’ estimates by 7.9%. Over the next 12 months, Wall Street expects Semtech’s full-year EPS of $1.67 to grow 17.1%.
9. Cash Is King
Free cash flow isn't a prominently featured metric in company financials and earnings releases, but we think it's telling because it accounts for all operating and capital expenses, making it tough to manipulate. Cash is king.
Semtech has shown weak cash profitability over the last two years, giving the company limited opportunities to return capital to shareholders. Its free cash flow margin averaged 9.3%, subpar for a semiconductor business.
Taking a step back, we can see that Semtech’s margin dropped by 7.1 percentage points over the last five years. It may have ticked higher more recently, but shareholders are likely hoping for its margin to at least revert to its historical level. Almost any movement in the wrong direction is undesirable because of its relatively low cash conversion. If the longer-term trend returns, it could signal it’s in the middle of a big investment cycle.
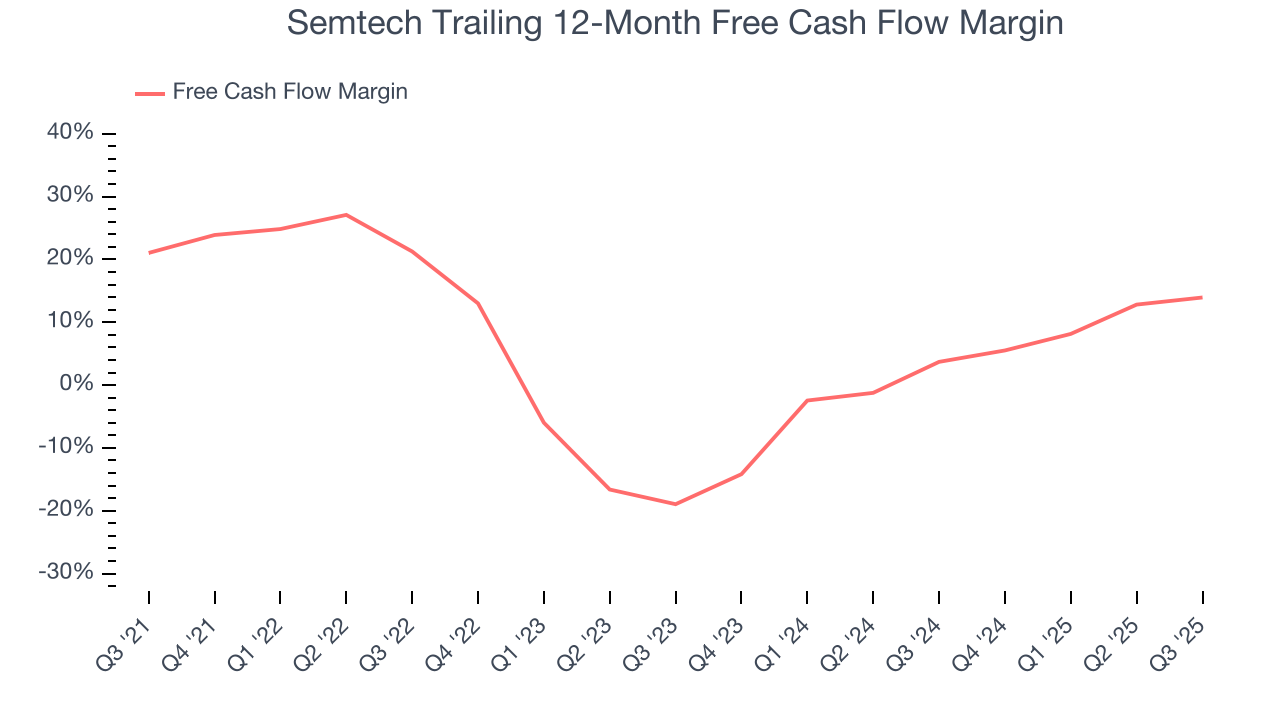
Semtech’s free cash flow clocked in at $44.6 million in Q3, equivalent to a 16.7% margin. This result was good as its margin was 4.4 percentage points higher than in the same quarter last year, but we wouldn’t put too much weight on the short term because investment needs can be seasonal, causing temporary swings. Long-term trends are more important.
10. Return on Invested Capital (ROIC)
EPS and free cash flow tell us whether a company was profitable while growing its revenue. But was it capital-efficient? A company’s ROIC explains this by showing how much operating profit it makes compared to the money it has raised (debt and equity).
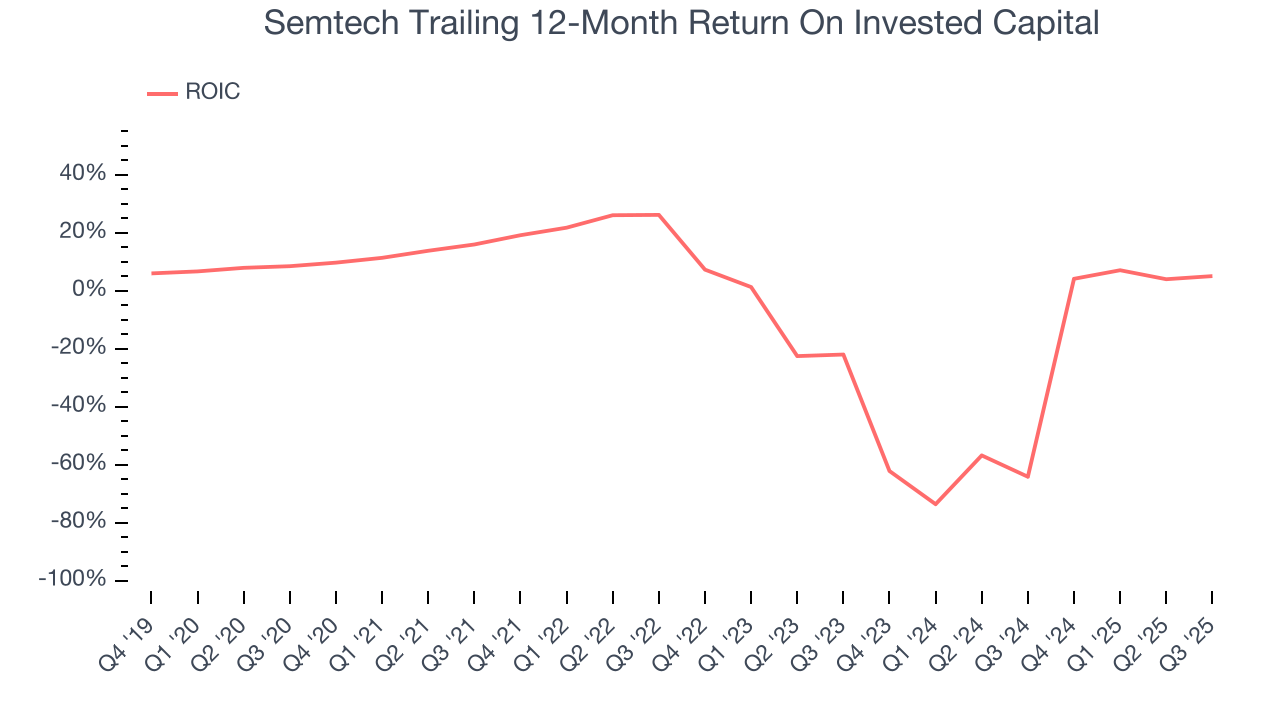
Semtech’s five-year average ROIC was negative 7.8%, meaning management lost money while trying to expand the business. Its returns were among the worst in the semiconductor sector.
11. Balance Sheet Assessment
Semtech reported $164.7 million of cash and $490.5 million of debt on its balance sheet in the most recent quarter. As investors in high-quality companies, we primarily focus on two things: 1) that a company’s debt level isn’t too high and 2) that its interest payments are not excessively burdening the business.
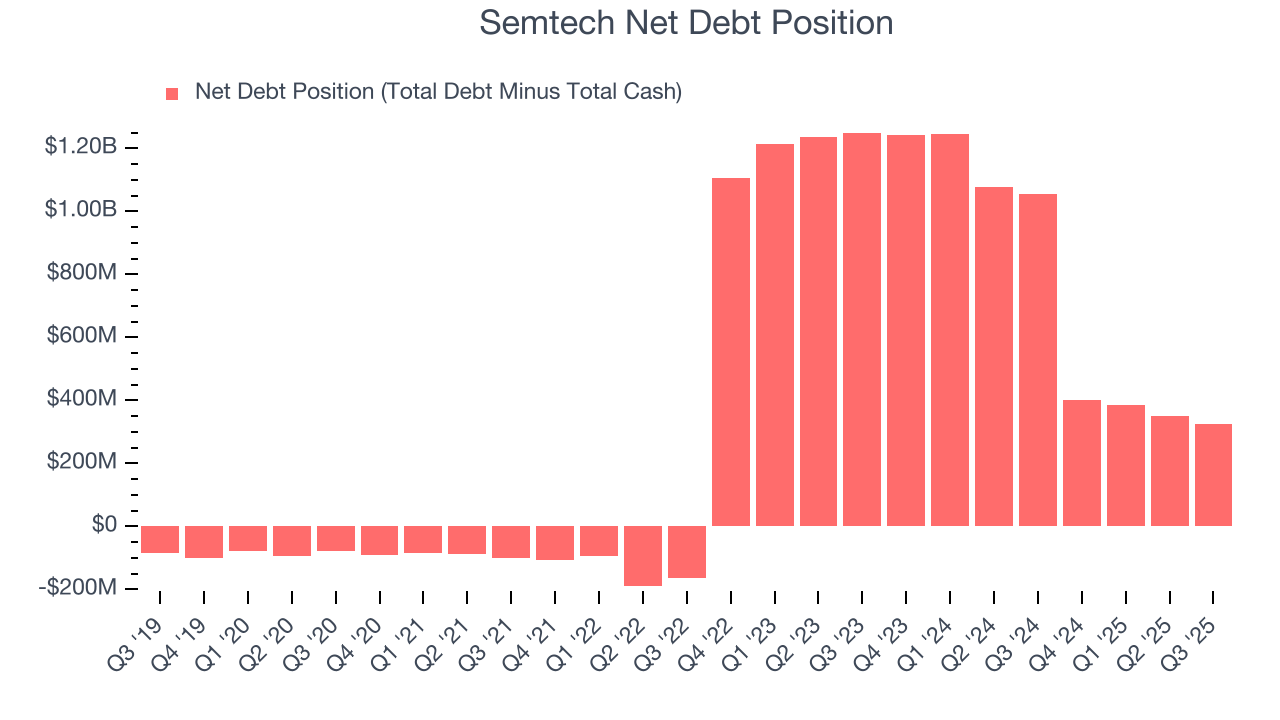
With $232.4 million of EBITDA over the last 12 months, we view Semtech’s 1.4× net-debt-to-EBITDA ratio as safe. We also see its $1.37 million of annual interest expenses as appropriate. The company’s profits give it plenty of breathing room, allowing it to continue investing in growth initiatives.
12. Key Takeaways from Semtech’s Q3 Results
It was good to see Semtech beat analysts’ EPS expectations this quarter. We were also glad its adjusted operating income outperformed Wall Street’s estimates. Overall, we think this was a solid quarter with some key areas of upside. The market seemed to be hoping for more, and the stock traded down 4.1% to $67.24 immediately following the results.
13. Is Now The Time To Buy Semtech?
Updated: February 25, 2026 at 9:32 PM EST
A common mistake we notice when investors are deciding whether to buy a stock or not is that they simply look at the latest earnings results. Business quality and valuation matter more, so we urge you to understand these dynamics as well.
Semtech doesn’t pass our quality test. Although its revenue growth was solid over the last five years and Wall Street believes it will continue to grow, its relatively low ROIC suggests management has struggled to find compelling investment opportunities. And while the company’s gross margins are decent for a semiconductor business, the downside is its operating margins reveal poor profitability compared to other semiconductor companies.
Semtech’s P/E ratio based on the next 12 months is 45.5x. At this valuation, there’s a lot of good news priced in - we think other companies feature superior fundamentals at the moment.
Wall Street analysts have a consensus one-year price target of $84.86 on the company (compared to the current share price of $91.88), implying they don’t see much short-term potential in Semtech.